 Open Access Article
Essential oil loaded pectin/chitosan nanoparticles preparation and optimization via Box–Behnken design against MCF-7 breast cancer cell lines†
Olivia A. Attallah ab,
Amro Shettaa,
Fatma Elshishinya and
Wael Mamdouh*a
aDepartment of Chemistry, School of Sciences and Engineering (SSE), The American University in Cairo (AUC), AUC Avenue, P.O. Box 74, New Cairo 11835, Egypt. E-mail: wael_mamdouh@aucegypt.edu
bPharmaceutical Chemistry Department, Faculty of Pharmacy, Heliopolis University, Cairo–Belbeis Desert Road, El Salam, Cairo 11777, Egypt
First published on 28th February 2020
Abstract
In the continuous search for effective cancer treatments, we here report a novel anticancer nanoparticulate system composed of jasmine oil (JO), an essential oil with proven anticancer activity and pectin/chitosan composite nanoparticles (Pec/CS NPs) as encapsulating materials to overcome JO's solubility and sensitivity problems using a green ionotropic gelation method. Pec/CS/JO NPs were formulated using Box–Behnken design (BBD) to estimate the interactions and effects of studied formulation variables on particle size, zeta potential and encapsulation efficiency to develop an optimized Pec/CS nanoformulation. The nano-encapsulation system preserved the consistency of total phenolic contents in JO and amended its thermal stability by 1.64 fold. The antioxidant potency of JO was enhanced after encapsulation by 96.28%. Consequently, the cytotoxic activity of bare Pec/CS NPs, pure JO and encapsulated JO in Pec/CS NPs against (MCF-7) breast cancer cells and (L-929) normal cells was evaluated using MTT assay. Encapsulated JO was more potent than pure JO with ≈13 fold improvement in anticancer activity, whereas the cell viability of normal cells wasn't affected but was rather enhanced when treated with Pec/CS NPs.
1 Introduction
Breast cancer is one of the most common cancer types that is spread among women worldwide.1 Over the past few decades there was significant progress in cancer treatment and diagnostics. Nevertheless, killing the tumor cells selectively without harming healthy ones provides a difficult task in the field of targeted cancer therapy.2 Most of the proposed and commercially available cancer treatments are usually accompanied by side effects caused by the loss of normal cells.2 Accordingly, there is a continuous necessity to develop new tactics for non-toxic cancer treatments.1Natural polysaccharides such as chitosan (CS) and pectin (Pec) are frequently utilized in pharmaceutical formulations due to their biodegradability and biocompatibility advantages.3 Pec is a polyanion with a large number of poly-D-galacturonic acid residues linked via α-1,4-glycosidic bonds.4 CS on the other hand is a polycation, consisting of linear chains of glucosamine and N-acetyl-D-glucosamine with intrinsic antimicrobial properties.3,5 Coacervation of both Pec and CS was found to mutually decrease their solubility in aqueous media thus avoiding the premature release of the encapsulated agent.6 Previous research studies indicate that Pec and CS have been formulated together as beads, microparticles, nanoparticles and coacervates for the purpose of delaying or sustaining drug release.6–9 Usually, there are several physicochemical conditions that need to be observed to maintain Pec/CS nano-complexes in solution form without the development of flocculates.7 Such conditions can be handled via adequate control of the molar ratios of Pec and CS and the presence of crosslinking agent.6,7
We here propose the nano-encapsulation of jasmine oil (JO), an example of essential oil that is normally obtained by steam distillation of Jasminum grandiflorum (Oleaceae family) flower in Pec/CS NPs.10 JO has been used as anti-depressant, antiseptic, aphrodisiac, anti-spasmodic, expectorant, parturient and sedative.11–15 In addition, JO was found to exhibit strong cytotoxicity toward human prostate carcinoma (PC-3), human lung carcinoma (A549) and human breast cancer (MCF-7) cell lines, thus rendering it as a potential anticancer agent.16
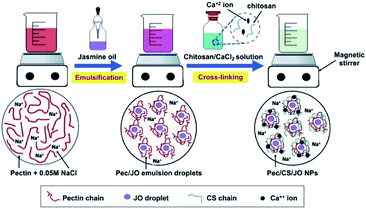
Unfortunately, JO as any other essential oil suffers poor solubility and has sensitivity problems which hinder its use in the various applications. Thus, the objective of this work is to improve the physical characteristics of JO and enhance its antioxidant and anticancer activities against MCF-7 breast cancer cells through its encapsulation in Pec/CS NPs. The nanoencapsulated JO (Pec/CS/JO NPs) were formulated using Box–Behnken Design (BBD) to ensure an optimum nanoformulation is produced. Pec/CS/JO NPs were prepared via emulsification followed by ionic gelation method as shown in (Fig. 1). Detailed experimental procedures and characterization results are given in the ESI.†
2 Results and discussion
The idea of preparing Pec/CS/JO NPs by inotropic gelation of Pec was based on the inherent ability of Pec to gel in the presence of divalent cations as CaCl2.17 Intermolecular hydrogen bonding and the electrostatic interaction between positive charge of amino groups in CS, and negative charge of carboxyl groups in Pec on the NPs' surface also served well in the cross-linking process.7 All the above mechanisms are illustrated in (Fig. S1†). Nevertheless, to avoid the formation of outstretched chains of polymer and thus losing the nanoparticulate form, NaCl salt (0.05 M) was introduced as solvent.17 Thus giving rise to a homogenous colloidal suspension. A pH 5–6 range was chosen for the fabrication process because the amino group of CS is protonated in this range.7 Pec/CS/JO NPs were obtained by mixing JO dissolved in dichloromethane with Pec solution then cross-linking the formed emulsion with a mixture of CS–CaCl2 solution. BBD was used to assess the interactions and effects of formulation variables (amount of Pec, CS, and cross-linker Ca2+) on three responses: particle size, zeta potential (ZP) and encapsulation efficiency (EE%), and consequently to develop an optimized Pec/CS formulation.Three-factor, three level BBD was created on which a series of experiments were performed. Table S3† presents the matrix of the experimental runs based on the chosen independent variables and responses. The range of particle size (Y1) for all experiments was 468.5–698.3 nm. Similarly, ZP (Y2) was −18.1 to −27.1 mV and the EE% (Y3) was 24.41–28.01%. A second quadratic model was applied on the studied responses and the suitability of this model was assessed by ANOVA, multiple correlation coefficient (R2) and lack of fit tests. The second-order quadratic model was able to produce the highest F value for the three responses (Y1, Y2 and Y3), thus, it was recognized as the fitting model. The model P-values, R2, term P-values and lack-of-fit test for each dependent variable or response are demonstrated in Table S4.† In the ANOVA test, the P-values after applying the quadratic model on the responses Y1, Y2 and Y3 were 0.0101, 0.0156 and 0.0019, respectively. Thus, with a (p < 0.05), all of the responses fit the model well. Furthermore, the lack of fit test was applied to compare the pure error with the residual error from the replicates of design points (this study had three center points).18 A model with a non-significant lack of fit value (Prob. > F value 0.1) is highly desirable.18 In the lack of fit test, the P-values of the quadratic model for responses Y1, Y2 and Y3 are 0.1865, 0.8424 and 0.5970, respectively. Thus, all of the responses presented a non-significant lack of fit (p > 0.1). Additionally, R2 value which signifies the multiple regression analysis for the second order quadratic model were determined to measure the amount of variation around the mean proposed by the quadratic model.18 In the current study, the adjusted R2 values for the responses Y1, Y2 and Y3 were 98.17%, 97.44% and 97.86%, respectively.
The effects and the interactions of the studied variables on the responses were analyzed using response surface plots. Noticeably, all the studied variables affected particle size (P-value < 0.05). However, the amount of Pec (X1) and CS (X2) had a more significant effect on particle size than the amount of cross-linker; CaCl2 (X3). (Fig. S2[a]†) shows the response surface for the relationship of particle size and amounts of Pec and CS (amount of CaCl2, fixed at 0.009 wt%). At the low level of X2, particle size increased from 468.5 to 625.2 nm when X1 was increased from 0.03 to 0.07 wt%. In addition, at the high level of X2, the particle size increased from 548.3 to 676.6 nm when X1 was increased from 0.03 to 0.07 wt%. Thus, the rate of particle size increase was in the range of 130–150 nm. Such results come in coordination with the work of Rampino et al. where for a given ratio between Pec and cross-linker, a size increase was observed as the mass fraction of CS increased. In addition, a remarkable size increase was observed when a high amount of Pec was used.4 The relationship between the particle size and the amount of Pec and CaCl2 is demonstrated by the response surface plot in (Fig. S2[b]†) (amount of CS, fixed at 0.025 wt%). It can be observed that at low level of X1, particle size increased from 522.5 to 552.7 nm when X3 was increased from 0.006 to 0.012 wt%. In addition, at the high level of X1, the particle size increased from 650 to 698.3 nm when X3 was increased from 0.006 to 0.012 wt%. Thus, the increase in particle size was in the range of 25–50 nm. Pec/CS/JO NPs were prepared using Pec as the key building moiety in a medium containing CS polymer and Ca2+ ions as cross-linker. Noticeably, the amounts of CS and Ca2+ ions used in the experiments are relatively low to avoid the formation of bulk gels in the preparation of nanoparticles.19 In addition, the difference in the rate of increase of particle size at increasing ratios of CS and Ca2+ to Pec could indicate that the cross-links formed by Ca2+ caused a simultaneous shrink in size and an increase in compactness of the particles formed more than CS cross-links.3
ZP indicates the surface charge and stability of the prepared Pec/CS/JO NPs. Following Table S4† ZP was significantly influenced by the amount of Pec (X1), the amount of CS (X2), (P-value < 0.05). The amount of CaCl2 (X3) did not significantly affect ZP. Pec is considered the main component of the NPs with the highest mass ratio and being anionic in nature due to the carboxylic groups the overall surface charge is expected to be negative.9 (Fig. S2[c]†) shows the effects of Pec (X1), CS (X2) and their interactions on the ZP of particles (Y2) at the middle level of CaCl2 (0.009 wt%). The increase in the amount of Pec (X1) from 0.03 to 0.07 wt% induced an increase in the negative potential from −20.8 to −27.1 mV and from −19.5 to −21.9 mV at the lower and higher levels of CS (X2) respectively. Conversely, the increase in the amount of CS (X2) from 0.015 to 0.035 wt% induced a decrease in the negative potential from −20.8 to −19.5 mV and from −27.1 to −21.9 mV at the lower and higher levels of Pec (X1) respectively. Such decrease can be attributed to the cationic nature of CS which creates a balance between positive and negative charges on NPs surface.9
EE% of JO (Y3) was significantly affected by all the independent variables (X1, X2 and X3) and the quadratic effect of X1 (P-value < 0.05). However, the amount of Pec (X1) and CS (X2) had a more significant effect on EE% than the amount of CaCl2 (X3) (Table S4†). Interestingly, amount of CaCl2 showed a significant interaction with amount of Pec (X1X3) and had a positive effect on Y3 with a coefficient of +0.15. (Fig. S2[d]†) shows the effects of X1, X2 and their interactions on JO EE% (Y3) when X3 was fixed at (0.009 wt%). It can be observed that the EE% (Y3) was increased from 24.41 to 26.16% upon increasing the amount of X1 from 0.03 to 0.07 wt% at the lower level of X2. Similarly, at the higher level of X2, the EE% changed from 25.49 to 28.01% but not linearly. Such results indicate that an increase in Pec concentration led to an increase in encapsulation efficiency. This confirmed the conclusions of previous studies which elucidate that Pec has a rapid gel-forming ability and high viscosity that led to stronger hydrogel matrix and production of optimum entrapment.8 Furthermore, the coefficients of X1 and X1X2 were positive, which means that EE% will rise along with increasing concentration of Pec and interaction between the two polymers Pec and CS.8
The optimum formulation was then chosen based on the proposed desired criteria (minimum particle size, maximum EE% and applying constrains on ZP (−20 to −27 mV)). The composition of optimized formulation is presented in (Table 1). A fresh batch with the optimized formula was prepared while keeping JO concentration at 2.5 mg in order to validate the calculated optimal factors and the predicted responses. Observed and predicted response values for the optimized formulation are presented in (Table 1). A fine agreement was found between the predicted and observed results which proved the validity of the suggested model. Thus, BBD succeeded in evaluating and optimizing the formulation Pec/CS/JO NPs.
| Independent variable | Optimized level |
|---|---|
| a *p > 0.05. | |
| X1: pectin conc. (wt%) | 0.055 |
| X2: chitosan conc. (wt%) | 0.035 |
| X3: CaCl2 conc. (wt%) | 0.008 |
| Over all desirability | 0.714 |
| Dependent variables | Expected | Observed |
|---|---|---|
| Y1: particle size (nm) | 604.73 | 597.7 |
| Y2: zeta potential (mV) | −23.04 | −23.3 |
| Y3: encapsulation efficiency (%) | 26.34 | 24.94 |
After successful optimization of the Pec/CS/JO NPs, the particle size, ZP and EE% of the prepared NPs were estimated to show the impact of varying JO concentration on the prepared NPs. As presented in (Fig. 2), JO concentration appeared to increase the particle size from 597.7 nm at 2.5 mg JO to 739.4 nm at 10 mg JO. The increase in the size of NPs can be attributed to the decreased coacervation between Pec and CS in the matrix due to the occupying of JO to the Pec domains.6
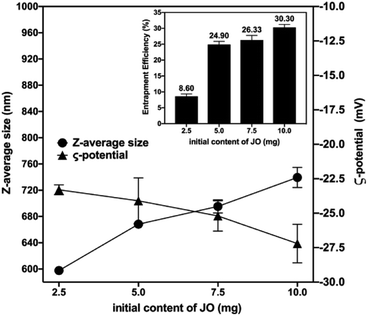 | ||
| Fig. 2 Effect of initial content of JO on particle size (nm), zeta potential (mV) and encapsulation efficiency (EE%). | ||
This was also concluded from the high ZP values of the formed NPs. As illustrated in (Fig. 2), Pec/CS/JO NPs had negative ZP values that ranged between −23.3 to −27.2 mV. Noticeably, as the concentration of encapsulated JO increased, an increase in the zeta potential values was observed for Pec/CS/JO NPs.
Furthermore, the effect of added JO amounts on EE% of Pec/CS/JO NPs is demonstrated in (Fig. 2). It can be noticed that as the concentration of JO increased from 2.5 mg to 10.0 mg the EE% was increased from 8.60% to 30.30%. Such low EE% can be attributed to the limited physical interactions between the hydrophobic JO and the hydrophilic polymer matrix where the majority of JO is likely to be localized on the surface of the particles.20 In such case, JO molecules on the particle surface were easily washed away during the washing and centrifugation processes, thus resulted in reduced EE. Another reason for low EE% against theoretical JO loading could be the decrease in NPs recovery which led to an enhanced JO loss.20
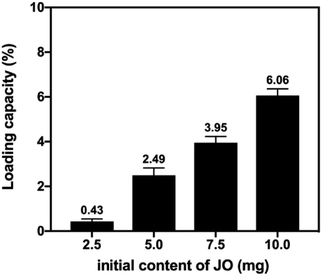
Moreover, the loading capacity% (LC%) of encapsulated JO was determined according to the procedures mentioned in (ESI†). As shown in (Fig. 3), the values ranged from 0.43–6.06%. Such results indicated that initial JO content had a significant effect on LC% which reached its maximum at 10 mg concentration of JO. Thus, 10 mg concentration for JO was selected to be the optimum content of JO for the rest of the study.
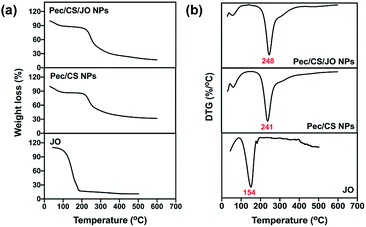
Different characterization techniques were performed to determine the physical and crystalline properties of Pec/CS/JO NPs. TEM images (Fig. S3†) of Pec/CS/JO NPs revealed spherical NPs with an average size of 150 ± 4 nm while the XRD pattern (Fig. S5†) showed a broad typical hump of amorphous material with the absence of the characteristic crystalline Pec peaks, indicating that Pec was changed to a noncrystalline form during the preparation process. Thermogravimetric analysis (TGA) was also executed to study the thermal stability of JO, Pec/CS NPs and Pec/CS/JO NPs. The temperature of maximum degradation rate (Td) for JO, Pec/CS NPs and Pec/CS/JO NPs was estimated from the first derivative of TGA curve at the maximum slopes of weight change (DTG) (Fig. 4[b]). TGA thermogram (Fig. 4[a]) of JO exhibited one-step mass loss starting at 50 °C and the value of Td for pure JO was 154 °C. Accordingly, these results designate the low thermal stability of pure JO. On the other hand, Pec/CS NPs showed two-step mass loss with Td values of 65 °C and 241 °C. Encapsulated JO in Pec/CS NPs exhibited a slight increase in the second step Td value reaching 248 °C as indicated in (Fig. 4[b]). Such observation designates an improvement in encapsulated JO's thermal stability by about 1.64 folds. Thus, Pec/CS NPs presented an acceptable thermal sheath for the encapsulation of JO.
In vitro release study of JO from Pec/CS/JO NPs was performed in different pH buffers (3.0, 5.5, and 7.4) for 48 h (Fig. 5). Noticeably, the medium pH had a great impact on JO release. JO released faster at pH 3.0 than at pH 5.5 and 7.4. At pH 3.0, both JO and Pec/CS NPs are positively charged, and the electronic repulsion facilitates the diffusion of JO from the NPs to the liquid phase.7 At pH 5.5 (pH used during crosslinking process), both JO and Pec/CS NPs were more hydrophobic, and the electrostatic interactions between them may cause low release of JO through the diffusion effect. Thus pH 5.5 showed the slowest release paradigm. At pH 7.4 JO release percentage was quite high in comparison to that of pH 5.5, possibly because of the swelling of the NPs and their erosion at this pH.8 In vitro release of JO was also tested against different release kinetics (Table S5†).
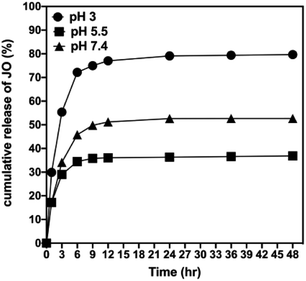 | ||
| Fig. 5 In vitro release profiles of JO from Pec/CS NPs in different pH media: pH 3, 5.5, and pH 7.4. | ||
The release of JO from the Pec/CS/JO system followed Korsmeyer–Peppas model (R2 above 0.76) which is based on plotting the log values of cumulative release percentage of JO against log time as shown in (Fig. S7†). Following Korsmeyer–Peppas model analysis, the release of the JO from Pec/CS/JO system is based on the diffusion from Pec/CS/JO matrix where the diffusion exponential (n) showed values below 0.45 in all buffers used.21 The diffusion constant (k) value was also used to study the release rate. The value of k was the highest for the release in acetate buffer solution with pH of 3.0 (39.26 min−1) indicating the fastest release rate among the other buffers used whereas the acetate buffer solution with pH of 5.5 showed the lowest K value (21.74 min−1) indicating the slowest release rate.
Total phenolic content (TPC) of pure JO, Pec/CS NPs, and encapsulated JO in Pec/CS NPs was quantified using Folin–Ciocalteu reagent.22 As displayed in (Fig. 6), each gram of bare Pec/CS NPs, pure JO and encapsulated JO in Pec/CS NPs was found to be equivalent to 81.97, 1116.11 and 1823.45 mg GAE, respectively. Noticeably, pure and encapsulated JO possessed higher TPC than Pec/CS NPs. Nevertheless, the TPC identified for encapsulated JO was significantly higher than that of the free JO (by 63.38%). Such results can be attributed to the increase in the surface area owing to oil droplet size reduction.22
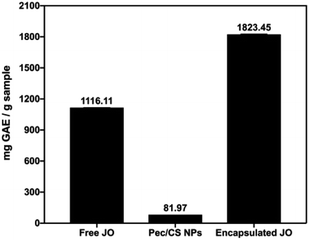 | ||
| Fig. 6 TPC of pure JO, Pec/CS NPs, and encapsulated JO in Pec/CS NPs expressed in (mg GAE/g sample). | ||
The antioxidant activity of encapsulated JO in Pec/CS NPs was also evaluated using 2,2-diphenyl-1-picrylhydrazyl radical (DPPH) free radical scavenging assay to determine the effect of nano-encapsulation on the oxidative properties of JO.22,23 Gallic acid which is a powerful antioxidant was used as a positive control with IC50 of 0.078 mg mL−1.22 As shown in (Fig. 7) Pec/CS NPs displayed an acceptable antioxidant activity with IC50 of 0.385 mg mL−1. This can be attributed to the DPPH scavenging activity of pectin, where the hydroxyl groups and electron transfer from (ROH or RO–) of pectin to DPPH˙ play an important role in termination of the radical chain reaction.23 On the other hand, pure JO and encapsulated JO in Pec/CS NPs had IC50 values of 0.269 and 0.01 mg mL−1 respectively. Thus, encapsulated JO antioxidant activity was significantly higher than that of pure JO (by 96.28%) which might be due to the combined antioxidant activity of both Pec and JO giving rise to more reactive oxygen species scavenging properties.23
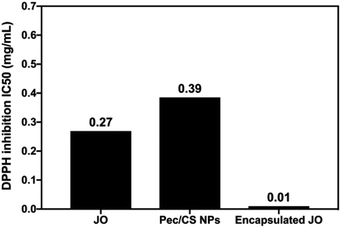 | ||
| Fig. 7 IC50 values for DPPH radical scavenging assay of pure JO, Pec/CS NPs, and encapsulated JO in Pec/CS NPs. | ||
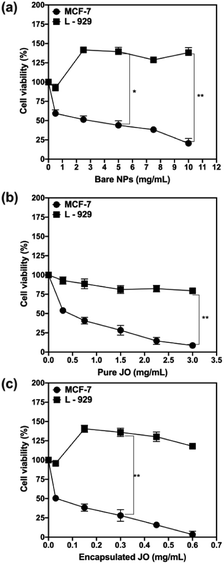
Consequently, the cytotoxicity of JO before and after encapsulation in Pec/CS NPs was determined on MCF-7 cell lines (ATCC HTB-22™) as an assessment of anticancer activity and on normal L-929 cell lines (ATCC CCL-1™) to evaluate the biocompatibility of the proposed nano-formulation. Both cell lines were purchased from the American Type Culture Collection (ATCC). The percent viability of MCF-7 and L-929 cells obtained for bare Pec/CS NPs (zero JO concentration), pure JO and encapsulated JO in Pec/CS NPs are shown in Fig. 8[a], [b] and [c] respectively. The obtained results revealed that the cytotoxicity of pure and encapsulated JO was concentration dependent and there was a decrease in the viability of the MCF-7 cells as the concentration of JO increased. On the other hand, almost improved cell viability was observed for the fibroblast cells (L-929 cells) when treated with bare Pec/CS NPs, pure JO and encapsulated JO in Pec/CS NPs. This indicates that the L-929 were metabolically active in the presence of the proposed nano-formulation which validate its biocompatibility. Such results come in coordination with reported literature on the efficacy of pectin and chitosan formulated as scaffolds for enhanced proliferation of L-929 cells24,25
Moreover, the IC50 values were calculated for MCF-7 cells and were found to be 3.17, 0.32 and 0.0246 mg mL−1 after 24 h treatment with bare Pec/CS NPs, pure JO and encapsulated JO in Pec/CS NPs, respectively. The IC50 values decreased ≈13 fold for encapsulated JO than the pure JO (Fig. 9). Such results can be attributed to the role played by the proposed nano-particulate system (Pec/CS) in enhancing the cytotoxic effect of JO, since earlier studies indicated that pectin induces DNA fragmentation which leads to cellular apoptosis in cancer cells.26
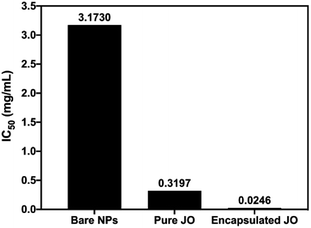 | ||
| Fig. 9 Estimated IC50 values of bare NPs, pure JO and encapsulated JO in Pec/CS NPs against MCF-7 cells. | ||
3 Conclusions
The present study successfully demonstrated that JO can be encapsulated by Pec/CS polyelectrolyte complex cross-linked with Ca2+. The effects of the three independent variables (amount of Pec, amount of CS and amount of CaCl2) on particle size, ZP and EE% were evaluated by BBD to study effects of the formulation variables on the studied responses. In addition, the results of the optimized formulation were very close to the estimated values, suggesting the success of the BBD in formulating the nanoparticulate system. In vitro release experiments demonstrated that JO was released from Pec/CS NPs faster at pH 3.0 than at pH 5.5 and pH 7.4 and the release tended to follow Korsmeyer–peppas model. TGA and Folin–Ciocalteu assay results showed the ability of Pec/CS NPs system to preserve the thermal stability and TPC of JO respectively. Encapsulated JO also exhibited excellent cyto-compatibility against normal cells and demonstrated better antioxidant and anticancer properties than free JO. Thus, we can conclude that nanoencapsulation is a useful tool for stabilizing the physicochemical properties of EOs like JO and improve their effectiveness for the various applications.Conflicts of interest
There are no conflicts to declare.Acknowledgements
The authors acknowledge the financial support received from the American University in Cairo (AUC) through Faculty Support Research Grants.Notes and references
- N. M. Elbaz, L. Ziko, R. Siam and W. Mamdouh, Sci. Rep., 2016, 6, 30729 CrossRef CAS PubMed.
- K. Das, S. Nimushakavi, A. Chaudhuri and P. K. Das, ChemMedChem, 2017, 12, 738–750 CrossRef CAS PubMed.
- S. Pistone, F. M. Goycoolea, A. Young, G. Smistad and M. Hiorth, Eur. J. Pharm. Sci., 2017, 96, 381–389 CrossRef CAS PubMed.
- A. Rampino, M. Borgogna, B. Bellich, P. Blasi, F. Virgilio and A. Cesàro, Eur. J. Pharm. Sci., 2016, 84, 37–45 CrossRef CAS PubMed.
- N. P. Birch and J. D. Schiffman, Langmuir, 2014, 30, 3441–3447 CrossRef CAS PubMed.
- S. O. Syed Mohamad Al-Azi, Y. T. F. Tan and T. W. Wong, React. Funct. Polym., 2014, 84, 45–52 CrossRef CAS.
- H. Wang, American Journal of Polymer Science and Technology, 2018, 3, 82 CrossRef.
- A. Fahrurroji, D. Thendriani and H. Riza, Int. J. Pharmacol. Pharm. Sci., 2017, 9, 98 CrossRef CAS.
- P. Ahlin Grabnar and J. Kristl, Pharmazie, 2010, 65, 851–852 Search PubMed.
- O. Prakash, D. Sahoo and P. K. Rout, Nat. Prod. Commun., 2012, 7, 89–92 CrossRef CAS PubMed.
- E. E. Elisha, S. J. Al-Maliki and D. K. Ibrahem, Pharm. Biol., 1988, 26, 221–227 CrossRef.
- M. H. Hur, Y. S. Yang and M. S. Lee, J. Evidence-Based Complementary Altern. Med., 2008, 5, 325–328 CrossRef PubMed.
- G. Zhao, Z. Yin and J. Dong, J. Ethnopharmacol., 2009, 125, 265–268 CrossRef CAS PubMed.
- T. Hongratanaworakit, Nat. Prod. Commun., 2010, 5, 157–162 CrossRef CAS PubMed.
- C. Rath, S. Devi, S. Dash and R. Mishra, Indian J. Pharm. Sci., 2009, 70, 238 CrossRef PubMed.
- Y. Zu, H. Yu, L. Liang, Y. Fu, T. Efferth, X. Liu and N. Wu, Molecules, 2010, 15, 3200–3210 CrossRef CAS PubMed.
- H. Jonassen, A. Treves, A. L. Kjøniksen, G. Smistad and M. Hiorth, Biomacromolecules, 2013, 14, 3523–3531 CrossRef CAS PubMed.
- D. W. Lee, N. Marasini, B. K. Poudel, J. H. Kim, H. J. Cho, B. K. Moon, H. G. Choi, C. S. Yong and J. O. Kim, J. Microencapsulation, 2014, 31, 31–40 CrossRef CAS PubMed.
- C. Y. Yu, Y. M. Wang, N. M. Li, G. S. Liu, S. Yang, G. T. Tang, D. X. He, X. W. Tan and H. Wei, Mol. Pharm., 2014, 11, 638–644 CrossRef CAS PubMed.
- I. Tekko, A. Maaz, W. Abdelwahed and S. Trefi, International Journal of Academic and Scientific Research, 2015, 3, 1–12 Search PubMed.
- P. L. Ritger and N. A. Peppas, J. Controlled Release, 1987, 5, 37–42 CrossRef CAS.
- A. Shetta, J. Kegere and W. Mamdouh, Int. J. Biol. Macromol., 2019, 126, 731–742 CrossRef CAS PubMed.
- S. Liu, X. Shi, L. Xu and Y. Yi, Chin. J. Oceanol. Limnol., 2015, 34, 372–381 CrossRef.
- N. zhao Yao, C. Huang and D. di Jin, Orthop. Surg., 2009, 1, 231–237 CrossRef PubMed.
- H. Y. Lin, H. H. Chen, S. H. Chang and T. S. Ni, J. Biomater. Sci., Polym. Ed., 2013, 24, 470–484 CrossRef CAS PubMed.
- S. K. Niture and L. Refai, Am. J. Pharmacol. Toxicol., 2013, 8, 9–19 CrossRef CAS.
Footnote |
| † Electronic supplementary information (ESI) available. See DOI: 10.1039/c9ra10204c |
| This journal is © The Royal Society of Chemistry 2020 |

