 Open Access Article
Mechanochemical defect engineering of HKUST-1 and impact of the resulting defects on carbon dioxide sorption and catalytic cyclopropanation†
Timothy Steenhaut *,
Nicolas Grégoire
 ,
Gabriella Barozzino-Consiglio
 ,
Yaroslav Filinchuk
 * and
Sophie Hermans
 *
*
Université catholique de Louvain, IMCN, Place Louis Pasteur 1/L4.01.03, 1348 Louvain-la-Neuve, Belgium. E-mail: timothy.steenhaut@uclouvain.be; yaroslav.filinchuk@uclouvain.be; sophie.hermans@uclouvain.be
First published on 27th May 2020
Abstract
Metal–organic frameworks (MOFs) are recognized as ideal candidates for many applications such as gas sorption and catalysis. For a long time the properties of these materials were thought to essentially arise from their well-defined crystal structures. It is only recently that the importance of structural defects for the properties of MOFs has been evidenced. In this work, salt-assisted and liquid-assisted grinding were used to introduce defects in a copper-based MOF, namely HKUST-1. Different milling times and post-synthetic treatments with alcohols allow introduction of defects in the form of free carboxylic acid groups or reduced copper(I) sites. The nature and the amount of defects were evaluated by spectroscopic methods (FTIR, XPS) as well as TGA and NH3 temperature-programmed desorption experiments. The negative impact of free –COOH groups on the catalytic cyclopropanation reaction of ethyl diazoacetate with styrene, as well as on the gravimetric CO2 sorption capacities of the materials, was demonstrated. The improvement of the catalytic activity of carboxylic acid containing materials by the presence of CuI sites was also evidenced.
Introduction
Among the wide variety of known porous materials, the quite recently discovered metal–organic frameworks (MOFs) show good potential for applications in gas sorption1–5 and catalysis.6–12 MOFs are made up of metal centres (or clusters) that are connected together by organic bridging ligands. These highly crystalline materials possess very high surface areas, up to 7000 m2 g−1,13 exceeding those of other porous compounds like zeolites14 or carbon derivatives.15–24 Because of their crystalline nature, the properties and performance of MOFs have been mainly explained by the presence of well-defined active sites arising from the ordered arrangement of ligands and metals into the framework. In particular, the metal centres are often coordinated to solvent molecules, present as synthesis residues. In some cases, those can be removed by simple thermal treatment, in a process commonly called ‘activation’, leading to coordinatively unsaturated sites (CUS).25 Those CUS are ideal for applications in catalysis26 and can also serve as preferential adsorption sites for a large range of gasses.27However, recent work demonstrated that in fact much more complex species, present as structural defects mainly resulting from missing linkers and/or metal nodes, are at work in those fascinating materials. Sometimes those defects are responsible for dramatic changes in the MOFs' properties.28–33 However, there is still a lot to be discovered concerning the formation and mode of action of those defects in both catalysis34 and gas sorption applications.35–38
We here focus on the introduction of defects in one of the most studied MOFs, namely HKUST-1.39 This material is based on copper(II) paddlewheel units that are connected together by the benzene-1,3,5-tricarboxylate ligand (BTC3−), which is the deprotonated form of trimesic acid (H3BTC) (Fig. 1).40 Being one of the most popular MOFs covered in the literature over the past few years, HKUST-1 has been extensively studied and some aspects dealing with defects inside its structure, either formed during the synthesis or upon exposure to moisture41 or solvents, have already been addressed. For example, the formation of defects in solvothermally obtained HKUST-1 by adding isophthalate as defective linker was studied by Zhang et al.42 Investigation through microscopic techniques were also performed to identify and localize inherent defect sites in this MOF.43,44 Strategies to overcome and reconstruct structural defects in HKUST-1 were also described.45–47
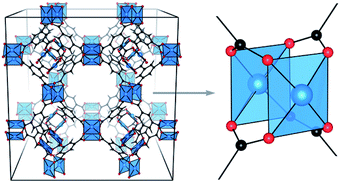 | ||
| Fig. 1 3D structural model of HKUST-1 (left) and zoom on Cu–Cu paddlewheel unit (right). Copper atoms are depicted in blue, oxygen in red and carbon in black. Reproduced from ref. 31 with permission from the Royal Society of Chemistry. | ||
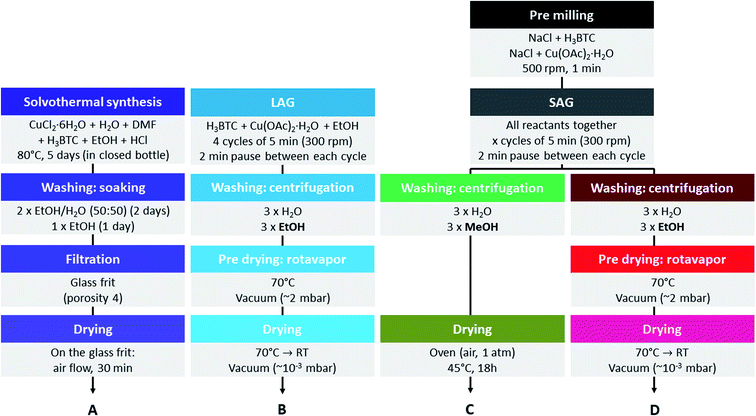
In this work, we aim at introducing defects into the structure of HKUST-1 without addition of defective linkers, but by modifying the synthesis conditions (Fig. 2). The defects will be characterized and their impact on the gas sorption and catalytic properties of the material evaluated. For this purpose, we used recently developed mechanochemical synthesis strategies, namely liquid-assisted grinding (LAG) using a small amount of ethanol48 and salt-assisted grinding (SAG).49 Mechanochemical synthesis of MOFs gives high yields of material and is therefore considered as a possible production method at industrial scale.50 The latter technique, SAG, was recently shown to be a convenient way to introduce mesoporosity into HKUST-1, leading to hierarchized solids. This approach consists in milling the precursors of the MOF, namely copper(II) acetate monohydrate and trimesic acid, in the presence of a given amount of salt, giving rise to the inclusion of very small salt particles, which are removable from the MOFs by simple washing. We used post-synthetic treatment procedures different from those described earlier.49 Our procedures consist in treating the MOFs with alcohols, which did not yield hierarchized porosity but allowed us to introduce in a controllable manner two types of structural defects. We determined the nature of these defects to be free carboxylic acid groups of the partially protonated ligand and reduced copper(I) sites, respectively. We systematically evaluated the carbon dioxide sorption properties of the materials to determine the influence of the defects on the interaction with this gas. We also tested all the obtained MOFs in the cyclopropanation of styrene with ethyl diazoacetate, as it was previously shown that HKUST-1 is able to efficiently catalyse this reaction.51
Materials and methods
Instrumental
Powder X-ray diffraction patterns were measured using a MAR345 diffractometer with X-rays generated by a Rigaku ultraX 18S X-ray generator (molybdenum anode, 0.71073 Å), with a monochromated beam (Xenocs FOX 3D mirror). The samples were prepared in glass capillaries (diameter: 0.7 mm). The raw data was integrated through the FIT2D software, using LaB6 (measured in a 0.1 mm diameter capillary) as a reference sample.Nitrogen sorption isotherms were measured at 77 K using a Micromeritics ASAP2020 equipment. All samples were activated at 150 °C under dynamic vacuum for 10 h prior to analysis.
Infrared spectra were recorded on a Bruker Alpha spectrometer equipped with a Platinum ATR module (diamond crystal) housed in an argon-filled glovebox in the 4000–370 cm−1 range with a resolution of 4 cm−1.
TGA measurements were performed on a Mettler Toledo TGA/DSC3+ system equipped with a sample robot. The used air flow was set at 100 ml min−1. An initial isotherm at 27 °C was applied during 15 minutes before heating the sample to 900 °C at a rate of 10 °C min−1.
NH3–TPD was used to evaluate the acidity of the HKUST SAG EtOH materials. A Hiden Catlab reactor combined with a QGA Hiden quadrupole mass spectrometer was used to perform these experiments. Samples were pretreated under Ar (40 ml min−1, 5.0 Air Liquide) at 200 °C during 90 minutes. NH3 adsorption was performed at 70 °C during 1 hour by flowing a mixture of Argon (20 ml min−1) and 5% NH3 in He (20 ml min−1) through the sample. The MOF was then flushed in Ar (40 ml min−1) during 90 minutes and then the NH3 desorption measurement was performed under Ar (40 ml min−1) from 70 to 300 °C (heating rate of 10 °C min−1).
XPS analyses were carried out with a SSI-X-probe (SSX 100/206) photoelectron spectrometer from Surface Science Instruments, equipped with a monochromatized microfocus Al X-ray source. The samples were prepared by sticking onto a double-face adhesive tape fixed onto small brass sample holders that were placed on an insulating ceramic carousel (Macor). An electron flood gun (8 keV) combined with a nickel grid were used to avoid charge effects. The CasaXPS software (Casa Software Ltd.) was used to perform the data treatment, using a Shirley type baseline and fixing the value of C 1s peak to 284.6 eV. The samples obtained through ball-milling were analyzed as obtained, whereas the single crystals were ground prior to analysis. The high vacuum (∼10−8 Torr) used in the analysis chamber made the samples change colour from light to dark blue, indicating in situ activation.
GC analyses were performed under helium flow (38.9 ml min−1) using a SHIMADZU GC2010 equipped with a Varian FactorFour VF-5ms (30 M × 0.25 MM ID DF = 0.25, part number CP8944) capillary column. The initial temperature of the oven was 50.0 °C (0.2 min equilibration time), which was raised at 5.0°C min−1 to 100.0 °C for elution (the column was then heated to 300.0 °C at 50.0 °C min−1 to ensure complete removal of any residue in the column). The temperature of the injection port was set at 250.0 °C.
1H-NMR spectra were recorded at room temperature (296 K) on a Bruker Avance II 300 spectrometer operating at 300.1 MHz for 1H. Experiments were run under TopSpin program (3.2 version, Bruker) using a BBFO {1H, X} probehead equipped with a z-gradient coil. 1H chemical shifts were referenced to the signal of the aromatic H of 1,3,5-trimethylbenzene (6.07 ppm) that was used as internal standard. For a correct quantification, T1 of styrene was determined by means of the inversion recovery sequence (see ESI†) and the recycle delay (d1) time was set at 30 s (T1 = 5 × d1) for the measurements to ensure that integration of the peaks yielded suitable quantitative values (with an error of ±1%).
Gravimetric carbon dioxide sorption experiments were realized using a Mettler Toledo TGA/DSC3+ system equipped with a sample robot. The samples were pretreated under He atmosphere (100 ml min−1), by heating to 200 °C (10 K min−1), followed by a 2 h isotherm and cooling to 27 °C (10 K min−1). The samples were then further purged with He for 30 min at 27 °C, before being subjected to 3 adsorption desorption cycles with CO2 (100 ml min−1, on adsorption) and He (100 ml min−1, on desorption). Carbon dioxide (N27; H2O ≤ 10 ppm, O2 ≤ 1000 ppm, N2 ≤ 4000 ppm) and helium (Alphagaz 1, ≥99.999%; H2O ≤ 3 ppm, O2 ≤ 2 ppm, CnHm ≤ 0.5 ppm) were supplied from Air Liquide.
Optical microscopy characterization was performed using a Euromex IS.1053-PLPOLRi polarizing microscope equipped with a Euromex VC 3036 camera. Calibration was realized using a 1 mm/100 (10 μm/division) calibration slide and images were collected using the ImageFocus 4 software.
Chemicals
Trimesic acid (98%) was purchased from Acros Organics. The used sodium chloride was food grade. Copper(II) acetate monohydrate (>99%, AnalaR) was purchased from the British Drug Houses Ltd. Denaturated ethanol (Technisolv, 99%), methanol (HiPerSolv, CHROMANORM), dimethylformamide (HiPerSolv, CHROMANORM), dichloromethane (HiPerSolv, CHROMANORM) and HCl 37% (AnalaR, NORMAPUR) were purchased from VWR Chemicals. Copper(II) chloride hexahydrate (min. 99%) was purchased from Riedel-de Haën. Ethyl diazoacetate (contains ≥13% dichloromethane) was purchased from Sigma-Aldrich. Styrene (99.5%) and trimethoxybenzene (99%) were purchased from Acros Organics. CDCl3 (D > 99.8%, H2O < 0.01%) was purchased from Euriso-top. Styrene was distilled under reduced pressure to eliminate stabilizers before use. All other chemicals were used as received.Syntheses
![[thin space (1/6-em)]](https://www.rsc.org/images/entities/char_2009.gif) :
:![[thin space (1/6-em)]](https://www.rsc.org/images/entities/char_2009.gif) 50 volume mixture of ethanol and water for 2 days, then were soaked one more day in ethanol. The crystals were then filtered out from the washing solution and allowed to dry at room temperature for 30 min before being stored in a closed glass vial.
50 volume mixture of ethanol and water for 2 days, then were soaked one more day in ethanol. The crystals were then filtered out from the washing solution and allowed to dry at room temperature for 30 min before being stored in a closed glass vial.The MOF samples obtained by SAG presented a much lower yield, whatever the nature of the solvents used for performing the washings, than when we used the LAG procedure (addition of some ethanol allows the reaction to be more complete).
Catalytic tests
Cyclopropanation reactions were carried-out in a 50 ml three-neck round-bottom flask equipped with a condenser and a glass stopcock connected to a Schlenk line. An ellipsoid shaped magnetic stirring bar was introduced into the flask (all the experiments were run at 300 rpm). 36 mg of the MOF sample was introduced in the experimental setup and heating to 150 °C under dynamic vacuum for 1 h was applied to activate the catalyst. The flask was allowed to cool down to room temperature (25 °C) and the volume was refilled with argon. 224 mg of 1,3,5-trimethoxybenzene (internal standard, 1.33 mmol) in 3 ml of CDCl3 was then introduced into the setup. 0.46 ml (4 mmol) of styrene was added to the stirred mixture. The reaction was initiated by the dropwise addition of EDA (containing ≥13% dichloromethane) diluted in 7 ml of CDCl3 over two hours using a syringe pump. After complete addition of the EDA, the reaction mixture was allowed to react for another 1 h. 1 ml was then sampled from the reaction mixture and the catalyst was separated by filtration on custom-made filter columns made from Pasteur pipettes filled with silica (±20 mm) that was retained through a small cotton wool plug. The filter was eluted by adding 1 ml of CDCl3 and 0.5 ml of the filtrate was used for 1H-NMR analysis.
Results and discussion
Crystal structure and textural properties
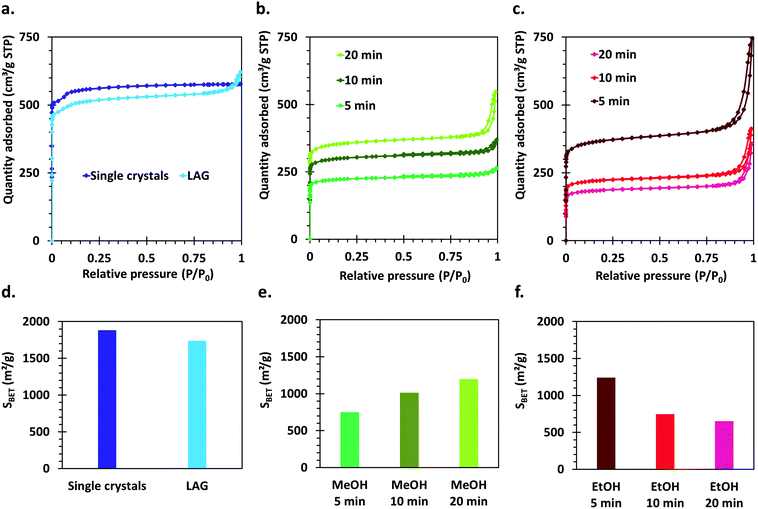
The crystal structure of all the synthesized MOF materials was verified by PXRD on the as-synthesized powders. All the obtained compounds show powder patterns revealing the presence of HKUST-1 as single phase (Fig. S1†). Some peak broadening as well as slightly bumpy background features can be observed for the materials synthesized by the SAG method compared to the LAG and single crystal samples. This, as well as differences in relative intensities of the peaks at 4.38° and 5.32°,52 is indicative of the presence of a significant amount of structural defects in those materials.Nitrogen sorption isotherms were measured for all the synthesized compounds. The single crystal sample shows a well-defined I (a) type isotherm, characteristic of microporous compounds,53 which is expected based on the crystal structure of HKUST-1 (Fig. 3a). The materials synthesized by the mechanochemical approaches also show a steep uptake at very low P/P0 values, typical of microporous solids. However, for those materials, hysteresis loops of the H4 type are also observed, which can be ascribed to the presence of intergrain spaces formed by the aggregation of small crystallites (Fig. 3a–c).
Importantly, the calculated Brunauer–Emmett–Teller (BET) surface areas of the samples vary largely according to the parameters used for the synthesis as well as the applied washing and drying procedures (Fig. 3d–f). The highest surface area is obtained for the HKUST-1 single crystals (1881 m2 g−1), directly followed by the sample made by LAG (1739 m2 g−1). The surface areas of the samples obtained by the SAG procedure decreases with increasing milling time when the post-synthetic treatment with ethanol is applied, which could be explained by degradation of the crystal structure under prolonged high-energy milling. However, the samples series washed with methanol and dried in an oven show the opposite tendency: the surface area increases with increasing milling time. This indicates that the structure rearranges upon removal of the sodium chloride particles trapped in the cavities formed during the mechanochemical synthesis, and that this rearrangement is dependent on the applied post-synthetic treatment.
Identification of defect sites
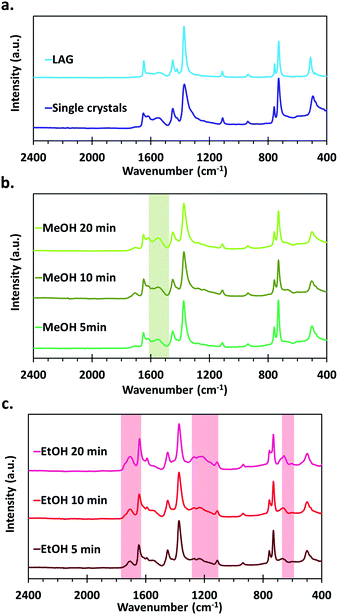
The FTIR spectra of the materials all show the typical vibration frequencies expected for the chemical bonds in HKUST-1 as described in earlier reports, the main features being νas and νsym of carboxylates that are present at 1649 and 1451 cm−1 respectively.46,54–56 In the as-synthesized samples, νC–O bands assigned to primary alcohols also appear at 1106 and 1042 cm−1 (Fig. S2†). Those disappear after thermal activation of the samples under vacuum at 150 °C, showing that this procedure is effective to desorb residual coordinated methanol and ethanol molecules. Furthermore, differences in the IR spectra appear between the various series of samples, indicating the formation of different types of defects, depending on the used synthetic procedure and applied post-synthetic treatment.An absorption band characteristic of C![[double bond, length as m-dash]](https://www.rsc.org/images/entities/char_e001.gif) O stretching of free carboxylic acids is observed at around 1710 cm−1 both for the MOFs obtained by SAG and in the form of single crystals, whereas this feature is not present in the one synthesized by LAG (Fig. 4). Interestingly, the intensity of this signal is quite weak for the samples treated with MeOH as well as for the single crystals. On the opposite, the samples that underwent the EtOH post-synthetic treatment show a significantly more intense absorption band that increases with increasing milling time used for the synthesis of the materials. The presence of –COOH functions in those samples is further confirmed by the presence of absorption bands around 1193 cm−1 (C–O stretching) and 1232 cm−1 (OH bending), typical of carboxylic acids.57 Furthermore, a shift of the νas band towards lower wavenumbers, from 1649 cm−1 to 1647, 1645 and 1643 cm−1 for the 5, 10 and 20 min milled samples, respectively, accompanies the increase of signals related to carboxylic acids.
O stretching of free carboxylic acids is observed at around 1710 cm−1 both for the MOFs obtained by SAG and in the form of single crystals, whereas this feature is not present in the one synthesized by LAG (Fig. 4). Interestingly, the intensity of this signal is quite weak for the samples treated with MeOH as well as for the single crystals. On the opposite, the samples that underwent the EtOH post-synthetic treatment show a significantly more intense absorption band that increases with increasing milling time used for the synthesis of the materials. The presence of –COOH functions in those samples is further confirmed by the presence of absorption bands around 1193 cm−1 (C–O stretching) and 1232 cm−1 (OH bending), typical of carboxylic acids.57 Furthermore, a shift of the νas band towards lower wavenumbers, from 1649 cm−1 to 1647, 1645 and 1643 cm−1 for the 5, 10 and 20 min milled samples, respectively, accompanies the increase of signals related to carboxylic acids.
The acidity of the EtOH treated samples obtained by SAG was investigated by ammonia temperature-programmed desorption (NH3–TPD) experiments (Fig. S3†). The obtained curves show the presence of two overlapped desorption peaks, one at about 150 °C and the other, less intense, at ∼200 °C. The same experiment was performed on the sample obtained by LAG which showed only one desorption peak at 150 °C. The peak at 150 °C can be assigned to desorption of NH3 coordinated to the copper sites of the MOF. The presence of a second peak at higher temperatures for the EtOH treated samples means that a second, more acidic, site is present, which is in this case attributed to the presence of –COOH moieties in the materials. This peak is especially visible for the sample obtained after 20 min of milling, which correlates with the most intense –COOH bands in the FTIR spectra.
The presence of free carboxylic acid moieties in the EtOH washed samples, especially for the 20 min EtOH material, is further supported by the weight losses observed in the TGA curves (Fig. S4†), which show an excess weight loss during the decomposition (61.2%, 61.5% and 68.8% for 5, 10 and 20 min milled samples respectively) compared to the value calculated for a perfect Cu3BTC2 formula without any defects (60.5%), considering a CuO residue. This means that the organic linker/metal ratio is higher than the one expected from the 2![[thin space (1/6-em)]](https://www.rsc.org/images/entities/char_2009.gif) :
:![[thin space (1/6-em)]](https://www.rsc.org/images/entities/char_2009.gif) 3 stoichiometric ratio. This observed excess of organic linker is in perfect agreement with the presence of free –COOH moieties. Moreover, the thermal stability of the EtOH treated SAG samples increases with the amount of present carboxylic acid sites (Fig. S4†). The thermal stability of the HKUST-1 materials was compared to starting copper acetate and trimesic acid and showed that the acetate has a lower decomposition temperature (289 °C) than HKUST-1 (between 300 and 350 °C, depending on the sample) which itself is less stable than trimesic acid (Tdec = 408 °C). This indicates that the observed increase of thermal stability is indeed due to the presence of excess, partially protonated, carboxylate ligand in the materials.
3 stoichiometric ratio. This observed excess of organic linker is in perfect agreement with the presence of free –COOH moieties. Moreover, the thermal stability of the EtOH treated SAG samples increases with the amount of present carboxylic acid sites (Fig. S4†). The thermal stability of the HKUST-1 materials was compared to starting copper acetate and trimesic acid and showed that the acetate has a lower decomposition temperature (289 °C) than HKUST-1 (between 300 and 350 °C, depending on the sample) which itself is less stable than trimesic acid (Tdec = 408 °C). This indicates that the observed increase of thermal stability is indeed due to the presence of excess, partially protonated, carboxylate ligand in the materials.
For the MeOH treated SAG samples, as well as for the single crystals, the FTIR spectra show the appearance of an absorption band at 1616 cm−1. This quite intense band does not appear in the spectra of the EtOH treated SAG samples and is of negligible intensity in the case of the LAG sample. Based on its position, this absorption band can be ascribed to a νas of carboxylate. However, as stated previously, the asymmetric stretching band of the carboxylates in typical HKUST-1 materials is located at 1649 cm−1. It has been established since a long time that the positions of the symmetric and asymmetric stretching bands of carboxylates in inorganic compounds depend on the nature of the coordination mode of the –COO− moiety.58 Thus, from the FTIR spectra, it seems that a different type of metal-to-ligand coordination is present in the MeOH treated samples.
XPS measurements were performed to further investigate the defects present within the different samples. It was observed that they all contain copper in the +I and +II oxidation state at the surface, see Fig. S5† for more details. Although CuII readily reduces into CuI during XPS measurements,59 the analysis of all the samples under strictly identical conditions allows for a reasonable comparison between the different materials. It was observed that the MeOH treated samples display a much higher CuI/CuII ratio than all other samples. This can be explained by reduction of CuII into CuI by methanol during the prolonged drying at 45 °C used for the post-synthetic treatment. Furthermore, this ratio increases with increasing milling time (Fig. S5†). From this, it is concluded that CuI, associated with a change in coordination of the carboxylate moieties, is the main type of defect present in the MeOH treated materials and that the amount of such defects increases with the milling time used during the mechanochemical synthesis. From the FTIR spectra, it is expected that the same type of defects are present in the single crystals. However, those were ground prior to XPS analysis, exposing the bulk composition, whereas the XPS spectra of all other samples are representative of the external surface of the as-obtained powders.
The presence of CuI defect sites in the MeOH treated and single crystal materials is further confirmed by the weight losses observed during their thermal decomposition (Fig. S4†), which, on the contrary to the EtOH treated samples, are lower than the expected value for Cu3BTC2. This observation means that an excess of Cu is present in the materials, which is in agreement with the existence of CuI. Furthermore, this weight loss decreases with increasing milling time and associated CuI content revealed by XPS. Interestingly, the loss observed during the decomposition of the single crystals (58.4 °C) indicate that they contain an amount of CuI that is intermediate between that of the 10 min (∼60.6 °C) and 20 min (57.5 °C) milled samples. The thermal stabilities of the MeOH treated and single crystal samples, similar to that of the MOF obtained by LAG, are lower than for the EtOH treated SAG materials. It should be noted that from TGA analysis, the as obtained single crystals have an apparent higher thermal stability (360 °C), which is due to the large size of the crystallites (∼100–400 μm, see optical microscopy characterization in the ESI†). This thermal stability is greatly lowered to 320 °C by reducing the particle size by gentle grinding in an agate mortar prior to analysis (Fig. S4†), enabling a more accurate comparison with the small sized particles resulting from the mechanochemical syntheses.
Finally, although possessing the second highest surface area of all the materials, the MOF obtained through the LAG procedure seems to be the one that possesses the least amount of structural defects. The flatness of the background of the PXRD pattern, the absence of absorption bands associated to –COOH in the FTIR spectrum or CuI defects detected by XPS, its weight loss during decomposition that is close to the expected value for Cu3BTC2 as well as its decomposition temperature are all features that support the low defect content of this MOF. Furthermore, the XPS data show that the surface composition of this sample is nicely located in between that of the two SAG sample series (Fig. S5†).
Carbon dioxide sorption properties
Carbon dioxide sorption capacities of the different materials were evaluated by using a thermogravimetric analyser. This type of measurement allows obtaining an evaluation of the gravimetric sorption by using a minimum amount of sample. The samples were activated thermally in situ at 200 °C under a helium flow before three CO2 adsorption/desorption cycles that were performed at 27 °C. Appropriate corrections were applied for each measurement (see details in the ESI†) and the obtained results are presented in Fig. 5.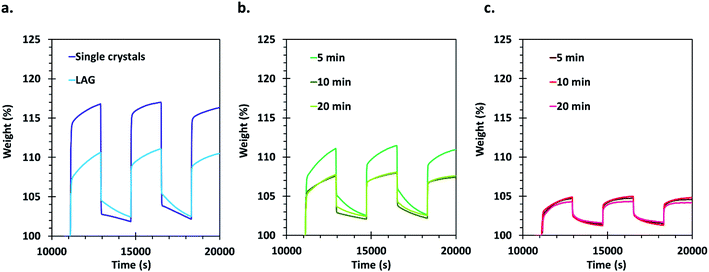 | ||
| Fig. 5 Gravimetric CO2 sorption cycles realized using TGA with (a) single crystals and LAG material, (b) SAG samples washed with methanol and dried at 45 °C and (c) SAG samples washed with ethanol and dried under vacuum. Errors on the measurements are estimated to be ±1 wt% (see ESI† for details on corrections and reproducibility). | ||
The CO2 that is initially adsorbed by the materials during the first loading is not completely released after 30 min of purging with He: about 2 to 3% weight CO2 remains adsorbed on the samples. This can be expected since the desorption kinetics is slower than the adsorption kinetics. Furthermore, the adsorption curves display two distinct regions, the first one showing a very steep uptake, likely related to the filling of a preferential CO2 sorption site (probably the desolvated copper sites). The second adsorption step is much slower and is related to occupation of less favourable adsorption sites, likely in the cavities of the MOF's pores.
The best performing material for gas sorption are the single crystals, which are able to adsorb about 17% weight of CO2. This is much higher than the values reported previously under similar conditions for HKUST-1 materials,60 and even in comparison with other porous materials measured under similar conditions (see Table 1, ESI†). Only MOFs of the MOF-74 type and MOFs functionalized with amines, which are known to exhibit very good affinity for CO2, possess higher uptake values. Surprisingly, the LAG material, having a surface area only about 7.5% smaller than the single crystals, showed an adsorption of only 10% weight of CO2. The adsorption capacity of the 5 min MeOH SAG sample is very similar to that observed for the LAG material, although its surface area is much lower. However, the 10 and 20 min MeOH samples adsorb a lower amount of CO2 whereas they possess higher surface areas.
Importantly, the presence of –COOH defects in the EtOH treated samples has a very negative effect on the CO2 sorption of the materials, allowing the sorption of only 5% weight CO2. This can be attributed to the Brønsted acidity of these MOFs, which is not favourable for the adsorption of carbon dioxide that is an acidic gas. The obtained results demonstrate that the CO2 sorption capacity of HKUST-1 is largely governed by the type and amount of defects in the MOF rather than by its surface area.
Catalytic cyclopropanation
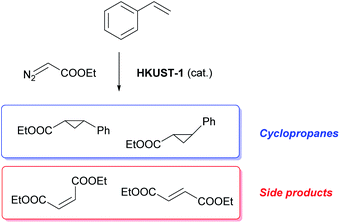
The materials were tested for their ability to catalyse the cyclopropanation reaction of styrene with ethyl diazoacetate (EDA) (Scheme 1) to evaluate the impact of the number and type of defects on the catalytic activity. The LAG sample was used as reference catalyst and kinetic follow-up by gas chromatography (GC) of the reaction in dichloromethane showed that EDA was totally converted in less than 30 minutes (Fig. S6†). The GC experiment also showed the formation of significant amounts of side products: diethyl fumarate and diethyl maleate. Further experiments were therefore run by adding the EDA dropwise over 2 hours to a solution of styrene containing the catalyst by using a syringe pump. In this way, the concentration of EDA in the reaction mixture was kept as low as possible, lowering the formation of unwanted side products. The solvent was shifted from dichloromethane to CDCl3, which has similar properties to CH2Cl2, and 1,3,5-trimethoxybenzene was added as internal standard to enable reaction follow-up by 1H-NMR. All the reactions were stopped one hour after complete addition of the EDA to the reaction mixture. The catalysts were all activated under vacuum at 150 °C prior to the catalytic tests, although this step could have been skipped as exposure to small halogenoalkanes, like CH2Cl2 and CDCl3, can achieve activation of HKUST-1 in situ.61The EDA conversion and selectivity of all the catalysts are summarized in Fig. 6, 7 and Table S2.† A blank test was run without catalyst and showed no conversion of the reactants after 3 hours. On the contrary, the LAG sample showed 100% EDA conversion. The EtOH treated SAG samples, on the one hand, showed very poor (5 min milled sample) or no conversion at all. This indicates that the presence of acidic defects in the MOF drastically inhibits the catalytic activity of HKUST-1 towards cyclopropanation of styrene with EDA. On the other hand, the methanol treated samples showed better EDA conversion, which increases with the amount of CuI defects at the surface of the sample, reaching 100% conversion for the 20 min milled sample. The conversion observed when using the single crystals as catalyst (92.6%) is comprised between that of the MeOH treated SAG samples that were obtained by milling for 10 min (15.2%) and 20 min (100%). This is in striking agreement with the previous conclusion that the single crystals possess the same type of defects as the MeOH treated samples and that the amount of those defects is comprised between that of the 10 and 20 min milled materials.
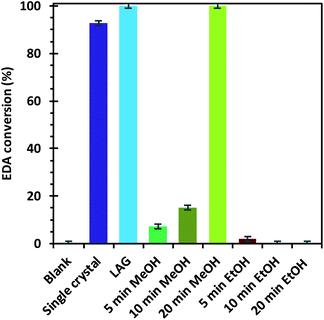 | ||
| Fig. 6 Ethyl diazoacetate conversions after the reaction with styrene in the presence of the different HKUST-1 materials as catalysts. | ||
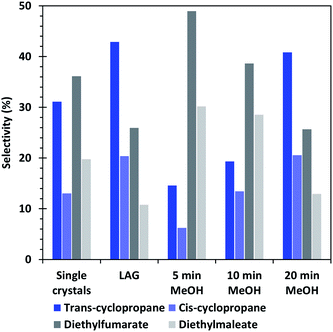 | ||
| Fig. 7 Selectivity of the cyclopropanation reaction of EDA with styrene obtained by using the different HKUST-1 materials as catalysts. | ||
Furthermore, the selectivity of the single crystal and methanol washed catalysts show that the formation of cyclopropanes is favoured when the amount of CuI defects increases, whereas a low amount of defects, such as in the 5 min MeOH sample favour the formation of dimethylfumarate and – maleate side-products. The LAG sample, which presents the least defects, shows similar conversion and selectivity than the 20 min MeOH material, which is the best performing one in its category. Interestingly, the XPS analyses (Fig. S5†) indicate that the 20 min EtOH and 5 min MeOH treated SAG samples, which are both the worst performing materials of their series, possess a surface composition quite similar to that of the material obtained by LAG, which is the best performing of all tested MOFs. On the contrary, the 5 min EtOH and 20 min MeOH materials have a surface composition largely differing from that of the LAG MOF but are both the best performing catalysts of their series. This observation shows that the course of the catalytic reaction is not governed by the surface of the MOF but rather by its bulk composition.
Overall, the outcome of the experiments show that acidic defects in the form of free –COOH functions in HKUST-1 poison the catalytic activity towards cyclopropanation. On the other hand, the activity of the MeOH treated SAG samples and the single crystals, also showing the presence of small amounts of free –COOH functions, increases with increasing CuI concentration. This indicates that CuI defects can counteract the poisoning effect of carboxylic acid. The LAG sample, which shows nearly no defects, seems to possess the best activity and conversion toward cyclopropanes, although being close to the ones obtained for the CuI rich 20 min MeOH sample in the conditions used for the experiments. In this perspective, it seems that the defectless CuII sites are the most active towards the cyclopropanation reaction.
Conclusions
We demonstrated that mechanochemical synthesis of HKUST-1 by salt-assisted grinding induces the formation of high amounts of defects in the structure of this MOF. Importantly, the type and amount of defects is dependent on the applied post-synthetic treatment and the duration of the milling. We showed that washing with water and ethanol followed by drying under vacuum at 70 °C mainly results in the presence of free –COOH non-coordinated functions in the MOF, whereas treatment with water and methanol followed by gentle heating at 45 °C for 18 h results in partial reduction of the CuII sites into CuI. We also evidenced that large (∼100–400 μm) single crystals of HKUST-1 obtained in this work also possess a large amount of similar CuI defects. Surprisingly, liquid-assisted grinding (LAG) appears to be the strategy resulting in the material with the lowest amount of structural defects. This encourages the use of LAG for making HKUST-1, as it also results in high synthetic yields. Those conclusions were drawn through thorough characterization of the materials by vibrational spectroscopy (FTIR), XPS, TGA and NH3 temperature-programmed desorption experiments. We also showed that CO2 adsorption by HKUST-1 seems to be the most efficient when using materials with low amounts of structural defects. Acidic –COOH sites in the materials result in poor adsorption of CO2 but strongly increases affinity of the materials for NH3. However, even in the presence of some CuI defects, HKUST-1 in the form of large single crystals show the highest gravimetric carbon dioxide uptake, evidencing an influence of the texture and size of the MOF particles on its performance. Finally, we showed that the presence of –COOH defect sites in HKUST-1, despite increasing the thermal stability of the material, strongly poisons the catalytic activity of this MOF towards the cyclopropanation of styrene with ethyl diazoacetate. The presence of high amounts of CuI seems to partly counteract this poisoning effect. However, the absence of carboxylic acid sites in the LAG-obtained material leads to the highest conversion as well as the best selectivity towards the desired cyclopropanes, even with low amounts of CuI, indicating that the pristine CuII sites are the most catalytically active ones.Conflicts of interest
There are no conflicts to declare.Acknowledgements
The authors acknowledge financial support through the FRIA funding of F.R.S./FNRS for T. S. We thank Dr François Devred for his help with NH3–TPD measurements, Dr Pierre Eloy for help with the XPS measurements and interpretation of the data. We also acknowledge Laurent Collard for his help with CG measurements and Jean-François Statsyns for his help with the TGA measurements.Notes and references
- S. Kazemi and V. Safarifard, Nanochem. Res., 2018, 3, 62–78 CAS
.
- K. Sumida, D. L. Rogow, J. A. Mason, T. M. McDonald, E. D. Bloch, Z. R. Herm, T. H. Bae and J. R. Long, Chem. Rev., 2012, 112, 724–781 CrossRef CAS PubMed
.
- Z. Hu, Y. Wang, B. B. Shah and D. Zhao, Adv. Sustainable Syst., 2019, 3, 1800080 CrossRef
.
- A. Uzun and S. Keskin, Prog. Surf. Sci., 2014, 89, 56–79 CrossRef CAS
.
- H. Li, K. Wang, Y. Sun, C. T. Lollar, J. Li and H. C. Zhou, Mater. Today, 2018, 21, 108–121 CrossRef CAS
.
- L. Chen and Q. Xu, Matter, 2019, 1, 57–89 CrossRef
.
- S. Sabale, J. Zheng, R. S. Vemuri, X.-Y. Yu, B. P. McGrail and R. K. Motkuri, Synth. Catal.: Open Access, 2016, 1, 1–8 Search PubMed
.
- W. G. Cui, G. Y. Zhang, T. L. Hu and X. H. Bu, Coord. Chem. Rev., 2019, 387, 79–120 CrossRef CAS
.
- M. Liu, J. Wu and H. Hou, Chem.–Eur. J., 2019, 25, 2935–2948 CAS
.
- V. R. Remya and M. Kurian, Int. Nano Lett., 2019, 9, 17–29 CrossRef CAS
.
- L. Zhu, X. Q. Liu, H. L. Jiang and L. B. Sun, Chem. Rev., 2017, 117, 8129–8176 CrossRef CAS PubMed
.
- C. Wang, B. An and W. Lin, ACS Catal., 2019, 9, 130–146 CrossRef CAS
.
- O. K. Farha, I. Eryazici, N. C. Jeong, B. G. Hauser, C. E. Wilmer, A. A. Sarjeant, R. Q. Snurr, S. T. Nguyen, A. Ö. Yazaydin and J. T. Hupp, J. Am. Chem. Soc., 2012, 134, 15016–15021 CrossRef CAS PubMed
.
- E. G. Fawaz, D. A. Salam, H. Nouali, I. Deroche, S. Rigolet, B. Lebeau and T. Jean Daou, Molecules, 2018, 23, 1–13 CrossRef PubMed
.
- Z. Yang, Y. Xia and R. Mokaya, J. Am. Chem. Soc., 2007, 129, 1673–1679 CrossRef CAS PubMed
.
- Z. Heidarinejad, M. H. Dehghani, M. Heidari, G. Javedan, I. Ali and M. Sillanpää, Environ. Chem. Lett., 2020, 18, 393–415 CrossRef CAS
.
- N. Mohamad Nor, L. C. Lau, K. T. Lee and A. R. Mohamed, J. Environ. Chem. Eng., 2013, 1, 658–666 CrossRef CAS
.
- B. Fidalgo and J. Á. Menéndez, Cuihua Xuebao, 2011, 32, 207–216 CAS
.
- A. Jain, R. Balasubramanian and M. P. Srinivasan, Chem. Eng. J., 2016, 283, 789–805 CrossRef CAS
.
- A. G. Pandolfo and A. F. Hollenkamp, J. Power Sources, 2006, 157, 11–27 CrossRef CAS
.
- L. J. Konwar, J. Boro and D. Deka, Renewable Sustainable Energy Rev., 2014, 29, 546–564 CrossRef CAS
.
- M. Ahmad, A. U. Rajapaksha, J. E. Lim, M. Zhang, N. Bolan, D. Mohan, M. Vithanage, S. S. Lee and Y. S. Ok, Chemosphere, 2014, 99, 19–33 CrossRef CAS PubMed
.
- M. Inagaki, F. Kang, M. Toyoda and H. Konno, Advanced Materials Science and Engineering of Carbon, Elsevier, 1st edn, 2013 Search PubMed
.
- H. Marsh and F. R. Reinoso, Activated Carbon, Elsevier, 1st edn, 2006 Search PubMed
.
- M. Dincǎ and J. R. Long, Angew. Chem., Int. Ed., 2008, 47, 6766–6779 CrossRef PubMed
.
- J. Liu, L. Chen, H. Cui, J. Zhang, L. Zhang and C. Y. Su, Chem. Soc. Rev., 2014, 43, 6011–6061 RSC
.
- L. Chen, C. A. Morrison and T. Düren, J. Phys. Chem. C, 2012, 116, 18899–18909 CrossRef CAS
.
- J. Canivet, M. Vandichel and D. Farrusseng, Dalton Trans., 2016, 45, 4090–4099 RSC
.
- S. Dissegna, K. Epp, W. R. Heinz, G. Kieslich and R. A. Fischer, Adv. Mater., 2018, 30, 1–23 Search PubMed
.
- Z. Fang, B. Bueken, D. E. De Vos and R. A. Fischer, Angew. Chem., Int. Ed., 2015, 54, 7234–7254 CrossRef CAS PubMed
.
- D. S. Sholl and R. P. Lively, J. Phys. Chem. Lett., 2015, 6, 3437–3444 CrossRef CAS PubMed
.
- A. K. Cheetham, T. D. Bennett, F. X. Coudert and A. L. Goodwin, Dalton Trans., 2016, 45, 4113–4126 RSC
.
- A. Dhakshinamoorthy, Z. Li and H. Garcia, Chem. Soc. Rev., 2018, 47, 8134–8172 RSC
.
- D. Yang and B. C. Gates, ACS Catal., 2019, 9, 1779–1798 CrossRef CAS
.
- P. Iacomi, F. Formalik, J. Marreiros, J. Shang, J. Rogacka, A. Mohmeyer, P. Behrens, R. Ameloot, B. Kuchta and P. L. Llewellyn, Chem. Mater., 2019, 31, 8413–8423 CrossRef CAS
.
- S. Chong, G. Thiele and J. Kim, Nat. Commun., 2017, 8, 1539 CrossRef PubMed
.
- L. M. Rodríguez-Albelo, E. López-Maya, S. Hamad, A. R. Ruiz-Salvador, S. Calero and J. A. R. Navarro, Nat. Commun., 2017, 8, 14457 CrossRef PubMed
.
- X. Zhang, Y. Yang, L. Song, J. Chen, Y. Yang and Y. Wang, J. Hazard. Mater., 2019, 365, 597–605 CrossRef CAS PubMed
.
- S. S. Chui, S. M. Lo, J. P. H. Charmant, A. G. Orpen and I. D. Williams, Science, 1999, 283, 1148–1151 CrossRef CAS PubMed
.
- C. H. Hendon and A. Walsh, Chem. Sci., 2015, 6, 3674 RSC
.
- M. Todaro, G. Buscarino, L. Sciortino, A. Alessi, F. Messina, M. Taddei, M. Ranocchiari, M. Cannas and F. M. Gelardi, J. Phys. Chem. C, 2016, 120, 12879–12889 CrossRef CAS
.
- W. Zhang, M. Kauer, P. Guo, S. Kunze, S. Cwik, M. Muhler, Y. Wang, K. Epp, G. Kieslich and R. A. Fischer, Eur. J. Inorg. Chem., 2017, 2017, 925–931 CrossRef CAS
.
- M. Shöâeè, J. R. Agger, M. W. Anderson and M. P. Attfield, CrystEngComm, 2008, 10, 646–648 RSC
.
- R. Ameloot, F. Vermoortele, J. Hofkens, F. C. De Schryver, D. E. De Vos and M. B. J. Roeffaers, Angew. Chem., Int. Ed., 2013, 52, 401–405 CrossRef CAS PubMed
.
- G. Majano, O. Martin, M. Hammes, S. Smeets, C. Baerlocher and J. Pérez-Ramírez, Adv. Funct. Mater., 2014, 24, 3855–3865 CrossRef CAS
.
- K. Müller, N. Vankova, L. Schöttner, T. Heine and L. Heinke, Chem. Sci., 2019, 10, 153–160 RSC
.
- T. Wang, H. Zhu, Q. Zeng and D. Liu, Adv. Mater. Interfaces, 2019, 6, 1–27 Search PubMed
.
- T. Stolar, L. Batzdorf, S. Lukin, D. Žilić, C. Motillo, T. Friščić, F. Emmerling, I. Halasz and K. Užarević, Inorg. Chem., 2017, 56, 6599–6608 CrossRef CAS PubMed
.
- J. Yang, X. Feng, G. Lu, Y. Li, C. Mao, Z. Wen and W. Yuan, Dalton Trans., 2018, 47, 5065–5071 RSC
.
- M. Klimakow, P. Klobes, A. F. Thünemann, K. Rademann and F. Emmerling, Chem. Mater., 2010, 22, 5216–5221 CrossRef CAS
.
- A. Corma, M. Iglesias, F. X. Llabrés i Xamena and F. Sánchez, Chem.–Eur. J., 2010, 16, 9789–9795 CrossRef CAS PubMed
.
- H. V. Doan, A. Sartbaeva, J. C. Eloi, S. A. Davis and V. P. Ting, Sci. Rep., 2019, 9, 1–9 CrossRef CAS PubMed
.
- M. Thommes, K. Kaneko, A. V. Neimark, J. P. Olivier, F. Rodriguez-Reinoso, J. Rouquerol and K. S. W. Sing, Pure Appl. Chem., 2015, 87, 1051–1069 CAS
.
- S. Loera-Serna, L. L. Núñez, J. Flores, R. López-Simeon and H. I. Beltrán, RSC Adv., 2013, 3, 10962–10972 RSC
.
- J. B. DeCoste, G. W. Peterson, B. J. Schindler, K. L. Killops, M. A. Broweb and J. J. Mahle, J. Mater. Chem. A, 2013, 1, 11922–11932 RSC
.
- T. Toyao, K. Liang, K. Okada, R. Ricco, M. J. Styles, Y. Tokudome, Y. Horiuchi, A. J. Hill, M. Takahashi, M. Matsuoka and P. Falcaro, Inorg. Chem. Front., 2015, 2, 434–441 RSC
.
- Y. K. Seo, G. Hundal, I. T. Jang, Y. K. Hwang, C. H. Jun and J. S. Chang, Microporous Mesoporous Mater., 2009, 119, 331–337 CrossRef CAS
.
- G. B. Deacon and R. J. Phillips, Coord. Chem. Rev., 1980, 33, 227–250 CrossRef CAS
.
- Y. Liu, P. Bailey, T. C. Q. Noakes, G. E. Thompson, P. Skeleton and M. R. Alexander, Surf. Interface Anal., 2004, 36, 339–346 CrossRef CAS
.
- Y. Chen, X. Mu, E. Lester and T. Wu, Prog. Nat. Sci.: Mater. Int., 2018, 28, 584–589 CrossRef CAS
.
- H. K. Kim, W. S. Yun, M. Kim, J. Y. Kim, Y. Bae and J. Lee, J. Am. Chem. Soc., 2015, 137, 10009–10015 CrossRef CAS PubMed
.
Footnote |
| † Electronic supplementary information (ESI) available. See DOI: 10.1039/c9ra10412g |
| This journal is © The Royal Society of Chemistry 2020 |

