 Open Access Article
An acrylate AIE-active dye with a two-photon fluorescent switch for fluorescent nanoparticles by RAFT polymerization: synthesis, molecular structure and application in cell imaging†
Zengfang Huang *ab,
Yali Chenab,
Runze Wangab,
Chaoyue Zhouab,
Xiaobo Liub,
Liucheng Maoc,
Jinying Yuan
 c,
Lei Tao
 c and
Yen Wei*c
aSchool of Materials & Food Engineering, Zhongshan Institute, University of Electronic Science & Technology of China, Zhongshan, 528402, P. R. China. E-mail: hzf105@163.com
bSchool of Materials and Energy, University of Electronic Science & Technology of China, Chengdu, 610054, P. R. China
cDepartment of Chemistry, The Tsinghua Center for Frontier Polymer Research, Tsinghua University, Beijing 100084, P. R. China. E-mail: weiyen@tsinghua.edu.cn
First published on 4th February 2020
Abstract
Recently, AIE-active fluorescent materials have attracted extensive investigation due to their significant applications in the fields of memory devices, photomodulation, information displays, sensors, and biological imaging. In this contribution, a novel acrylate AIE-active dye of TPMA was successfully synthesized by Suzuki coupling and acylation reaction, and belongs to the monoclinic crystal system and P21/c space group from the crystal structure analysis, and its fluorescence intensity was stronger with an obvious red shift of emission wavelength as compared with the reported TPB dye. Moreover, the obtained TPMA dye exhibits multi-stimuli-responsivity and a two-photon fluorescent switch with excellent reversibility in the solid state. Subsequently, the corresponding fluorescent polymers of PEG-TM were successfully fabricated via RAFT polymerization of TPMA and PEGMA with a molecular weight of about 25![[thin space (1/6-em)]](https://www.rsc.org/images/entities/char_2009.gif) 000 (Mn) and narrow polydispersity index (PDI). From 1H NMR analysis, when the feeding ratio of TPMA increased to 32.2% from 19.2%, the molar fraction of TPMA in PEG-TM polymers accordingly increased to 32.8% from 19.5%. In water solution, the as-prepared PEG-TM1 polymers would self-assemble into fluorescent organic nanoparticles (FONs) with diameters ranging from 150 to 250 nm, and their maximum emission wavelength presented at 518 nm with obvious AIE phenomena. Moreover, the as-synthesized PEG-TM polymers have prospective application in biological imaging due to their good fluorescence, high water solubility and excellent biocompatibility.
000 (Mn) and narrow polydispersity index (PDI). From 1H NMR analysis, when the feeding ratio of TPMA increased to 32.2% from 19.2%, the molar fraction of TPMA in PEG-TM polymers accordingly increased to 32.8% from 19.5%. In water solution, the as-prepared PEG-TM1 polymers would self-assemble into fluorescent organic nanoparticles (FONs) with diameters ranging from 150 to 250 nm, and their maximum emission wavelength presented at 518 nm with obvious AIE phenomena. Moreover, the as-synthesized PEG-TM polymers have prospective application in biological imaging due to their good fluorescence, high water solubility and excellent biocompatibility.
1. Introduction
With ever-changing technology, a wide variety of fluorescent materials with different functions have gradually penetrated various fields, such as optical electronic devices, photochemical sensors, medical diagnostics, bioimaging, fluorescent dyes, etc. Among them, organic fluorescent materials have designable and variable structures with excellent optical performance, which has attracted the extensive attention of a large number of researchers.1–3 In 2001, the wonderful phenomenon of aggregation-induced emission (AIE) was discovered by Tang's group, which has attracted the extensive interest of many researchers.4 The AIE phenomenon refers to the fact that some molecules do not emit fluorescence or emit very weak fluorescence in good solvents, but emit fluorescence or stronger fluorescence in the aggregated state, which is completely contrary to the aggregation-caused quenching (ACQ) phenomenon of traditional organic fluorescent materials in an aggregated state. The discovery of the AIE phenomenon largely solved the limitation of practical application of fluorescent materials caused by the ACQ effect, which was greatly significant for the design, synthesis and application of fluorescent materials. Since then, more and more AIE active materials with different characteristics have been designed and synthesized,5–9 among which tetraphenylethene (TPE) derivatives are typical with a propeller-like structure and four free-rotating benzene rings on the periphery. Recently, they have been extensively explored by researchers for their convenient synthesis, easy modification of functional groups and excellent fluorescence properties and achieved many important applications in the fields of ion detection, pH detection, explosive detection, bioimaging, biomolecule detection, drug release, organic light-emitting diodes and so on.10–18 A novel TPE derivative TPENOEt with reversible photochromic property was synthesized via Schiff base reaction, which could be used as an excellent rewritable paper due to many advantages such as convenient synthesis, low cost, fast response and good anti-fatigue performance.19 A kind of polythiourea with AIE characteristic has been prepared for the selective detection of Hg2+ with high sensitivity.20 Another novel AIE fluorescence probe was synthesized by click reaction. In the presence of carboxypeptidase Y, it could easily detect casein kinase with good selectivity and high sensitivity.21 Most of the reported “turn-on” fluorescent materials are pre-quenched before test by adding organic solvents or heavy metal ions. Recently, a novel “turn-on” fluorescent material TPE–HPA was prepared by introducing TPE into the internal linear units of the hyperbranched poly(amido-amine) (HPA), which could directly and selectively detect pyrophosphate (PPi) anions under biological conditions without organic solvents or heavy metal ions.22As one of the effective polymerization methods, reversible addition-fragmentation chain transfer (RAFT) polymerization has developed into the most famous and widely used technology in synthesis chemistry and polymer chemistry due to its simple operation, mild reaction conditions, many applicable solvent and wide range of monomers.23–25 The obtained polymers by RAFT polymerization have the characteristics of controlled molecular weight, narrow molecular weight distribution and precise structure. Therefore, RAFT polymerization is considered to be an important and effective way to prepare multifunctional copolymers, which is widely used in materials science, biology, electronics, etc.26–32 For example, amphiphilic block copolymer p(HEMA-b-Azo-IEM) was successfully prepared by RAFT polymerization, in water solution, which self-assembled into micelles, and its size and shape changed with the different light irradiation (visible/UV light).33 Phenylboronic acid derivatives have been widely used in the synthesis of glucose-sensitive materials in the field of biomedicine due to their specific interaction with biological molecules such as glucose and glycoproteins. Nanogels p(AAPBA-AGA-BODIPYMA) were synthesized by RAFT polymerization, the fluorescence intensity and size of which were sensitive to glucose. Meanwhile, the nanogels had good compatibility, and could encapsulate and release insulin, indicating that the nanogels had the potential to detect glucose and treat diabetes.34 A cross-linked copolymer (PEG-co-FHMA) was constructed by RAFT polymerization with hydrazine hydrate as cross-linking agent. The as-prepared copolymer had excellent AIE property, good fluorescence, low critical micelle concentration and good biocompatibility, which make it a powerful candidate for bioimaging.35
Stimuli-responsive fluorescence switching by molecular assemblies transformation with external stimuli is attracting considerable interest due to its significant applications in memory devices, photomodulation, information displays, and sensors. Due to the excellent fluorescence and easy modification of TPE together with mild reaction conditions and many suitable monomers of RAFT polymerization, in this study, we try our best to fabricate novel TPE polymers with AIE-activity by RAFT polymerization. Firstly, a novel methacrylate functionalized-TPE TPMA dye was synthesized with multi-stimuli-responsivity and two-photon fluorescent switch with excellent reversibility in the solid state, which was very favorable for cells imaging due to the strong fluorescence intensity and obvious red shift of emission wavelength as compared with the reported TPB dye. Subsequently, the corresponding polymers PEG-TM were successfully synthesized via RAFT polymerization combining the hydrophilic monomer PEGMA with the various feeding ratio of TPMA. The amphiphilic PEG-TM polymers would self-assemble into FONs in water, which exhibited the prospective application in bioimaging due to the good fluorescence performance, high water solubility and excellent biocompatibility.
2. Experimental
2.1. Materials and characterization
Bromotriphenylethylene (Aladdin, 98%), 4-formylphenylboronic acid (Aladdin, 97%), tetrakis(triphenylphosphine)palladium(0) (Aladdin, Pd ≥ 8.9%), potassium carbonate, tetrabutylammonium bromide (TBAB) (Aladdin, 99%), 4-methoxyphenylacetonitrile (Aladdin, 98%), tetrabutylammonium hydroxide (Aladdin, ∼25% in methanol, ∼0.8 M), boron tribromide (Aladdin, 1.0 M in methylene chloride), sodium bicarbonate, methacryloyl chloride (Aladdin, 95%), triethylamine and azodiisobutyronitrile (AIBN, Aladdin, 99%) were purchased through commercial channels and used directly. Poly(ethylene glycol)monomethacrylate (PEGMA, Aladdin, Mn = 475, AR) was chromatographed on an alkaline alumina gel column before using. All organic solvents in the experiments were analytical pure and used directly after purchase. Chain transfer agent (CTA) 4-cyano-4-(ethylthiocarbonothioylthio)pentanoic acid and 4-(1,2,2-triphenylvinyl)benzaldehyde (TPB) were prepared according to the previously reported methods.36–38The average molecular weight (Mn) and polydispersity index (PDI) of the polymer PEG-TM were analyzed by a Waters 1515 gel permeation chromatography (GPC) system with a refractive index detector taking tetrahydrofuran (THF) as the eluent. The 1H NMR spectra of TPEOM, TPEOH, fluorescent monomer TPMA and fluorescent polymers PEG-TM was characterized by a JEOL JNM-ECA 400 (400 mHz) spectrometer with tetramethylsilane (TMS) as a reference. Transmission electron microscopy (TEM) images were measured on a JEM-1200EX high resolution electron microscope at a working voltage of 100 kV, in which the PEG-TM suspension were previously dropped onto carbon-coated copper grids and then naturally dried. FT-IR spectral data was measured on a PerkinElmer Spectrum 100 spectrometer (Waltham, MA, USA), in which the KBr method and the reflection mode were respectively adopted depending on the status of the sample. UV-Vis absorption spectrum was measured on a PerkinElmer LAMBDA 35 UV/Vis spectroscopy system. The fluorescence emission and excitation spectra were measured on a PE LS-55 spectrometer. Single crystal X-ray diffraction data of the TPMA dye were measured on a Bruker Smart CCD diffractometer and its structure was solved by Patterson methods followed by different Fourier syntheses and then refined by full-matrix least squares techniques against F2 with SHELXTL.39
2.2. Preparation of TPEOM
TPB (0.901 g, 2.50 mmol), 4-methoxyphenylacetonitrile (0.405 g, 2.75 mmol), 5–6 drops of tetrabutylammonium hydroxide were added to a Schlenk tube with a magnetic stir bar and ethanol (30.0 mL) as solvent, which was magnetically stirred at room temperature for 0.5 h until the mixture was completely dissolved. Then the above Schlenk tube was put into an oil bath at 78 °C and magnetically stirred for an additional 3 hours. After the reaction, the mixture was naturally cooled to room temperature and the product was precipitated out, which was washed with ethanol and filtered for several times. The pure product was obtained by drying under vacuum, which was named as TPEOM (0.808 g, 66% yield). 1H NMR (400 MHz, CDCl3, δ): 3.84 (s, 3H; –CH3), 6.93–6.95 (J = 8.0 Hz, d, 2H; Ar H), 7.01–7.06 (J = 20.0 Hz, m, 6H; Ar H), 7.09–7.14 (J = 20.0 Hz, m, 11H; Ar H), 7.29 (s, 1H; CH), 7.55–7.57 (J = 8.0 Hz, d, 2H; Ar H), 7.61–7.63 (J = 8.0 Hz, d, 2H; Ar H).2.3. Preparation of TPEOH
TPEOM (0.808 g, 1.65 mmol) and anhydrous dichloromethane (20.0 mL) were put into a sealed Schlenk tube with a magnetic stir bar. The mixture in Schlenk tube was placed into liquid nitrogen, followed by deoxygenation for five times through a vacuum-nitrogen cycle. Then boron tribromide (4.95 mL, 4.95 mmol) was injected into a pressure equalizing funnel and slowly dripped into the Schlenk tube under freezing condition for about 1 h with magnetic stirring. After the addition was completed, the mixture was magnetically stirred for 20 h at room temperature. Subsequently, the reaction mixture was neutralized with saturated sodium bicarbonate solution and extracted with dichloromethane for three times. The organic layer was dried over anhydrous magnesium sulfate and filtered. The organic solvent was quickly removed by a rotary evaporator under reduced pressure. Finally, the product was chromatographed on a silica gel column using n-hexane/dichloromethane (v/v = 2![[thin space (1/6-em)]](https://www.rsc.org/images/entities/char_2009.gif) :
:![[thin space (1/6-em)]](https://www.rsc.org/images/entities/char_2009.gif) 1) as mobile phase, which was further dried under vacuum and named as TPEOH (0.532 g, 68% yield). 1H NMR (400 MHz, CDCl3, δ): 4.91 (s, 1H; –OH), 6.73–6.75 (J = 8.0 Hz, d, 2H; Ar H), 6.89–7.94 (J = 20.0 Hz, m, 6H; Ar H), 7.06–7.11 (J = 20.0 Hz, m, 11H; Ar H), 7.31 (s, 1H; CH), 7.53–7.55 (J = 8.0 Hz, d, 2H; Ar H), 7.63–7.65 (J = 8.0 Hz, d, 2H; Ar H).
1) as mobile phase, which was further dried under vacuum and named as TPEOH (0.532 g, 68% yield). 1H NMR (400 MHz, CDCl3, δ): 4.91 (s, 1H; –OH), 6.73–6.75 (J = 8.0 Hz, d, 2H; Ar H), 6.89–7.94 (J = 20.0 Hz, m, 6H; Ar H), 7.06–7.11 (J = 20.0 Hz, m, 11H; Ar H), 7.31 (s, 1H; CH), 7.53–7.55 (J = 8.0 Hz, d, 2H; Ar H), 7.63–7.65 (J = 8.0 Hz, d, 2H; Ar H).
2.4. Preparation of TPMA
TPEOH (0.799 g, 1.68 mmol) and triethylamine (0.322 g, 3.19 mmol) were put into a sealed Schlenk tube with a magnetic stir bar and dichloromethane (10.0 mL) as solvent. The Schlenk tube was placed in liquid nitrogen, followed by deoxygenation for five times through a vacuum-nitrogen cycle. Methacryloyl chloride (0.250 g, 2.4 mmol) was dissolved in dichloromethane (5.00 mL), which was injected into a pressure equalizing funnel and slowly dripped into the Schlenk tube under freezing condition for about 1.5 h with magnetic stirring. After the addition was completed, the mixture was magnetically stirred for 24 h at room temperature. The organic solvent was quickly removed by a rotary evaporator under reduced pressure. Finally, the product was chromatographed on a silica gel column using dichloromethane/methanol (v/v = 100![[thin space (1/6-em)]](https://www.rsc.org/images/entities/char_2009.gif) :
:![[thin space (1/6-em)]](https://www.rsc.org/images/entities/char_2009.gif) 0.5) as mobile phase, which was dried under vacuum and named as TPMA (0.684 g, 75% yield). 1H NMR (400 MHz, CDCl3, δ): 1.96 (s, 3H; –CH3), 5.56 (s, 1H; CH), 6.11 (s, 1H; CH), 6.93–6.95 (J = 8.0 Hz, d, 2H; Ar H), 7.05–7.09 (J = 16.0 Hz, m, 6H; Ar H), 7.11–7.16 (J = 20.0 Hz, m, 11H; Ar H), 7.31 (s, 1H; CH), 7.56–7.58 (J = 8.0 Hz, d, 2H; Ar H), 7.64–7.66 (J = 8.0 Hz, d, 2H; Ar H).
0.5) as mobile phase, which was dried under vacuum and named as TPMA (0.684 g, 75% yield). 1H NMR (400 MHz, CDCl3, δ): 1.96 (s, 3H; –CH3), 5.56 (s, 1H; CH), 6.11 (s, 1H; CH), 6.93–6.95 (J = 8.0 Hz, d, 2H; Ar H), 7.05–7.09 (J = 16.0 Hz, m, 6H; Ar H), 7.11–7.16 (J = 20.0 Hz, m, 11H; Ar H), 7.31 (s, 1H; CH), 7.56–7.58 (J = 8.0 Hz, d, 2H; Ar H), 7.64–7.66 (J = 8.0 Hz, d, 2H; Ar H).
2.5. Preparation of fluorescent polymers PEG-TM
TPMA (94.9 mg, 0.180 mmol), PEGMA (360 mg, 0.758 mmol), AIBN (1.70 mg, 0.0104 mmol), CTA (4.00 mg, 0.0152 mmol) and toluene (2.50 mL) were put into a sealed Schlenk tube with a magnetic stir bar. The Schlenk tube was placed in liquid nitrogen, followed by deoxygenation for five times through a vacuum-nitrogen cycle. Then, the Schlenk tube was put into an oil bath at 70 °C and magnetically stirred for 36 h. Subsequently the mixture was dialyzed three times with acetone for 12 hours each time. The organic solvent was quickly removed by a rotary evaporator under reduced pressure. The polymers were precipitated three times from tetrahydrofuran into petroleum ether. Finally, the polymers were obtained by drying under vacuum and named as PEG-TM1. The polymer PEG-TM2 was also prepared by the above method, in which the molar ratio of TPMA changed to 32.2%.3. Results and discussion
3.1. Synthesis and characterization of PEG-TM FONs
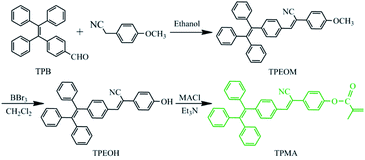
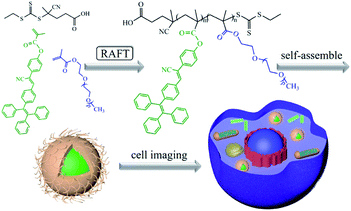
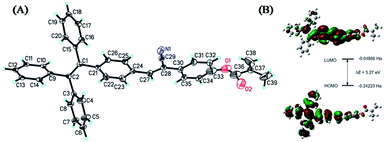
The synthetic route of the TPMA monomer is shown in Scheme 1. The process included three main reactions: firstly, the TPB was condensed with 4-methoxyphenylacetonitrile to obtain the compound TPEOM; secondly, boron tribromide guided the demethylation reaction to obtain the compound TPEOH by converting the methoxy group of TPEOM to a hydroxyl group; finally, TPEOH was subjected to acylation reaction with methacryloyl chloride to obtain the fluorescent monomer TPMA. Subsequently, the polymers PEG-TM were fabricated by RAFT polymerization with TPMA and hydrophilic monomer PEGMA as raw materials. The product was purified by successive dialysis in acetone, and then precipitation from THF to petroleum ether. The hydrophobic TPMA segments and the hydrophilic PEGMA segments would endow the amphiphilicity of the polymers PEG-TM. Thus, polymers PEG-TM would tend to self-assemble into nanoparticles in water and could be internalized by cells, as shown in Scheme 2.The ORTEP diagram of complex TPMA dye is presented in Fig. 1(A), which belongs to monoclinic crystal system and P21/c space group. a = 29.6191(12) Å, b = 5.7006(2) Å, c = 17.6543(6) Å, α = 90°, β = 100.620(4) °, γ = 90°, V = 2929.81(19) Å3, Z = 4, R1 = 0.0702, wR2 = 0.1357. The dihedral angle between the benzene rings of C3–C4–C5–C6–C7–C8 and C9–C10–C11–C12–C13–C14 is about 87.460°, and the dihedral angle between the benzene rings of C15–C16–C17–C18–C19–C20 and C21–C22–C23–C24–C25–C26 is about 89.551°, indicating the angulation structure of the phenyl rings owing to the steric effect of TPE segment. Otherwise, the dihedral angle between the benzene rings of C21–C22–C23–C24–C25–C26 and C30–C31–C32–C33–C34–C35 is about 8.934°, and they are almost in the same plane, which endows TPMA dye the good conjugative effect. The bond length of C(27)–C(28) was between the C–C single bond and C![[double bond, length as m-dash]](https://www.rsc.org/images/entities/char_e001.gif) C double bond length due to its conjugation with phenyl rings of C21–C22–C23–C24–C25–C26 and C30–C31–C32–C33–C34–C35. From the bond length analysis, the bonds of O(1)–C(33) and O(2)–C(36) were respectively single bond and double bond, indicating the successful demethylation reaction of –OCH3 and acylation reaction of –OH. Fig. 1(B) showed the calculated HOMO and LUMO spatial distributions and optimized structure in the ground states of TPMA dye by the Gaussian 09 program which was carried out at the B3LYP/6-31G* level. The electrons of TPMA at HOMO were mainly located at the tetraphenylethene segment, while most of the electrons transferred to the diphenyl rings with cyano group at the LUMO, and the calculated transition energy ΔE of HOMO and LUMO was about 5.27 eV.
C double bond length due to its conjugation with phenyl rings of C21–C22–C23–C24–C25–C26 and C30–C31–C32–C33–C34–C35. From the bond length analysis, the bonds of O(1)–C(33) and O(2)–C(36) were respectively single bond and double bond, indicating the successful demethylation reaction of –OCH3 and acylation reaction of –OH. Fig. 1(B) showed the calculated HOMO and LUMO spatial distributions and optimized structure in the ground states of TPMA dye by the Gaussian 09 program which was carried out at the B3LYP/6-31G* level. The electrons of TPMA at HOMO were mainly located at the tetraphenylethene segment, while most of the electrons transferred to the diphenyl rings with cyano group at the LUMO, and the calculated transition energy ΔE of HOMO and LUMO was about 5.27 eV.
The synthesized PEG-TM1 polymers had an average molecular weight (Mn) of about 25![[thin space (1/6-em)]](https://www.rsc.org/images/entities/char_2009.gif) 000 g mol−1 and its polydispersity index (PDI) is about 1.30, as shown in Fig. 2(A), and the Mn of PEG-TM2 polymers was about 27
000 g mol−1 and its polydispersity index (PDI) is about 1.30, as shown in Fig. 2(A), and the Mn of PEG-TM2 polymers was about 27![[thin space (1/6-em)]](https://www.rsc.org/images/entities/char_2009.gif) 000 g mol−1. The similar Mn of them should originate from two factors, one hand, the higher Mn of TPMA should increase the Mn of PEG-TM2 polymers as compared with PEGMA; on the other hand, the steric effect of TPMA possibly affect the chain propagation rate to a certain degree. The 1H NMR spectra of TPEOM, TPEOH, TPMA and fluorescent polymers PEG-TM were shown in Fig. 2(B). From the 1H NMR spectrum of TPEOM, a single peak at 3.84 ppm could be clearly observed, which belonged to the characteristic proton peak of –CH3, indicating that the 4-methoxyphenylacetonitrile was introduced into the molecular structure by the expected condensation reaction. By comparing and analyzing the TPEOH spectrum with the TPEOM spectrum, the characteristic proton peak of –OH appeared at 4.91 ppm in the spectrum of TPEOH, while the single peak of 3.84 ppm completely disappeared, which indicated that the methoxy group of TPEOM was completely reacted out and successfully converted to a hydroxyl group by demethylation reaction. For the fluorescent monomer TPMA, the two characteristic proton peak of –C
000 g mol−1. The similar Mn of them should originate from two factors, one hand, the higher Mn of TPMA should increase the Mn of PEG-TM2 polymers as compared with PEGMA; on the other hand, the steric effect of TPMA possibly affect the chain propagation rate to a certain degree. The 1H NMR spectra of TPEOM, TPEOH, TPMA and fluorescent polymers PEG-TM were shown in Fig. 2(B). From the 1H NMR spectrum of TPEOM, a single peak at 3.84 ppm could be clearly observed, which belonged to the characteristic proton peak of –CH3, indicating that the 4-methoxyphenylacetonitrile was introduced into the molecular structure by the expected condensation reaction. By comparing and analyzing the TPEOH spectrum with the TPEOM spectrum, the characteristic proton peak of –OH appeared at 4.91 ppm in the spectrum of TPEOH, while the single peak of 3.84 ppm completely disappeared, which indicated that the methoxy group of TPEOM was completely reacted out and successfully converted to a hydroxyl group by demethylation reaction. For the fluorescent monomer TPMA, the two characteristic proton peak of –C![[double bond, length as m-dash]](https://www.rsc.org/images/entities/char_e001.gif) CH2 appeared at 5.56 ppm and 6.11 ppm, indicating the desirable introduction of methacryloyl group by acylation reaction of –OH and methacryloyl chloride. According to the analysis of the spectra of the polymers PEG-TM1 and PEG-TM2, after the RAFT polymerization, the characteristic proton peak of –C
CH2 appeared at 5.56 ppm and 6.11 ppm, indicating the desirable introduction of methacryloyl group by acylation reaction of –OH and methacryloyl chloride. According to the analysis of the spectra of the polymers PEG-TM1 and PEG-TM2, after the RAFT polymerization, the characteristic proton peak of –C![[double bond, length as m-dash]](https://www.rsc.org/images/entities/char_e001.gif) CH2 in the monomer of TPMA was completely disappeared. Moreover, the aromatic ring peaks of TPMA obviously appeared at 7.04–7.68 ppm. Another characteristic peaks located at 4.08 ppm could be assigned to the ester groups of poly-(PEG). Combining the analysis results of the above 1H NMR spectra, it can be concluded that all reactions proceed as expected as shown in the schematic diagram, and the desired fluorescent monomer TPMA and fluorescent polymers are obtained. It is generally known that the peak area of 1H NMR spectra is directly proportional to the corresponding number of characteristic hydrogens. Therefore, the actual molar ratio of TPMA in PEG-TM polymers was further analyzed by calculating the integral ratio of the characteristic peaks of 7.04–7.68 ppm and 4.08 ppm. The results showed that the molar ratio of TPMA increased to 32.8% in PEG-TM2 from 19.5% in PEG-TM1 while the feeding molar fraction of TPMA increased to 32.2% from 19.2%.
CH2 in the monomer of TPMA was completely disappeared. Moreover, the aromatic ring peaks of TPMA obviously appeared at 7.04–7.68 ppm. Another characteristic peaks located at 4.08 ppm could be assigned to the ester groups of poly-(PEG). Combining the analysis results of the above 1H NMR spectra, it can be concluded that all reactions proceed as expected as shown in the schematic diagram, and the desired fluorescent monomer TPMA and fluorescent polymers are obtained. It is generally known that the peak area of 1H NMR spectra is directly proportional to the corresponding number of characteristic hydrogens. Therefore, the actual molar ratio of TPMA in PEG-TM polymers was further analyzed by calculating the integral ratio of the characteristic peaks of 7.04–7.68 ppm and 4.08 ppm. The results showed that the molar ratio of TPMA increased to 32.8% in PEG-TM2 from 19.5% in PEG-TM1 while the feeding molar fraction of TPMA increased to 32.2% from 19.2%.
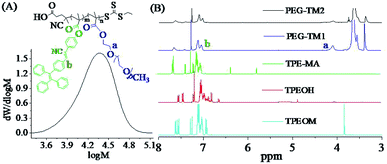 | ||
Fig. 2 (A) The GPC trace of PEG-TM1 (THF) (Mn = 25![[thin space (1/6-em)]](https://www.rsc.org/images/entities/char_2009.gif) 000, PDI = 1.30); (B) 1H NMR spectra (CDCl3) of TPEOM, TPEOH, fluorescent monomer TPMA and fluorescent polymers PEG-TM. 000, PDI = 1.30); (B) 1H NMR spectra (CDCl3) of TPEOM, TPEOH, fluorescent monomer TPMA and fluorescent polymers PEG-TM. | ||
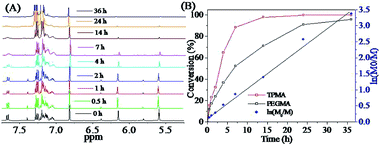
Fig. 3 showed the results of further studies on the RAFT polymerization kinetics of TPMA and PEGMA. According to the analysis of the 1H NMR spectra of Fig. 3(A), the peaks at 5.60 ppm and 6.15 ppm were attributed to the –C![[double bond, length as m-dash]](https://www.rsc.org/images/entities/char_e001.gif) CH2 proton peaks of PEGMA, and the peaks at 5.81 ppm and 6.39 ppm were attributed to the –C
CH2 proton peaks of PEGMA, and the peaks at 5.81 ppm and 6.39 ppm were attributed to the –C![[double bond, length as m-dash]](https://www.rsc.org/images/entities/char_e001.gif) CH2 proton peaks of TPMA. The conversion of PEGMA and TPMA can be calculated from the intensity change of –C
CH2 proton peaks of TPMA. The conversion of PEGMA and TPMA can be calculated from the intensity change of –C![[double bond, length as m-dash]](https://www.rsc.org/images/entities/char_e001.gif) CH2 with a characteristic peak at 6.80 ppm of trimethylbenzene as the internal standard. From the Fig. 3(A), the intensity of the peaks at 6.15 ppm and 6.39 ppm gradually decreased as the reaction progressed, which meant that PEGMA and TPMA had been gradually consumed by the RAFT polymerization to successfully construct the PEG-TM polymers. After 36 hours of polymerization, two monomers reached high conversion rates. The kinetic study showed a linear pseudo-first-order kinetic curve as a function of time, as shown in Fig. 3(B). In the early stage of polymerization, the conversion of TPMA was significantly higher than that of PEGMA, so the molar fraction of TPMA in the polymers gradually increased. With the progress of polymerization, the conversion of TPMA almost remained unchanged and the conversion of PEGMA gradually increased, which would result in a gradual decrease in the molar fraction of TPMA in the polymers and a gradual increase in the molar fraction of PEGMA because the concentration of TPMA in the reaction mixture was less and less as compared with that of PEGMA, in other words, the obtained PEG-TM polymers were nearly gradient polymers.
CH2 with a characteristic peak at 6.80 ppm of trimethylbenzene as the internal standard. From the Fig. 3(A), the intensity of the peaks at 6.15 ppm and 6.39 ppm gradually decreased as the reaction progressed, which meant that PEGMA and TPMA had been gradually consumed by the RAFT polymerization to successfully construct the PEG-TM polymers. After 36 hours of polymerization, two monomers reached high conversion rates. The kinetic study showed a linear pseudo-first-order kinetic curve as a function of time, as shown in Fig. 3(B). In the early stage of polymerization, the conversion of TPMA was significantly higher than that of PEGMA, so the molar fraction of TPMA in the polymers gradually increased. With the progress of polymerization, the conversion of TPMA almost remained unchanged and the conversion of PEGMA gradually increased, which would result in a gradual decrease in the molar fraction of TPMA in the polymers and a gradual increase in the molar fraction of PEGMA because the concentration of TPMA in the reaction mixture was less and less as compared with that of PEGMA, in other words, the obtained PEG-TM polymers were nearly gradient polymers.
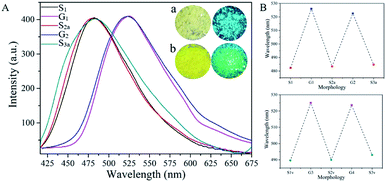
As compared with previously reported TPB dye, the fluorescence intensity of TPMA significantly increased with the red shift of the maximum emission wavelength. As shown in Fig. S1,† the emission wavelength of TPMA increased to 500 nm with a marked increase of fluorescence intensity, while the emission wavelength of TPB dye was 470 nm with the very weak fluorescence intensity under the same condition. The increase of the fluorescence emission wavelength of the dye could effectively enhance the light transmittance and reduce light damage, which meant that TPMA was more favorable for bioimaging. As an electron-withdrawing group, the –CN group would average the electron cloud distribution of the dye TPMA with additional conjugation effect, thereby reducing the energy transition from the first excited state S1 to the ground state S0, which resulted in the red shift of fluorescence emission.40 The fluorescence emission spectrum of the TPMA dye in the solid state was further measured, and its maximum emission wavelength appeared at 483 nm, accompanied by strong blue-green light observed under ultraviolet light. Surprisingly, when the sample was ground, the color of the TPMA dye changed from light yellow to bright yellow, and the maximum emission wavelength was red-shifted to 526 nm with strong green light observed under ultraviolet light, as shown in Fig. 4. Then the ground sample was annealed, the maximum emission wavelength of TPMA was changed from 526 nm back to 483 nm. Repeated grinding and annealing of the samples gave similar results, confirming that TPMA had good reversibility between the two wavelengths, which should attribute to the transformation of TPMA between amorphous and crystalline structures.41 Aside from annealing, solvent–vapor-induced crystallized samples (S1v, S2v and S3v) are obtained from the ground samples. The good reversibility between the two wavelengths is similar with the above phenomenon, suggesting that both annealing and vapor inducement can promptly revert high two-photon fluorescence from green light to blue light with multi-stimuli-responsivity.
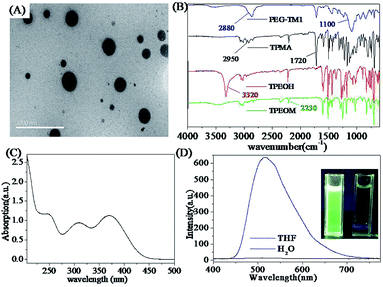
According to the results of 1H NMR analysis, it can be firmly determined that the two monomers of TPMA and PEGMA polymerized to form the polymers PEG-TM, in other words, the polymers PEG-TM simultaneously contained hydrophobic segments and hydrophilic segments, so that the polymers PEG-TM had amphiphilicity property. The different affinity of hydrophobic and hydrophilic segments with water could cause microphase separation, which made the amphiphilic polymers PEG-TM exhibit self-assembly property in water. The hydrophobic TPMA fragments gathered together spontaneously, while the hydrophilic PEGMA fragments autonomously wrapped around the periphery of the TPMA aggregates to form nanoparticles with orderly assembled core–shell structures. In order to verify the successful self-assembly of polymers in water, their structure and morphology were studied by transmission electron microscopy (TEM). Spherical particles with a diameter in the range of 150 to 250 nm can be clearly observed from Fig. 5(A), which was the result of the successful self-assembly of the amphiphilic polymer PEG-TM1 in water. This result also proved the success of RAFT polymerization from the side. In order to corroborate the results of 1H NMR analysis, the structure of TPEOM, TPEOH, TPMA and PEG-TM1 were better study and their FT-IR spectra were illustrated in Fig. 5(B). From the spectrum of TPEOM, the stretching vibration peak of –CN bond could be easily found at 2230 cm−1, which meant that the 4-methoxyphenylacetonitrile was introduced into the molecular structure. As compared with the spectrum of TPEOM, the spectrum of TPEOH presented another sharp peak at 3320 cm−1, which could be considered as the stretching vibration of O–H, demonstrating that boron tribromide successfully translated the methoxy group of TPEOM into a hydroxyl group of TPEOH. For the fluorescent monomer TPE-MA, the peak at 3320 cm−1 completely disappeared, and a new typical absorption peak appeared at 1720 cm−1, which corresponded to the stretching vibration of C![[double bond, length as m-dash]](https://www.rsc.org/images/entities/char_e001.gif) O. Further, the peak at 2950 cm−1 was related to the stretching vibration motion of C–H on the alkane chain, which completely confirmed that TPEOH was successfully subjected to an acylation reaction with methacryloyl chloride to introduce a methacryloyl group. From the spectrum of the polymer PEG-TM1, three obvious representative absorption peaks were noticed, which were respectively located at 2880, 1720 and 1100 cm−1, being closely related to the stretching vibrations of –CH2–, C
O. Further, the peak at 2950 cm−1 was related to the stretching vibration motion of C–H on the alkane chain, which completely confirmed that TPEOH was successfully subjected to an acylation reaction with methacryloyl chloride to introduce a methacryloyl group. From the spectrum of the polymer PEG-TM1, three obvious representative absorption peaks were noticed, which were respectively located at 2880, 1720 and 1100 cm−1, being closely related to the stretching vibrations of –CH2–, C![[double bond, length as m-dash]](https://www.rsc.org/images/entities/char_e001.gif) O and C–O. In summary, the spectrum of PEG-TM1 simultaneously showed the characteristic structure of TPMA and PEGMA, which further proved that TPMA and PEGMA were successfully introduced into the polymers PEG-TM1 through RAFT polymerization.
O and C–O. In summary, the spectrum of PEG-TM1 simultaneously showed the characteristic structure of TPMA and PEGMA, which further proved that TPMA and PEGMA were successfully introduced into the polymers PEG-TM1 through RAFT polymerization.
The amphiphilic polymers PEG-TM would exhibit self-assembly characteristic in water due to the microphase separation caused by different affinity of TPMA and PEGMA segments with water. In water, the amphiphilic polymer PEG-TM1 self-assembled into the corresponding FONs, and their UV-visible absorption spectrum was shown in Fig. 5(C). There were three distinct absorption peaks at 248, 309 and 370 nm, respectively. The peak at 248 nm was closely related to the π → π* electronic transition of polycyclic aromatic hydrocarbons. Meanwhile, the molecular structure of the polymers contained heteroatoms O and N, whose n → π* electronic transition of lone pair electrons caused absorption peaks at 309 nm and 370 nm. When the wavelength was greater than 450 nm, the absorbance was almost zero which was not affected by light scattering and Mie effect, suggesting that the PEG-TM1 polymers had high water solubility and dispersion in water.42,43 The fluorescence spectra of the PEG-TM1 polymers in water and THF were shown in Fig. 5(D). In water, the maximum emission wavelength of PEG-TM1 presented at 518 nm with strong green luminescence, while in THF there was almost no fluorescence, indicating that PEG-TM1 had obvious AIE characteristic. In a good solvent such as THF, the intramolecular rotation of PEG-TM1 polymer was spontaneous and active. When PEG-TM1 was stimulated by external energy ultraviolet light, they would absorb external energy and transited to the excited state from the ground state S0. Then the unstable molecules would return to the S0 from the excited state through the active intramolecular motion, which was an effective non-radiative pathway for the attenuation of the excited state energy. When the PEG-TM1 polymer self-assembled into nanoparticles in water, the hydrophobic TPMA fragments would aggregate inside the PEG-TM1 FONs, and the interaction of the various molecules limited their intramolecular rotation, thus the excited state energy attenuated through the radiation pathway, inducing the fluorescence emission.
3.2. Application of PEG-TM FONs in biological imaging
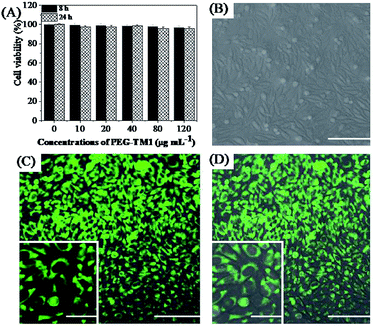
Firstly, polymers PEG-TM FONs should have good biocompatibility, which is a necessary condition for PEG-TM FONs to be used in cell imaging. The experimental results of the effect of PEG-TM1 FONs on the morphology and cell viability of L929 cells precisely proved that PEG-TM1 FONs had good biocompatibility.44–49 The optical microscopy images in Fig. S2† showed the status of L929 cells which was cultured with different contents of PEG-TM1 FONs for 24 h. No matter whether the cells were cultured with lower concentration or higher concentration of PEG-TM1 FONs, the cell morphology did not change significantly and remained in a normal status. Fig. 6(A) showed the cell viability of L929 cells which was calculated from the results of the CCK-8 assay, in which L929 cells was nurtured with different PEG-TM1 FONs content for 8 and 24 h and one control group was set as a reference. The cell viability of all L929 cells treated with PEG-TM1 FONs was more than 90%. The results of the above two experiments demonstrated that the prepared PEG-TM1 FONs had good biocompatibility.Then the possibility of PEG-TM1 FONs in cell imaging applications were further explored by confocal laser scanning microscope (CLSM).50,51 Under the irradiation of 405 nm laser, as shown in Fig. 6(B)–(D), the CLSM images of L929 cells were taken which were nurtured with 20 μg mL−1 PEG-TM1 FONs for 3 hours. The treated L929 cells showed an obvious green fluorescence, which was consistent with the fluorescence emitted by the PEG-TM1 FONs, indicating that PEG-TM1 FONs have been taken up by the cells through endocytosis. At the same time, it could be observed that each cell contained a region with very weak fluorescence. A comprehensive comparison of the size differences of PEG-TM1 FONs and various organelles in the cells determined that the region with very weak fluorescence was identified as the nucleus, which also indicated that PEG-TM1 FONs mainly concentrated in the cytoplasm region after being taken up by the cells. Based on all the characterization and experimental results, PEG-TM1 FONs have good fluorescence property, high water dispersibility and good biocompatibility. Moreover, PEG-TM1 FONs showed good imaging effects after entering into the cells by endocytosis, indicating that the prepared PEG-TM1 FONs were a good bioimaging material with broad application prospects.
4. Conclusions
To sum up, enlightened by the advantages of TPE derivatives and RAFT polymerization, a novel methacrylate functionalized-TPE TPMA dye was synthesized with good fluorescence intensity and obvious red shift of emission wavelength as compared with the reported TPB dye, which was very favorable for cells imaging. Moreover, the obtained TPMA dye exhibits multi-stimuli-responsivity and two-photon fluorescent switch with excellent reversibility in the solid state. And then the corresponding polymers PEG-TM were successfully synthesized via RAFT polymerization combining the hydrophilic monomer PEGMA with the various feeding ratio of TPMA. From the 1H NMR analysis, when the feeding ratio of TPMA increased to 32.2% from 19.2%, the molar fraction of TPMA in PEG-TM polymers accordingly increased to 32.8% from 19.5%. Polymers PEG-TM1 were amphiphilic and would self-assemble into FONs in water solution with diameters ranging from 150 to 250 nm. The maximum emission wavelength of PEG-TM1 FONs in water presented at 518 nm, while there was almost no fluorescence in THF solution, which showed that PEG-TM1 had obvious AIE performance. Then some detailed studies showed that PEG-TM1 FONs had good biocompatibility and potential in cell imaging. Further consideration of the advantage of easy modification of functional groups, more TPE-based functional monomers suitable for RAFT polymerization could be designed and developed to obtain more multifunctional polymers, which provided a way for the preparation of novel multifunctional polymers for medical therapeutic diagnostics and bioimaging.Conflicts of interest
There are no conflicts to declare.Acknowledgements
This research was supported by the Natural Science Foundation of Guangdong Province (2018A030313784), the National Science Foundation of China (No. 51673107, 21574073), and the Science and Technology Project of Zhongshan City of China (2018B1112).References
- Y. He, S. Shi, N. Liu, Y. Ding, J. Yin and Z. Wu, Macromolecules, 2016, 49, 48–58 CrossRef CAS.
- H. Wang, G. Liu, H. Gao and Y. Wang, Polym. Chem., 2015, 6, 4715–4718 RSC.
- X. Zhang, K. Wang, M. Liu, X. Zhang, L. Tao, Y. Chen and Y. Wei, Nanoscale, 2015, 7, 11486–11508 RSC.
- J. D. Luo, Z. Xie, J. Lam, L. Cheng, H. Chen, C. Qiu, H. Kwok, X. Zhan, Y. Liu, D. Zhu and B. Tang, Chem. Commun., 2001, 1740–1741 RSC.
- J. Chen, M. Liu, Q. Huang, L. Huang, H. Huang, F. Deng, Y. Wen, J. Tian, X. Zhang and Y. Wei, Chem. Eng. J., 2018, 337, 82–90 CrossRef CAS.
- L. Mao, Y. Liu, S. Yang, Y. Li, X. Zhang and W. Yen, Dyes Pigm., 2019, 162, 611–623 CrossRef CAS.
- Q. Wan, Q. Huang, M. Liu, D. Xu, H. Huang, X. Zhang and Y. Wei, Applied Materials Today, 2017, 9, 145–160 CrossRef.
- L. Huang, S. Yang, J. Chen, J. Tian, Q. Huang, H. Huang, Y. Wen, F. Deng, X. Zhang and Y. Wei, Mater. Sci. Eng., C, 2019, 94, 270–278 CrossRef CAS PubMed.
- R. Jiang, M. Liu, H. Huang, L. Mao, Q. Huang, Y. Wen, Q. Cao, J. Tian, X. Zhang and W. Yen, J. Colloid Interface Sci., 2018, 519, 137–144 CrossRef CAS PubMed.
- W. Shen, J. Yu, J. Ge, R. Zhang, F. Cheng, X. Li, Y. Fan, S. Yu, B. Liu and Q. Zhu, ACS Appl. Mater. Interfaces, 2016, 8, 927–935 CrossRef CAS PubMed.
- S. Li, Y. Shang, E. Zhao, R. Kwok, J. Lam, Y. Song and B. Tang, J. Mater. Chem. C, 2015, 3, 3445–3451 RSC.
- H. Zhou, F. Liu, X. Wang, H. Yan, J. Song, Q. Ye, B. Tang and J. Xu, J. Mater. Chem. C, 2015, 3, 5490–5498 RSC.
- W. Lu, P. Xiao, J. Gu, J. Zhang, Y. Huang, Q. Huang and T. Chen, Sens. Actuators, B, 2016, 228, 551–556 CrossRef CAS.
- Y. Wang, X. Wu, Y. Cheng and X. Zhao, Chem. Commun., 2016, 52, 3478–3481 RSC.
- H. Li, J. Chang, T. Hou and F. Li, J. Mater. Chem. B, 2016, 4, 198–201 RSC.
- H. Shi, D. Xin, X. Gu, P. Zhang, H. Peng, S. Chen, G. Lin, Z. Zhao and B. Tang, J. Mater. Chem. C, 2016, 4, 1228–1237 RSC.
- L. Chen, C. Zhang, G. Lin, H. Nie, W. Luo, Z. Zhuang, S. Ding, R. Hu, S. Su, F. Huang, A. Qin, Z. Zhao and B. Tang, J. Mater. Chem. C, 2016, 4, 2775–2783 RSC.
- F. Tang, J. Peng, R. Liu, C. Yao, X. Xu and L. Li, RSC Adv., 2015, 5, 71419–71424 RSC.
- H. Sun, J. Li, F. Han, R. Zhang, Y. Zhao, B. Miao and Z. Ni, Dyes Pigm., 2019, 167, 143–150 CrossRef CAS.
- T. Tian, R. Hu and B. Tang, J. Am. Chem. Soc., 2018, 140, 6156–6163 CrossRef CAS PubMed.
- Z. Luan, L. Zhao, C. Liu, W. Song, P. He and X. Zhang, Talanta, 2019, 201, 450–454 CrossRef CAS PubMed.
- C. Li, Y. Chen, L. Yang, C. Zhang, B. Wang and Y. Wang, Sens. Actuators, B, 2019, 291, 25–33 CrossRef CAS.
- X. Tian, J. Ding, B. Zhang, F. Qiu, X. Zhuang and Y. Chen, Polymers, 2018, 10, 318 CrossRef PubMed.
- G. Zeng, M. Liu, R. Jiang, Q. Huang, L. Huang, Q. Wan, Y. Dai, Y. Wen, X. Zhang and Y. Wei, Mater. Sci. Eng., C, 2018, 83, 154–159 CrossRef CAS PubMed.
- Q. Wan, R. Jiang, L. Mao, D. Xu, G. Zeng, Y. Shi, F. Deng, M. Liu, X. Zhang and Y. Wei, Mater. Chem. Front., 2017, 1, 1051–1058 RSC.
- Z. Huang, X. Zhang, X. Zhang, S. Wang, B. Yang, K. Wang, J. Yuan, L. Tao and Y. Wei, Polym. Bull., 2017, 74, 4525–4536 CrossRef CAS.
- H. Yen and G. Liou, Polym. J., 2016, 48, 117–138 CrossRef CAS.
- B. Mu, X. Hao, J. Chen, Q. Li, C. Zhang and D. Chen, Polym. Chem., 2017, 8, 3286–3293 RSC.
- Y. Wang, X. Huang, T. Li, Z. Wang, L. Li, X. Guo and P. Jiang, J. Mater. Chem. A, 2017, 5, 20737–20746 RSC.
- Z. Huang, R. Wang, Y. Chen, X. Liu, K. Wang, L. Mao, K. Wang, J. Yuan, X. Zhang, L. Tao and Y. Wei, Polym. Chem., 2019, 10, 2162–2169 RSC.
- F. Fan, B. Zhang, S. Song, B. Liu, Y. Cao and Y. Chen, Adv. Electron. Mater., 2018, 4, 1700397 CrossRef.
- Z. Jiang, S. Zhao, Y. Su, N. Liu and Z. Wu, Macromolecules, 2018, 51, 737–745 CrossRef CAS.
- R. Yang, Y. Liu, J. Chen, W. Zhu and G. Dong, J. Appl. Polym. Sci., 2019, 136 DOI:10.1002/app.47870.
- Q. Guo and X. Zhang, J. Biomater. Sci., Polym. Ed., 2019, 30, 815–831 CrossRef CAS PubMed.
- Y. Liu, L. Mao, S. Yang, M. Liu, H. Huang, Y. Wen, F. Deng, Y. Li, X. Zhang and Y. Wei, Mater. Sci. Eng., C, 2019, 94, 310–317 CrossRef CAS PubMed.
- X. Zhang, Z. Chi, B. Xu, C. Chen, X. Zhou, Y. Zhang, S. Liu and J. Xu, J. Mater. Chem., 2012, 22, 18505–18513 RSC.
- L. Tao, J. Liu and T. Davis, Biomacromolecules, 2009, 10, 2847–2851 CrossRef CAS PubMed.
- Z. Huang, X. Zhang, X. Zhang, B. Yang, Y. Zhang, K. Wang, J. Yuan, L. Tao and Y. Wei, Polym. Chem., 2015, 6, 2133–2138 RSC.
- Z. Huang, K. Song, F. Liu, J. Long, H. Hu, H. Gao and Q. Wu, J. Polym. Sci., Part A: Polym. Chem., 2008, 46, 1618–1628 CrossRef CAS.
- R. Jiang, H. Liu, M. Liu, J. Tian, Q. Huang, H. Huang, Y. Wen, Q. Cao, X. Zhang and Y. Wei, Mater. Sci. Eng., C, 2017, 81, 416–421 CrossRef CAS PubMed.
- B. Xu, M. Xie, J. He, B. Xu, Z. Chi, W. Tian, L. Jiang, F. Zhao, S. Liu, Y. Zhang, Z. Xu and J. Xu, Chem. Commun., 2013, 49, 273–275 RSC.
- X. Zhang, X. Zhang, B. Yang, J. Hui, M. Liu, Z. Chi, S. Liu, J. Xu and Y. Wei, Polym. Chem., 2014, 5, 318–322 RSC.
- X. Zhang, Z. Chi, J. Zhang, H. Li, B. Xu, X. Li, S. Liu, Y. Zhang and J. Xu, J. Phys. Chem. B, 2011, 115, 7606–7611 CrossRef CAS PubMed.
- X. Zhang, J. Yin, C. Peng, W. Hu, Z. Zhu, W. Li, C. Fan and Q. Huang, Carbon, 2011, 49, 986–995 CrossRef CAS.
- X. Zhang, M. Liu, B. Yang, X. Zhang and Y. Wei, Colloids Surf., B, 2013, 112, 81–86 CrossRef CAS PubMed.
- X. Zhang, W. Hu, J. Li, L. Tao and Y. Wei, Toxicol. Res., 2012, 1, 62–68 CrossRef CAS.
- Y. Zhao, B. Yang, Y. Zhang, S. Wang, C. Fu, Y. Wei and L. Tao, Polym. Chem., 2014, 5, 6656–6661 RSC.
- X. Zhang, H. Qi, S. Wang, L. Feng, Y. Ji, L. Tao, S. Li and Y. Wei, Toxicol. Res., 2012, 1, 201–205 CrossRef CAS.
- X. Zhang, S. Wang, M. Liu, J. Hui, B. Yang, L. Tao and Y. Wei, Toxicol. Res., 2013, 2, 335–342 CrossRef CAS.
- X. Zhang, S. Wang, C. Fu, L. Feng, Y. Ji, L. Tao, S. Li and Y. Wei, Polym. Chem., 2012, 3, 2716–2719 RSC.
- B. Yang, Y. Zhang, X. Zhang, L. Tao, S. Li and Y. Wei, Polym. Chem., 2012, 3, 3235–3238 RSC.
Footnote |
| † Electronic supplementary information (ESI) available. CCDC 1910007. For ESI and crystallographic data in CIF or other electronic format see DOI: 10.1039/c9ra10430e |
| This journal is © The Royal Society of Chemistry 2020 |

