 Open Access Article
Effects of ozone concentration on the postharvest quality and microbial diversity of Muscat Hamburg grapes
Cong-cong Gaoa,
Qi Lina,
Cheng-hu Dongb,
Hai-peng Jib,
Jin-ze Yub,
Cun-kun Chenb,
Zhi-Qiang Zhub,
Zhaojun Banc,
Na Zhang *b and
Yuan-yuan Bao*a
aCollege of Food Science and Technology, Yunnan Agricultural University, No. 452, Fengyuan Road, Panlong District, Kunming 650000, China. E-mail: 380984741@qq.com
bNational Engineering Technology Research Center for Preservation of Agricultural Products, Key Laboratory of Storage of Agricultural Products, Ministry of Agriculture and Rural Affairs, Tianjin Key Laboratory of Postharvest Physiology and Storage of Agricultural Products, Tianjin 300384, China. E-mail: wuaidehua@163.com
cZhejiang Provincial Key Laboratory of Chemical and Biological Processing Technology of Farm Products, Zhejiang University of Science and Technology, Hangzhou, China
First published on 2nd March 2020
Abstract
Grapevines are widely planted around the world. Although grapes have high nutritional value, they are highly perishable. To explore the effect of ozone concentration on the postharvest quality of Muscat Hamburg grapes, the ethylene production rate, respiratory intensity, soluble solids, titratable acidity, firmness, threshing rate, total yeast and mold counts, and the activities of superoxide dismutase, peroxidase, catalase, polyphenol oxidase and phenylalanine ammonia lyase were determined, and the fungal metagenome on the grape surface was analyzed. Among the ozone treatment groups, 14.98 mg m−3 ozone showed a positive effect on grape preservation. After 80 days of storage, the contents of soluble solids and titratable acidity increased by 3.1% and 0.03%, respectively, compared with the control group. Over the same period, firmness increased by 4.22 N and the threshing rate decreased by 0.5%. During storage, the activity of polyphenol oxidase was inhibited and the activities of superoxide dismutase, peroxidase, catalase, and phenylalanine ammonia lyase were maintained, which delayed the senescence of grapes and maintained freshness. Ozone can reduce the number of fungi on the grape surface, change the colony structure, and reduce the occurrence of diseases. An ozone concentration of 14.98 mg m−3 can delay the senescence of Muscat Hamburg grapes and improve storage quality.
1. Introduction
Vitis vinifera L. cultivars are widely planted around the world. Grapes have high nutritional value, strong antioxidant and anticancer activities, and are beneficial to human health.1 However, there are a large number of pathogenic fungi on the surfaces of grapes, which directly lead to grape spoilage.2 During storage, a series of physiological and biochemical reactions occur in the grapes, including enhancement of respiration, consumption of nutrients, and loss of water, which reduce the grape quality. Presently, biological and chemical fungicides are used for postharvest preservation to control pathogenic microorganisms, but both these types of fungicides have limitations and may affect human health.3 Ozone treatment is a green and effective method for maintaining freshness. Ozone is a strong, safe oxidant, and leaves no residues, which means it can be used in direct contact with fruit. Ozone can effectively kill pathogenic microorganisms and eliminate residues of harmful substances, and it can degrade pesticide residues on the fruit surface and harmful gases such as ethylene, acetaldehyde, and ethanol during storage; therefore, ozone treatment is an ideal technique for maintaining the freshness of fruits and vegetables.4Grapes are vulnerable to mechanical damage and bacterial infection during storage and transportation, and have certain response mechanisms to various biological and abiotic stresses that produce the most favorable physiological conditions for survival. Plant defense mechanisms related to antioxidant stress are closely associated with ozone, and ozone can activate plant defense mechanisms to resist damage.5,6 Differences in plant tolerance to ozone are often related to differences in antioxidant enzyme activity.7 Antioxidant enzymes play an active role in the disease resistance in Piper nigrum L. T. Chernikova and P. Nazeem8,9 found that ozone affected microorganisms, and ozone treatment had a good protective effect against fungal infections and water loss in strawberries, which prolonged their shelf life. Exposure of plants to ozone can stimulate several pathways, and exposure at different doses or at different times has different effects,10 however, the ozone concentration does not seem to have a strict linear relationship with the dose entering the plant.11
As a strong oxidant with high activity and high permeability that leaves no residues, ozone has great potential in fruit and vegetable preservation. In this study, Muscat Hamburg grapes were used to explore preservation with different concentrations of ozone. The preservation effect of ozone was studied by evaluating the grape quality, antioxidant enzyme activity, phenylalanine ammonia lyase activity, and fungal colony structure on the grape surface, and the optimum treatment for long-term storage was determined. This study provides a theoretical and technical basis for establishment of simple and safe storage and preservation techniques for grapes.
2. Materials and methods
2.1 Materials
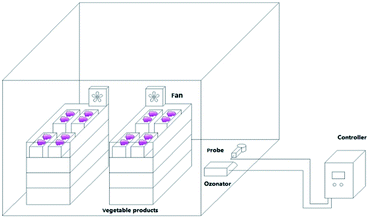
Muscat Hamburg grapes were collected from the Hangu District, Tianjin, China, on August 14, 2018. Fresh grapes with uniform sizes and maturities, no mechanical damage, and no diseases or insect pests were pre-chilled at −2 to −1 °C for 12 h and then stored at 0 ± 1 °C. The grapes were sealed in large tents with 33 boxes per tent and about 4 kg of grapes per box. Each group with different concentrations of ozone (6.42 mg m−3, 10.7 mg m−3 and 14.98 mg m−3) for 30 min every day (Fig. 1). Grapes in the control check (ck) group were sealed in 20 μm polyethylene bags and stored at 0 ± 1 °C. The ozone sensor (MIC-03, Shenzhen) is installed in the large tent with two fans of 0.4 m s−1 generating a breeze of 0.2 m s−1 to ensure the sensitivity and uniformity of the sensor to ensure a stable ozone concentration chamber at low temperatures.12 The ethylene yield, respiratory intensity, firmness, soluble solids, titratable acidity, threshing rate, and activities of superoxide dismutase (SOD), peroxidase (POD), catalase (CAT), polyphenol oxidase (PPO), and phenylalanine ammonia lyase (PAL) were measured every 20 days. The total yeast and mold contents, and the metagenomes of the ck and 14.98 mg m−3 treatment.2.2 Soluble solids, titratable acidity, firmness, and threshing rate
For determination of the soluble solid content, three grapes were crushed in a mortar and filtered through gauze. The resulting juice was analyzed using a PLA-1 digital hand-held pocket refractometer (Atago Co., Ltd., Tokyo, Japan). Each measurement was repeated three times. The results are expressed as percentages (%).To determine the titratable acidity, a 20 mL sample of diluted juice (10 mL of grape juice diluted to 250 mL with distilled water) was titrated with 0.01 M NaOH until the color of the solution changed to pink (phenolphthalein indicator) for 30 s. Each measurement was repeated three times. The results are expressed as percentages (%).13
A TA.XTplus texture analyzer (Stable Micro Systems Ltd., Godalming, Surrey, UK) was used to measure the grape firmness. Puncture tests (P/2, ø 2 mm) were conducted with a puncture depth of 6 mm and speed of 2 mm s−1. The grapes were all tested by the same method, and each test was repeated 10 times. The results are expressed as the firmness (N).14
The threshing rate (%) was calculated as the mass of threshed grapes/total grape mass.15
2.3 Ethylene production rate and respiration intensity
The ethylene production rate was determined according to an established method.16 About 300 g of each sample was weighed at 0 °C and placed in a 3 L sealed container for 2 h. Then, 20 mL of gas (20 mL glass syringe) was extracted and injected into a gas chromatograph (GC-2010 Plus, Shimadzu), with a SH-Rt-Alumina BOND/Na2SO4 Column (R227-36316-01, 0.53 mm × 10 μm × 30 m) and a flame ionization detector (FID). The carrier gas was N2 with a rate of 14 mL min−1. The temperature of the injector, detector, and oven were 120 °C, 150 °C and 160 °C, respectively. Nitrogen was used as carrier gas. The result was calculated in μL (kg h)−1.The respiratory intensity (in mg (kg h)−1) was measured using a CheckMate 9900 (PBI Dansensor Co., Denmark).17
2.4 SOD, POD, PPO, CAT, and PAL activities
To process each sample, 5 g of grape tissue was weighed and crushed in an ice bath, and then 5 mL of extraction buffer (0.1 M, pH 7.8) containing 5% polyvinylpyrrolidone and 5 mM dithiothreitol was added. The solution was then centrifuged for 15 min at 4 °C and 12![[thin space (1/6-em)]](https://www.rsc.org/images/entities/char_2009.gif) 000 × g.
000 × g.
The SOD activity was determined according to an established method.18,19 The optical density was measured at 560 nm. One unit of SOD activity (U) was defined as inhibition of nitrotetrazolium blue chloride photochemical reduction by 50%. The SOD activity per gram of fruit or vegetable sample (fresh weight) was calculated in U g−1.
The POD activity was determined according to an established method20 with slight modifications. The reaction mixture contained 3 mL of 25 mmol L−1 guaiacol solution, 1 mL of 0.5 mol L−1 H2O2, and 0.5 mL of enzyme extract. The POD activity was calculated by measuring the absorbance at 470 nm. One unit of enzyme activity (U) was defined as the amount of enzyme required to change the absorbance by one per minute. The POD activity per gram of fruit or vegetable (fresh weight) was calculated in U g−1.
To measure the PPO activity, 4 mL of 50 mM acetic acid–sodium acetate buffer (pH 5.5), 1 mL of catechol (0.5 M), and 100 μL of enzyme extract were mixed, and the absorbance was measured at 420 nm. One enzyme activity unit (U) was defined as the amount of enzyme required to change absorbance by 0.01 per minute. The PPO activity per gram of fruit or vegetable (fresh weight) was calculated in U g−1.21
To measure the CAT activity, 100 μL of enzyme extract and 2.9 mL of 20 mM H2O2 were mixed and the absorbance was measured at 240 nm. One enzyme activity unit (U) was defined as the amount of enzyme required to change the absorbance by 0.01 per minute. The CAT activity per gram of fruit or vegetable (fresh weight) was calculated in U g−1.22
To measure the PAL activity, 3 mL of 50 mM phosphate buffer (pH 8.8), 0.5 mL of 20 mM L-phenylalanine solution, and 0.5 mL of enzyme extract were mixed. After incubation of the mixture at 37 °C for 60 min, the absorbance was measured at 290 nm. One enzyme activity unit (U) was defined as the amount of enzyme required to change the absorbance by 0.01 per minute. The PAL activity per gram of fruit or vegetable (fresh weight) was calculated in U g−1.23
2.5 Microbial count
The yeast and mold count was determined according to an established method.24 The 10 g sample was homogenized in peptone (0.1% w/v) solution. Use a slapping homogenizer (UBM 400, China) to homogenize. After serial dilution, the diluted samples were plated on potato dextrose agar and incubated at 28 °C for 3–4 days. The results are expressed in log CFU g−1.2.6 Metagenomic sequencing
2.7 Data analysis
All data were analyzed by analysis of variance using SPSS 18.0 software (IBM, USA). Completely randomized design and least significant differences were used to evaluate significant differences between mean values (P < 0.01).3. Results and discussion
3.1 Effects of different ozone treatments on the soluble solid content, titratable acidity, firmness, and threshing rate of Muscat Hamburg grapes
The content of soluble solids is one of the important indexes to evaluate the quality of harvested fruits.30 In the first 20 days of storage, the ozone treatment group showed a downward trend with increases in the storage time, whereas the control group first increased and then decreased (Table 1). As the storage time increased, the soluble solids content in the control group decreased to 15.7%, and that in the 10.7 mg m−3 ozone treatment group first increased and then decreased. The increase in the soluble solids content in the 10.7 mg m−3 treatment group might be caused by rapid loss of water during storage. With storage for a longer time, respiration increased along with sugar consumption. The changes in the 6.42 mg m−3 and 14.98 mg m−3 ozone treatment groups were relatively moderate, and the maximum content of soluble solids after 80 days of storage was 18.3% in the 14.98 mg m−3 treatment group. In a previous study,31 papaya treated with ozone fumigation (2.5 ppm) for 96 h was sweeter and had a higher soluble solids content than untreated fruit.| Fluency indices | Treatments | ||||
|---|---|---|---|---|---|
| ckb | 6.42 mg m−3 | 10.7 mg m−3 | 14.98 mg m−3 | ||
| a The mean ± standard deviation of three replicates are presented. Different letters represent significant differences in the least significant difference test (P < 0.01). Different letters in each line represent significant differences among treatments.b ck, control check.c Uncountable means total yeast and mold counts > 300. | |||||
| Soluble solids content (%) | 0 | 19.67 ± 0.55a | 19.67 ± 0.55a | 19.67 ± 0.55a | 19.67 ± 0.55a |
| 20 | 21.53 ± 1.58a | 17.67 ± 0.81b | 16.2 ± 0.6b | 19.57 ± 0.85abc | |
| 40 | 18.53 ± 0.67b | 18.45 ± 0.45b | 19.3 ± 0.65a | 19.33 ± 1.26 ab | |
| 60 | 17.1 ± 0.1a | 17.43 ± 0.55abc | 19.9 ± 0.1b | 18.57 ± 0.86b | |
| 80 | 15.2 ± 0.1c | 16.5 ± 0.1b | 17.8 ± 0.6a | 18.3 ± 0.1a | |
| Titratable acidity (%) | 0 | 0.29 ± 0.06a | 0.29 ± 0.06a | 0.29 ± 0.06a | 0.29 ± 0.06a |
| 20 | 0.22 ± 0.019a | 0.18 ± 0.02b | 0.17 ± 0.02b | 0.19 ± 0.02b | |
| 40 | 0.13 ± 0.05b | 0.12 ± 0.08b | 0.09 ± 0.01c | 0.14 ± 0.02a | |
| 60 | 0.07 ± 0.001b | 0.06 ± 0.002b | 0.07 ± 0.002b | 0.1 ± 0.01a | |
| 80 | 0.06 ± 0.017c | 0.07 ± 0.004b | 0.07 ± 0.002b | 0.08 ± 0.001a | |
| Firmness (N) | 0 | 8.72 ± 0.08a | 8.72 ± 0.08a | 8.72 ± 0.08a | 8.72 ± 0.08a |
| 20 | 7.35 ± 0.11b | 7.85 ± 0.13a | 6.15 ± 0.06d | 7.09 ± 0.04c | |
| 40 | 8.08 ± 0.14a | 7.57 ± 0.25b | 7.69 ± 0.23a,b | 6.86 ± 0.08c | |
| 60 | 5.69 ± 0.1c | 8.36 ± 0.47a | 6.46 ± 0.42b,c | 7.13 ± 0.45b | |
| 80 | 1.55 ± 0.18c | 2.61 ± 0.28b | 2.14 ± 0.36b,c | 5.78 ± 0.24a | |
| Threshing rate (%) | 0 | 0 | 0 | 0 | 0 |
| 20 | 0 | 0 | 0 | 0 | |
| 40 | 7.25 ± 0.18a | 4.53 ± 0.06c | 6.85 ± 0.1b | 3.79 ± 0.02d | |
| 60 | 14.98 ± 0.05a | 12.76 ± 0.04c | 13.77 ± 0.05b | 11.59 ± 0.02d | |
| 80 | 17.01 ± 0.17c | 19.78 ± 0.06b | 27.54 ± 0.05a | 16.51 ± 0.07d | |
| Total yeast and mold (log10 CFU g−1) | 0 | 1.079 ± 0.04 | 1.079 ± 0.04 | 1.079 ± 0.04 | 1.079 ± 0.04 |
| 20 | 3.398 ± 0.06 | 2.967 ± 0.19 | 2.876 ± 0.16 | 2.845 ± 0.04 | |
| 40 | 4.176 ± 0.11 | 4.0789 ± 0.09 | 4.006 ± 0.05 | 3.699 ± 0.12 | |
| 60 | 4.531 ± 0.06 | 4.578 ± 0.18 | 4.508 ± 0.27 | 4.301 ± 0.02 | |
| 80 | Uncountablec | Uncountablec | Uncountablec | Uncountablec | |
During the first 60 days of storage, the titratable acidity of the 10.7 mg m−3 treatment group decreased the fastest (Table 1), which may be attributed to enhanced respiration accelerating the consumption of organic acid. The 6.42 mg m−3 treatment group showed no significant difference compared with the ck group, and the titratable acidity in the 14.98 mg m−3 group decreased slowly throughout the storage period and reached 0.08% on day 80, which was higher than that in the ck or other treatment groups. Q. Han32 found that mulberry fruits treated with ozone and pre-chilling had high titratable acidities, which was consistent with the results of our study. A. G. Pérez33 found that changes in sugar and acidity in ozone-treated strawberries might be caused by enhanced fatty acids biosynthesis by the antioxidant system.
The firmness of grapes is closely related to maturity and senescence. As a result of respiration, the level of pectin in the fruit decreases, resulting in a decrease in firmness. The firmness of each group in this study decreased throughout the storage period (Table 1). The firmness of grapes in the ck group decreased significantly on day 40, firmness in the 14.98 mg m−3 and 6.42 mg m−3 treatment groups began to decrease on day 60, and in the 6.42 mg m−3, 10.7 mg m−3, and ck groups it began to decrease significantly after 60 days of storage. Compared with the ck group, the 14.98 mg m−3 group maintained fruit firmness for 80 days. L. Rodoni34 reported that ozone treatment could reduce excessive softening of tomatoes. A. Nadas35 showed that ozone could delay fruit softening, and suggested its effect might be related to a decrease in water loss. Our results show that ozone can delay decreases in firmness, which should prolong the storage period and improve the storage quality.
As the storage time increased, the threshing rate of the grapes increased. The three ozone treatment groups had different threshing rates, and there was a significant difference between the 14.98 mg m−3 treatment group and the ck group on day 60. The threshing rates of the 6.42 mg m−3 and 10.7 mg m−3 groups reached 20% and 28%, respectively, on day 80, and were higher than that of the control group. For the 14.98 mg m−3 treatment group, the threshing rate was lower than that of the control group on day 80, indicating that the 14.98 mg m−3 treatment group could inhibit grape senescence. Grapes are a non-respiratory and non-climacteric fruit, and the stem and panicle of the fruit have high respiration intensities and peak respiration. During storage, water loss is considerable, and wilting, browning, and decay of grapes usually begins from the fruit stalk. Meanwhile, stem senescence and fruit shedding is related not only to water loss, but also to ethylene and oxidative stress.35
3.2 Effects of different ozone treatments on the ethylene production rates and respiratory intensities of Muscat Hamburg grapes
Ozone can react with ethylene in air, prevent plant cell wall softening, and delay plant maturation and senescence.36,37 Analysis of changes in the ethylene release rates of grapes treated with the three ozone concentrations (Fig. 2) showed that the ethylene production rate of the 6.42 mg m−3 treatment group was high (2.6 μL (kg h)−1) and there was no significant difference between the 10.7 mg m−3 and 14.98 mg m−3 groups in the first 20 days of storage. After storage for 20 days, ethylene biosynthesis was hindered probably because of the decreased acetyl-CoA carboxylase level, which was caused by inhibition of acetyl-CoA carboxylase synthase gene activity by ozone. The production rate in the 6.42 mg m−3 treatment group decreased gradually.38 The 14.98 mg m−3 treatment group had the best effect on inhibition of ethylene production and delay of senescence. I. S. Minas39 showed that ozone could inhibit ethylene biosynthesis and delay kiwifruit ripening, which is consistent with the results in this study. Another study showed that ethylene was closely associated with the metabolism of polyphenols and antioxidant capacity in grapes.40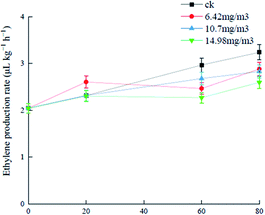 | ||
| Fig. 2 Effects of ozone treatment on the ethylene production rates of Muscat Hamburg grapes at 0 ± 1 °C. | ||
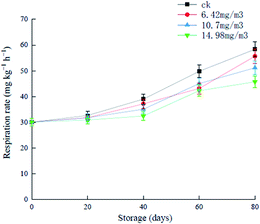
During the first 20 days of storage, there were no significant increases in the respiratory rates in the various groups, and after this, the different groups showed increases to different extents (Fig. 3). The respiratory rate of the ck group was always higher than that of the ozone treatment groups, and increased to 58.38 mg (kg h)−1 in the later stages of storage. Grapes in the 6.42 mg m−3 and 10.7 mg m−3 treatment groups showed rapid increases in respiration rates after 60 days of storage. The 14.98 mg m−3 treatment group showed a good inhibitory effect of the respiratory rate, which was 45.76 mg (kg h)−1 on day 80. These results showed that ozone treatment inhibited the respiration of grapes to different extents. It has been reported that ozone treatment can reduce the respiration rate of black mulberries and prolong their shelf life.32
3.3 Effects of different ozone treatments on SOD, POD, PPO, CAT, and PAL activities in Muscat Hamburg grapes
SOD can eliminate O2−, which plays an important role in protecting cells from toxicity and mutagenesis caused by reactive oxygen species.41 Each group showed an upward trend in SOD during storage (Fig. 4). The ck group had the lowest SOD activity, followed by the 10.7 mg m−3 treatment group. The SOD activities of the 6.42 mg m−3 and 14.98 mg m−3 treatment groups were high, with the 14.98 mg m−3 treatment group having the highest SOD activity. These results indicated that ozone treatment could improve the SOD activity and the ability to scavenge free radicals during storage.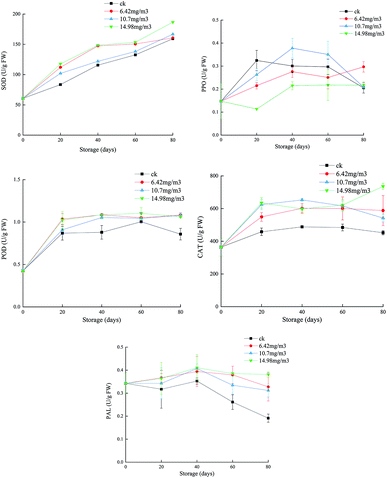 | ||
| Fig. 4 Effects of ozone treatment on the activities of SOD, POD, CAT, PPO, and PAL in Muscat Hamburg grapes at 0 ± 1 °C. | ||
T. Chernikova7 reported that ozone treatment could increase the activity of peroxides in soybeans. POD, which is present in animals, plants, and microorganisms, can catalyze the reaction between H2O2 and various reductants.42 The POD activities of the grapes increased rapidly after 20 days of storage (Fig. 4). The POD activities in the three ozone treatment groups were higher than that in the ck group. After 60 days, the POD activity in the ck group decreased, indicating that ozone could improve the antioxidant capacity of the grapes. Among the ozone treatment groups, the 14.98 mg m−3 treatment group had the highest POD activity over the entire storage period, and this activity could delay the ripening and senescence of grapes postharvest. This is consistent with a previous report that ozone treatment improved POD activity in pepper fruit.43
PPO is a copper-containing metalloprotein that catalyzes the oxidation of phenols to quinones, which in turn produce brown quinones. Inhibition of PPO activity can help control the browning of fruits and vegetables.44 In the first 60 days, the PPO activities of the 6.42 mg m−3 and 14.98 mg m−3 treatment groups were lower than that of the ck group. The PPO activity of the 10.7 mg m−3 treatment group peaked after 40 days of storage and then decreased. The PPO activity in the ck group decreased to its lowest point after 80 days of storage. Among the ozone treatments, the 14.98 mg m−3 treatment was better than the other two treatments at inhibiting PPO activity (Fig. 4). M. K. Ong45 reported that oxalic acid could bind with ozone, which decreased browning and PPO activity.
CAT may be responsible for removing excess reactive oxygen species during oxidative stress.46 Both SOD and CAT are the main active oxygen detoxification enzymes.47 In the present study, the CAT activities in the three treatment groups were higher than that in the ck group, indicating that different concentrations of ozone could delay decreases in the CAT activity. The CAT activity in the 10.7 mg m−3 treatment group began to decrease on day 40 and had decreased to 542.11 U g−1 by day 80, which was a larger reduction than in the other two ozone treatment groups. On day 80, the CAT activity of the 14.98 mg m−3 treatment group was 735.98 U g−1 and that of the 6.42 mg m−3 treatment group was 542.11 U g−1. These results showed that 14.98 mg m−3 and 6.42 mg m−3 ozone treatments could effectively maintain the CAT activity and improve the quality of stored grapes. P. Boonkorn,48 reported that CAT activity increased after ozone fumigation, which was involved in protecting fruit tissue from plant toxicity caused by ozone oxidation.
When fruit is exposed to ozone, active oxygen species may induce multiple defense genes, including PAL, to produce more phenolic compounds, which can react with oxygen free radicals to prevent damage to other compounds.49 Polyphenols in grapes are beneficial to oxidation, inflammation, platelet activation, and vascular function.50 During the first 40 days of storage, the PAL activities in the different groups decreased at different rates with the activity in the ck group decreasing rapidly and those in the 6.42 mg m−3 and 10.7 mg m−3 treatment groups decreasing slowly. After 40 days, the PAL activity of the 14.98 mg m−3 treatment group increased slightly. The 14.9 mg m−3 treatment could increase the PAL activity in grapes (Fig. 4), thus increasing the production of total phenols, which could increase the grape antioxidant activity and delay any decline in grape quality. T. Piechowiak51 reported that the PAL activity of raspberries treated with 8–10 ppm of ozone for 30 min was much higher than that of a control group. Antioxidant capacity is the result of synergistic or antagonistic effects of different polyphenols, and is the result of interaction with the food matrix or other components in the organism.52 The enhancement of antioxidant capacity in ozone-treated grapes is related both to the increase in polyphenols and to their complex reactions.
3.4 Effects of different ozone treatments on the total yeast and colony counts on Muscat Hamburg grapes
The number of microorganisms increased during storage in both the ck and ozone treatment groups (Table 1). Ozone treatment was more effective than ck treatment at reducing the microbial counts.3.5 Effects of different ozone treatments on fungal diversity on Muscat Hamburg grapes
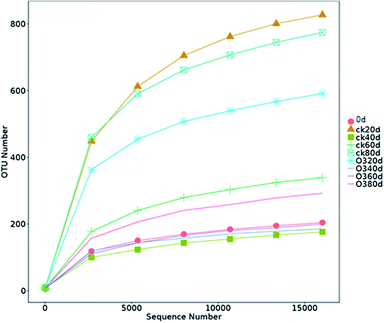
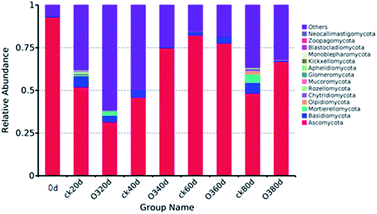
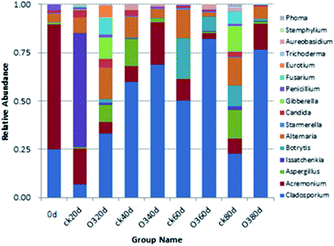
The OTUs and alpha diversities of the ck and ozone treatments were analyzed. Each OTU corresponded to different fungal populations, Ace and Chao are important indicators of microbial community richness, and Shannon is an important index of microbial community diversity. The OTUs and richness indexes (Ace and Chao) of the ck group were higher than those of the ozone treatment groups during storage (Table 2), indicating that the number of species in the ck group was higher than those in the ozone treatment groups. The Shannon of the ck group was higher than those in the ozone treatment groups, except on day 40, which indicated that the ck group had a more diverse fungal community on the grape surface than the ozone treatment groups.
![[thin space (1/6-em)]](https://www.rsc.org/images/entities/char_2009.gif) 021)
021)
| Sample | Observed_species | Shannon | Chao1 | ACE | Coverage |
|---|---|---|---|---|---|
| 0d | 204 | 3.733203528 | 318.0666667 | 267.4529788 | 0.996192497 |
| Ck20d | 827 | 7.009216906 | 1108.303571 | 941.2723371 | 0.98863991 |
| O320d | 591 | 6.775274095 | 1316.214286 | 698.6354928 | 0.990949379 |
| Ck40d | 176 | 4.598132356 | 353 | 261.2442387 | 0.996130079 |
| O340d | 185 | 4.777845187 | 303.25 | 220.0678329 | 0.997316023 |
| Ck60d | 339 | 4.840168659 | 546.2727273 | 421.7704088 | 0.994132701 |
| O360d | 200 | 4.409946236 | 330.7142857 | 273.7192487 | 0.996317334 |
| Ck80d | 774 | 7.543251515 | 1311.65625 | 921.4724482 | 0.988078147 |
| O380d | 292 | 4.691462612 | 850.125 | 389.0408115 | 0.994007865 |
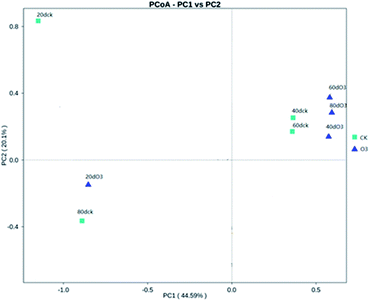
As shown in Fig. 8, on day 20, the colony structures of the ck and ozone treatment groups differed significantly around the PC2 axis. There were no significant differences between the colony structures of the ck and ozone treatment groups on days 40 and 60. On day 80, the colony structures of the ck and ozone treatment groups around the PC1 and PC2 axes differed significantly, which indicated that ozone treatment could alter the microbial community structure on the surface of Muscat Hamburg grapes.
3.6 Network analysis
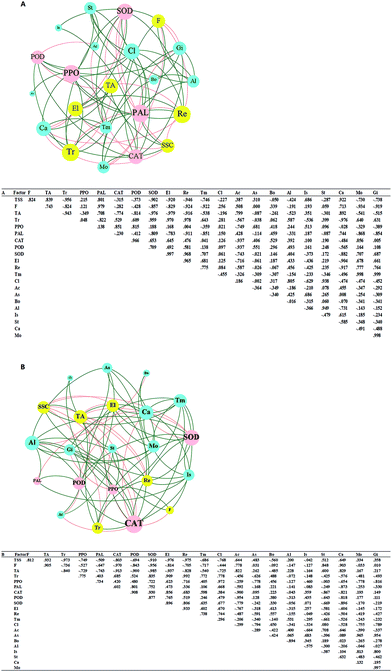
The correlation matrix table provides new perspectives for studying the community structure and function in a complex environment. Because of the differences in co-occurrence of microorganisms in different environments, the co-occurrence network of microorganisms can reflect the influence of different environmental factors on microbial adaptability and the dominant species and closely related genera in an environment. These dominant species and genera often play unique and important roles in maintaining the structure and functional stability of microbial communities in the environment.56,57 Ozone treatment changed the correlation among the indexes, and the grouping of Gibberella, Starmerella, Botrytis, and Cladosporium decreased significantly (Fig. 9). Reduction of the correlation between the colonies and other indicators suggests a reduction in the incidence of related diseases. The correlation between Candida and other indexes increased with ozone treatment, and most of them were positively correlated. It has been reported that Starmerella and Candida have antifungal effects.58 Overall, the network analysis showed that ozone could reduce the risk of grape diseases and prolong the storage period.4. Conclusions
Ozone treatment could delay the decline of grape quality, and this effect was closely related to the ozone concentration. At an appropriate concentration (14.98 mg m−3), ozone could increase the antioxidant activities of SOD, POD and CAT in grapes and improve PAL activity, thus improve grape stress resistance and disease resistance. Ozone could also inhibit the PPO activity and the grape browning rate. Ozone is often used as a fungicide to maintain the freshness of fruits and vegetables. In this study, we found that ozone could change the structure of the fungal community on the grape surface and reduce the fungal diversity, thus reducing the occurrence of diseases. However, the molecular mechanism of grape pathogen resistance in the presence of ozone needs to be explored.Conflicts of interest
There are no conflicts to declare.Acknowledgements
This research was supported by the “Thirteenth Five-Year Plan” for National Key Research and Development Program (grant numbers 2016YFD0400903-05 and 2018YFF0213605-2), Innovation Team of Tianjin Forestry and Pomology Research System (grant numbers ITTFPRS2018009), the Tianjin Innovative Experimental Project for Young Scientists (grant number 2018010), the National Grape Industry Technology System (grant number CARS-29), the present study was supported by the Key Research and development Program in Shangdong Province (2019GNC106045), Major Science and Technology Projects of Yunnan Province (2019ZG00907-02).References
- K. Zhou and J. J. Raffoul, J. Oncol., 2012, 2012, 1–8 CrossRef PubMed.
- G. Martins, J. Vallance, A. Mercier, W. Albertin, P. Stamatopoulos, P. Rey, A. Lonvaud and I. Masneuf-Pomarède, Int. J. Food Microbiol., 2014, 177, 21–28 CrossRef PubMed.
- S. Droby, M. Wisniewski, D. Macarisin and C. Wilson, Postharvest Biol. Technol., 2009, 52, 137–145 CrossRef.
- H. Karaca and Y. S. Velioglu, Food Rev. Int., 2007, 23, 91–106 CrossRef.
- Y. K. Sharma and K. R. Davis, Free Radical Biol. Med., 1997, 23, 480–488 CrossRef CAS PubMed.
- H. Sandermann Jr, D. Ernst, W. Heller and C. Langebartels, Trends Plant Sci., 1998, 3, 47–50 CrossRef.
- T. Chernikova, J. M. Robinson, E. H. Lee and C. L. Mulchi, Photosynth. Res., 2000, 64, 15–26 CrossRef CAS.
- P. Nazeem, C. Achuthan, T. Babu, G. Parab, D. Girija, R. Keshavachandran and R. Samiyappan, J. Trop. Agric., 2008, 46, 45–51 CAS.
- E. V. Contigiani, G. Jaramillo-Sánchez, M. A. Castro, P. L. Gómez and S. M. Alzamora, Food Bioprocess Technol., 2018, 11, 1639–1650 CrossRef CAS.
- M. Iriti and F. Faoro, Oxidative Stress, Water, Air, Soil Pollut., 2008, 187(1–4), 285–301 CAS.
- R. L. Heath, Environ. Pollut., 2008, 155, 453–463 CrossRef CAS PubMed.
- C. Chen, X. Zhang, H. Zhang, Z. Ban, L. Li, C. Dong, H. Ji and W. Xue, RSC Adv., 2019, 9, 676–689 RSC.
- L. Zhang, S. Zhao, S. Lai, F. Chen and H. Yang, Carbohydr. Polym., 2018, 200, 427–435 CrossRef CAS.
- Y. Xin, F. Chen, S. Lai and H. Yang, Postharvest Biol. Technol., 2017, 133, 64–71 CrossRef.
- Z.-J. Ni, K.-D. Hu, C.-B. Song, R.-H. Ma, Z.-R. Li, J.-L. Zheng, L.-H. Fu, Z.-J. Wei and H. Zhang, Oxid. Med. Cell. Longevity, 2016, 2016, 1–14 CrossRef.
- H. Chen, Z. Sun and H. Yang, Sci. Hortic., 2019, 244, 157–164 CrossRef.
- S. Lin, C. Chen, H. Luo, W. Xu, H. Zhang, J. Tian, R. Ju and L. Wang, Postharvest Biol. Technol., 2019, 154, 1–10 CrossRef.
- Y.-J. Zhang, X. Zhang, C.-J. Chen, M.-G. Zhou and H.-C. Wang, Pestic. Biochem. Physiol., 2010, 98, 151–157 CrossRef.
- S. Y. Wang and C.-T. Chen, Food Chem., 2010, 122, 1153–1158 CrossRef.
- Z. Zhang, J. Xu, Y. Chen, J. Wei and B. Wu, Postharvest Biol. Technol., 2019, 152, 9–18 CrossRef.
- J. Lei, B. Li, N. Zhang, R. Yan, W. Guan, C. S. Brennan, H. Gao and B. Peng, Postharvest Biol. Technol., 2018, 139, 99–105 CrossRef.
- F. Xu, S. Liu, Y. Liu, J. Xu, T. Liu and S. Dong, Food Chem., 2019, 288, 201–207 CrossRef.
- M. Wang, L. Zhao, X. Zhang, S. Dhanasekaran, M. H. Abdelhai, Q. Yang, Z. Jiang and H. Zhang, Biol. Control, 2019, 130, 110–117 CrossRef.
- M. Rasouli, M. K. Saba and A. Ramezanian, Sci. Hortic., 2019, 247, 27–34 CrossRef.
- M. Martin, EMBnet j., 2011, 17, 10–12 CrossRef.
- U. Kõljalg, R. H. Nilsson, K. Abarenkov, L. Tedersoo, A. F. Taylor, M. Bahram, S. T. Bates, T. D. Bruns, J. Bengtsson-Palme and T. M. Callaghan, Mol. Ecol., 2013, 22, 5271–5277 CrossRef.
- R. C. Edgar, B. J. Haas, J. C. Clemente, C. Quince and R. Knight, Bioinformatics, 2011, 27, 2194–2200 CrossRef CAS.
- B. J. Haas, D. Gevers, A. M. Earl, M. Feldgarden, D. V. Ward, G. Giannoukos, D. Ciulla, D. Tabbaa, S. K. Highlander and E. Sodergren, Genome Res., 2011, 21, 494–504 CrossRef CAS.
- R. C. Edgar, Nat. Methods, 2013, 10, 996 CrossRef CAS.
- S. Beirão-da-Costa, A. Steiner, L. Correia, J. Empis and M. Moldão-Martins, J. Food Eng., 2006, 76, 616–625 CrossRef.
- A. Ali, M. K. Ong and C. F. Forney, Food Chem., 2014, 142, 19–26 CrossRef CAS.
- Q. Han, H. Gao, H. Chen, X. Fang and W. Wu, Food Chem., 2017, 221, 1947–1953 CrossRef CAS.
- A. G. Pérez, C. Sanz, J. J. Ríos, R. Olias and J. M. Olías, J. Agric. Food Chem., 1999, 47, 1652–1656 CrossRef.
- L. Rodoni, N. Casadei, A. Concellon, A. R. Chaves Alicia and A. R. Vicente, J. Agric. Food Chem., 2009, 58, 594–599 CrossRef.
- A. Nadas, M. Olmo and J. Garcia, J. Food Sci., 2003, 68, 1798–1802 CrossRef CAS.
- I. Balic, A. Moreno, D. Sanhueza, C. Huerta, A. Orellana, B. G. Defilippi and R. Campos-Vargas, Postharvest Biol. Technol., 2012, 72, 47–56 CrossRef CAS.
- W. O. Owino, J. L. Ambuko and F. M. Mathooko, Stewart Postharvest Review, 2005, 2005, 1–10 Search PubMed.
- R. G. Rice, Ozone: Sci. Eng., 2002, 24, 1–15 CrossRef CAS.
- I. S. Minas, A. R. Vicente, A. P. Dhanapal, G. A. Manganaris, V. Goulas, M. Vasilakakis, C. H. Crisosto and A. Molassiotis, Plant Sci., 2014, 229, 76–85 CrossRef CAS.
- L. Xu, Q. Yue, F. e. Bian, H. Sun, H. Zhai and Y. Yao, Front. Plant Sci., 2017, 8, 1426 CrossRef.
- J. G. Scandalios, Plant Physiol., 1993, 101, 7 CrossRef CAS.
- M. Erkan, S. Y. Wang and C. Y. Wang, Postharvest Biol. Technol., 2008, 48, 163–171 CrossRef CAS.
- M. Sachadyn-Król, M. Materska, B. Chilczuk, M. Karaś, A. Jakubczyk, I. Perucka and I. Jackowska, Food Chem., 2016, 211, 59–67 CrossRef.
- C. Queiroz, M. L. Mendes Lopes, E. Fialho and V. L. Valente-Mesquita, Food Rev. Int., 2008, 24, 361–375 CrossRef CAS.
- M. K. Ong, A. Ali, P. G. Alderson and C. F. Forney, Sci. Hortic., 2014, 179, 163–169 CrossRef CAS.
- R. Mittler, Trends Plant Sci., 2002, 7, 405–410 CrossRef CAS.
- M. Iriti and F. Faoro, Water, Air, Soil Pollut., 2008, 187, 285–301 CrossRef CAS.
- P. Boonkorn, H. Gemma, S. Sugaya, S. Setha, J. Uthaibutra and K. Whangchai, Postharvest Biol. Technol., 2012, 67, 25–28 CrossRef CAS.
- Y. Lv, I. I. Tahir and M. E. Olsson, Sci. Hortic., 2019, 253, 49–60 CrossRef CAS.
- C. Carrieri, R. A. Milella, F. Incampo, P. Crupi, D. Antonacci, N. Semeraro and M. Colucci, Food Chem., 2013, 140, 647–653 CrossRef CAS.
- T. Piechowiak and M. Balawejder, Food Chem., 2019, 298, 125093 CrossRef CAS.
- M. Rossetto, P. Vanzani, F. Mattivi, M. Lunelli, M. Scarpa and A. Rigo, Arch. Biochem. Biophys., 2002, 408, 239–245 CrossRef CAS.
- Z. R. Ames, E. Feliziani and J. L. Smilanick, Postharvest Biol. Technol., 2013, 83, 22–26 CrossRef CAS.
- E. Feliziani, G. Romanazzi and J. L. Smilanick, Postharvest Biol. Technol., 2014, 93, 38–48 CrossRef CAS.
- I. S. Minas, G. S. Karaoglanidis, G. A. Manganaris and M. Vasilakakis, Postharvest Biol. Technol., 2010, 58, 203–210 CrossRef CAS.
- K. R. Clarke, Aust. J. Ecol., 1993, 18, 117–143 CrossRef.
- D. I. Warton, S. T. Wright and Y. Wang, Methods Ecol. Evol., 2012, 3, 89–101 CrossRef.
- M. Sipiczki, Appl. Environ. Microbiol., 2006, 72, 6716–6724 CrossRef CAS.
| This journal is © The Royal Society of Chemistry 2020 |

