 Open Access Article
Study of the discharge/charge process of lithium–sulfur batteries by electrochemical impedance spectroscopy
Xiangyun Qiu *ab,
Qingsong Hua*ab,
Lili Zheng
 ab and
Zuoqiang Daiab
aPower & Energy Storage System Research Center, School of Mechanical and Electrical Engineering, Qingdao University, No. 308 Ningxia Road, Qingdao, 266071, P. R. China. E-mail: yunners@126.com; qihu@qdu.edu.cn
bNational Engineering Research Center for Intelligent Electrical Vehicle Power System (Qingdao), No. 308 Ningxia Road, Qingdao, 266071, P. R. China
First published on 3rd February 2020
Abstract
Electrochemical impedance spectroscopy (EIS) was used to study the initial discharge/charge process in a sulfur cathode with different potentials. In the second discharge region (2.00–1.70 V), where soluble polysulfides are reduced to Li2S, the EIS spectra exhibit three semicircles/arcs as the frequency decreased. An appropriate equivalent circuit is proposed to fit the experimental EIS data. Based on detailed analysis of the change in kinetic parameters obtained from simulating the experimental EIS data as functions of potential, the high-frequency, middle-frequency and low-frequency semicircles/arcs can be attributed to the Schottky contact reflecting the electronic properties of materials, the charge transfer step and the formation of Li2S respectively. The inclined line arises from the diffusion process in the detectable potentials and frequency range. Several important electrochemical reactions also have been verified by cyclic voltammetry curves.
1. Introduction
With the rapid development of electronic vehicles and large-scale power transfer installations, the demand for sustainable batteries with high energy density is increasing. Lithium–sulfur (Li–S) batteries have become a hot topic due to their excellent specific capacity (1675 mA h g−1) and theoretical energy density (2600 W h kg−1).1–5 Nevertheless, performances of Li–S batteries are not satisfactory as in theory. Typical weaknesses include poor cycle stability, unimpressive rate performance and unsatisfactory energy production due to the dissolved polysulfide intermediates (Li2Sx, 4 ≤ x ≤ 8) in the electrolyte, and the low electrical and ionic conductivity of elemental sulfur and its final discharge product.6–11 To overcome these problems, the primary task is to better understand the electrochemical behaviors that cover electronic/ionic transport properties and the charge transfer reaction at the electrode/electrolyte interface, since they govern the rate capability and cyclic stability, and would undoubtedly facilitate further electrode optimization.Electrochemical impedance spectroscopy (EIS) is one of the most powerful tools for the analysis of electrochemical processes that occur at electrode/electrolyte interfaces,12 and has been widely used to study the electrochemical lithium intercalation in carbonaceous materials,13,14 layer materials,15–17 transition metal oxides,18,19 special reaction mechanism materials20,21 and sulfur cathodes.22–26 In previous literature,22–24,26,27 the Nyquist plots of electrochemical reactions from sulfur cathodes commonly consist of three parts, namely two semicircles in the high- and middle-frequency range and an inclined line at low frequency. However, a debate related to EIS is still open as to the assignments of the semicircles. It was accepted in some reports that the high-frequency semicircle is related to the charge-transfer resistance and the middle-frequency semicircle is caused by formation of a solid film of Li2S.22,27 Other authors suggested the middle-frequency semicircle should be associated with the charge-transfer resistance, but disagreement has arisen again over the origin of the high-frequency semicircle, including surface layer resistance,23 the ionic mobility of the electrolyte inside the sulfur electrode pores,24 and the interphase contract resistance.26 Moreover, Canas et al.25 proposed that the first loop at high frequency might be associated with the charge transfer occurring at the anode surface. Hence, the reconsideration of the EIS model for the Li–S battery becomes necessary.
In order to make sure that the working point is stationary or at least quasi-stationary at the time of measurement and to eliminate the contribution of the lithium auxiliary electrode/electrolyte interface and then to study the working electrode/electrolyte interface only,28–30 the detailed electrochemical kinetic characteristics of a sulfur cathode have been investigated by EIS in a three-electrode cell in this paper. Kinetic parameters obtained from fitting the experimental impedance spectra in the first discharge–charge process have been analyzed in detail. And based on the verification of important electrochemical reaction regions by cyclic voltammetry, we give a redistribution of the different parts of Nyquist plots accordingly.
2. Experimental
The weight ratio of sulfur (≥99.98%, Sigma-Aldrich), acetylene black and polyvinylidene fluoride was 70![[thin space (1/6-em)]](https://www.rsc.org/images/entities/char_2009.gif) :
:![[thin space (1/6-em)]](https://www.rsc.org/images/entities/char_2009.gif) 20
20![[thin space (1/6-em)]](https://www.rsc.org/images/entities/char_2009.gif) :
:![[thin space (1/6-em)]](https://www.rsc.org/images/entities/char_2009.gif) 10 and they were mixed with N-methyl-2-pyrrolidinone to form a uniform slurry. Then, the slurry was coated on aluminum foil using a roll press, dried by vacuum at 60 °C overnight and cut into appropriate sizes for three-electrode cells. The auxiliary and reference electrodes were both composed of Li foil as previous used.16,17,20,21 The area and thickness of the sulfur cathode were around 4 cm2 and 65 μm respectively. The electrolyte was 1.0 mol L−1 LiTFSI, 1,2-dimethoxyethane and 1,3-dioxolane solvents (1
10 and they were mixed with N-methyl-2-pyrrolidinone to form a uniform slurry. Then, the slurry was coated on aluminum foil using a roll press, dried by vacuum at 60 °C overnight and cut into appropriate sizes for three-electrode cells. The auxiliary and reference electrodes were both composed of Li foil as previous used.16,17,20,21 The area and thickness of the sulfur cathode were around 4 cm2 and 65 μm respectively. The electrolyte was 1.0 mol L−1 LiTFSI, 1,2-dimethoxyethane and 1,3-dioxolane solvents (1![[thin space (1/6-em)]](https://www.rsc.org/images/entities/char_2009.gif) :
:![[thin space (1/6-em)]](https://www.rsc.org/images/entities/char_2009.gif) 1 v/v) with 1 wt% lithium nitrate (LiNO3, additive).
1 v/v) with 1 wt% lithium nitrate (LiNO3, additive).
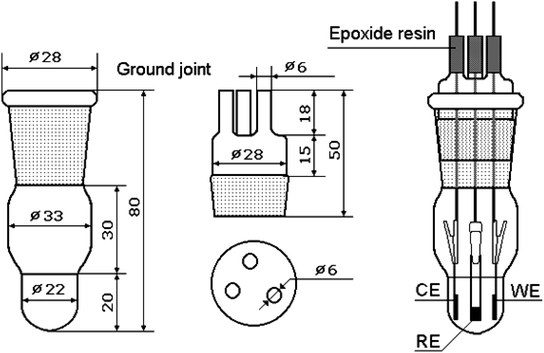
A schematic diagram of the setup that allows impedance measurements to be made in three-electrode configurations is shown in Fig. 1. The working electrode, counter electrode and reference electrode are positioned with stainless steel clamps. The area of the counter electrode (composed of Li foil in this study) is equivalent to that of the working electrode, and both are parallel-opposed. A tiny piece of Li metal is used as a reference electrode, which should be as close to the working electrode as possible to monitor the potential more accurately. An appropriate amount of electrolyte is injected into the chamber but must not reach the stainless steel clamps. The whole assembly process is completed in a glove box filled with argon.
EIS and cyclic voltammetry were performed using an electrochemical workstation (Zennium E4, Zahner, Germany). For the EIS test, the alternating current amplitude was ±5 mV, and the applied frequency range was 0.01 to 1000 kHz. In order to obtain more detailed evolution of impedance spectra during the discharge/charge process, the test interval for each potential was 0.05 V. The electrode was polarized to the desired potential and then equilibrated for 1 h before the EIS measurements were undertaken to make sure the system was quasi-stationary. Impedance data were analyzed using Zview software. The cyclic voltammetry measurements were performed at a scan rate of 0.05 mV s−1.
3. Results and discussion
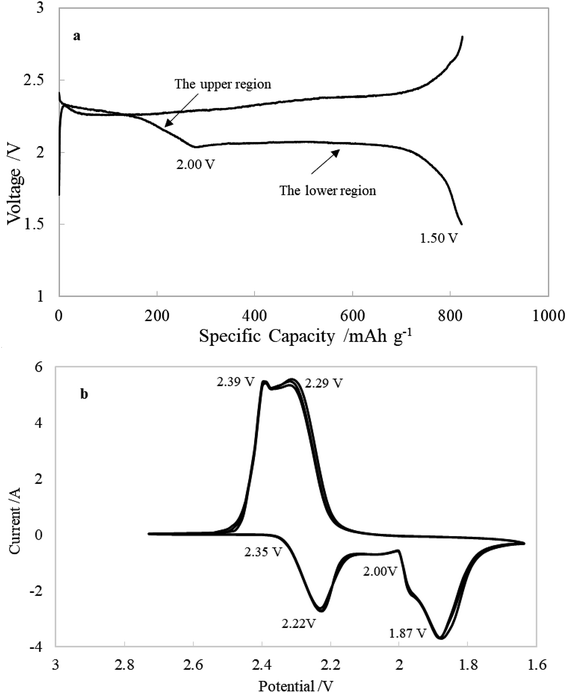
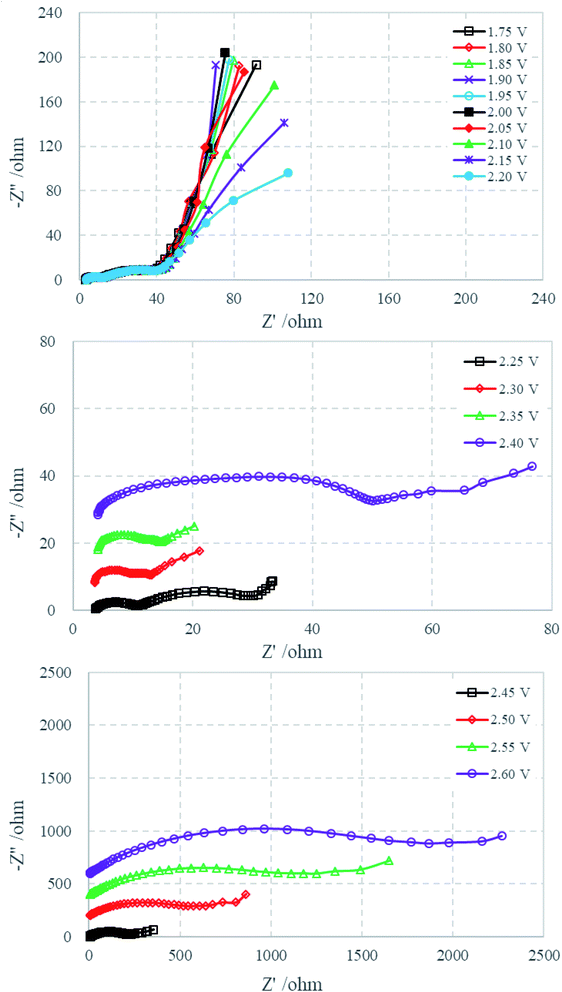
Fig. 2a displays a typical voltage profile of Li–S cells during the first discharge–charge process. The discharge curve shows two obvious plateau potential regions based on the voltage profile. These are the upper discharge region in the range of 2.50–2.00 V and the lower discharge region in the range of 2.00–1.50 V. As generally accepted from previous studies of Li–S cells, the discharge process can be presumably described as follows: the upper discharge region corresponds to the formation of soluble long-chain polysulfides by the reduction of elemental sulfur, which have a long chain length (such as Li2S8 and Li2S6), which increase the viscosity and decrease the ion conductivity. The lower voltage region corresponds to the further reduction of the soluble polysulfides followed by formation of solid reduction product on carbon matrix. Fig. 2b shows the cyclic voltammetry curves. The two cathodic peaks (2.22 V and 1.87 V) are in agreement with the discharge–charge curve, displaying the typical double stage reduction reactions. The relatively close anodic peaks (2.29 V and 2.39 V) are ascribed to the oxidation of Li2S2/Li2S to Li2Sx and soluble polysulfides to Li2S8/S.31Fig. 3 shows the Nyquist plots of the sulfur electrode from 2.7 to 1.7 V during the first discharge process. For the sake of clarity, some plots are shifted by a certain number of ohms along the imaginary axis. The Nyquist plot at the open circuit potential (2.70 V) shows a large semicircle in the high-frequency range (HFS) and an inclined line in the low-frequency region (LFL). With a decrease of electrode polarization potential to 2.40 V, there is no change in shape, but the diameter of HFS changes. When discharged to 2.35 V, another semicircle appeared in the middle-frequency range (MFS), and the LFL, which is strongly dependent on potential, shows an increasing tendency to move toward the real axis. Until 2.05 V, the Nyquist plots are formed by the HFS, MFS and LFL. On further discharging to 1.70 V, the feature of the Nyquist plots clearly contains three separated parts: HFS, MFS and a huge arc in the low-frequency region (LFA). The voltages of particular plot changing points correspond very well with cyclic voltammetry curves (shown in Fig. 2b). Fig. 4 shows the Nyquist plots of the charging process. The plots are similar below 2.00 V, containing two semicircles and an inclined line. On further charging, from 2.05 to 2.20 V, the inclined line involves bending, and then comes back to an inclined line at 2.25 V. Beginning at 2.40 V, the HFS and MFS overlap each other and merge into one single semicircle until the end of charging, 2.60 V.
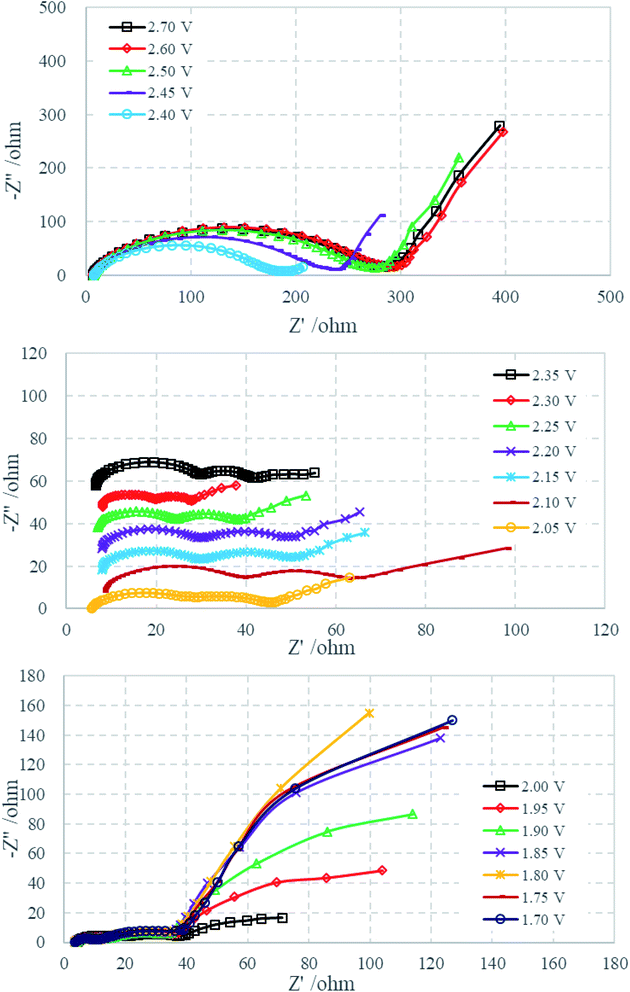 | ||
| Fig. 3 Nyquist plots of the sulfur electrode from 2.70 to 1.70 V during the first discharge process. | ||
In order to clarify the contribution of each part in the Nyquist plots and better understand the electrochemical behaviors, reasonable equivalent circuits shown in Fig. 5 are proposed to fit the impedance spectra of the sulfur electrode recorded in the first discharge–charge process. In the equivalent circuits, R0 is the ohmic resistance; R1, R2 and R3 are the resistance of the HFS, MFS and LFA respectively. The capacitances and the double layer are represented by the constant phase elements (CPE) Q1, Q2 and Q3, respectively. The inclined line in the low-frequency region, however, cannot be properly modelled with a finite Warburg element. Therefore, we replaced the finite diffusion term with a CPE, i.e., QD. This approach was successfully applied in our previous studies and gave a good fit to the experimental data.16,17,20,21 The expression for the admittance response of the CPE (Q) is
 | (1) |
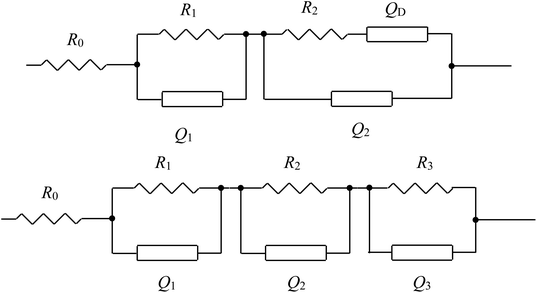 | ||
| Fig. 5 The equivalent circuits proposed for the analysis of the discharge–charge process of the sulfur electrode. | ||
Fig. 6 compares the simulated impedance spectra with the experimental EIS data at 1.90 V (discharge process) and 2.00 V (charge process), and the parameter values are listed in Tables 1 and 2. The relative standard deviations of most of the parameters that were obtained from fitting the experimental impedance spectra are less than 10%, which indicates that the proposed model provides a satisfactory description of the experimental data.
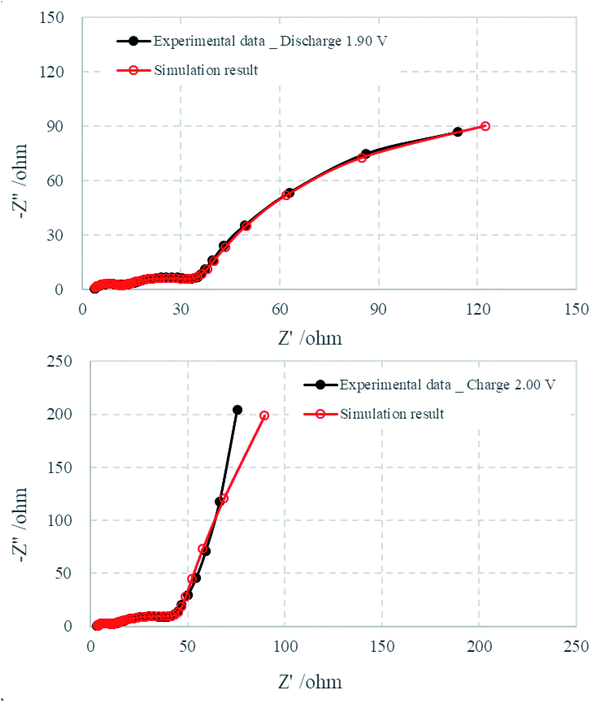 | ||
| Fig. 6 Comparison of EIS experimental data that were collected at 1.90 V (discharge) and 2.00 V (charge) with simulated data. | ||
| Parameter | Value | Uncertainty (%) |
|---|---|---|
| R0 | 3.641 | 1.7 |
| R1 | 7.316 | 4.8 |
| Q1 − Y0 | 1.0 × 10⁻⁵ | 9.1 |
| Q1 − n | 0.802 | 2.8 |
| R2 | 26.72 | 4.5 |
| Q2 − Y0 | 3.3 × 10⁻³ | 9.9 |
| Q2 − n | 0.525 | 4.3 |
| R3 | 233 | 7.4 |
| Q3 − Y0 | 6.5 × 10⁻² | 4.4 |
| Q3 − n | 0.863 | 2.4 |
| Parameter | Value | Uncertainty (%) |
|---|---|---|
| R0 | 3.334 | 2.0 |
| R1 | 6.606 | 4.5 |
| Q1 − Y0 | 7.5 × 10⁻⁶ | 9.1 |
| Q1 − n | 0.827 | 2.9 |
| R2 | 43.39 | 4.8 |
| Q2 − Y0 | 4.1 × 10⁻³ | 9.5 |
| Q2 − n | 0.506 | 3.8 |
| QD − Y0 | 5.0 × 10⁻² | 2.7 |
| QD − n | 0.927 | 1.9 |
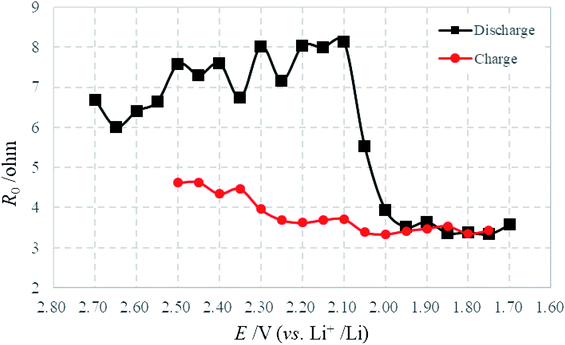
Fig. 7 illustrates variations of R0 as a function of electrode polarization potential, which was calculated by fitting the experimental impedance spectra of the sulfur electrode during the first discharge–charge cycle. R0 represents the ohmic resistance contribution resulting from the electrolyte resistance, current collectors and cell connections. Changes observed in R0 are normally associated with variations in electrolyte properties such as chemical composition or viscosity.25 The electrolyte in Li–S batteries is considerably affected during cycling, because solid reaction products dissolve partially (like sulfur) and soluble polysulfides Li2Sx (with x = 3–8) are accumulated during discharging and charging. The dissolution of polysulfides increases the viscosity of the electrolyte and the resistance. In the discharge process, R0 increases gradually with the dissolution of soluble polysulfides and maximizes at 2.10 V, which is very close to the voltage of the beginning of Li2S formation, meaning the maximum dissolution of soluble polysulfides.26 After that, R0 decreases drastically meaning the generation of short-chain polysulfides and solid Li2S. And then, R0 keeps almost constant. In the charging process, R0 increases gradually from 2.00 V until the tested cut-off voltage, which indicates the existence of a hybrid process: Li2S to Li2Sx and the dissolution of sulfur product. Furthermore, it is well known that for full charging after the first discharge, polysulfides do not transform back into elemental sulfur even at 100% depth of charge.22,32,33
The variation of R1 during the first discharge–charge process as a function of the electrode polarization potential is plotted in Fig. 8a. Because the insoluble discharge products would not be generated before the appearance of lower voltage plateau, and around the open potential (2.70 V) the electrolyte is electrochemically stable, the HFS could not be linked to the formation of a solid film of insoluble discharge products on the cathode. As introduced in the experimental section, the sulfur electrode consists of sulfur and acetylene black. To physically hold the electrode together, a binder is also added. Since sulfur is an insulator, the electron charge conduction through or out of the particles of sulfur must take place as follows: the electrons are transported via the conductive material to the points where they meet the active material and then the electrons hop on the surface of sulfur. It is well known that when a conductor is brought into contact with a semiconductor, a Schottky contact could be formed to contribute resistance.34–36
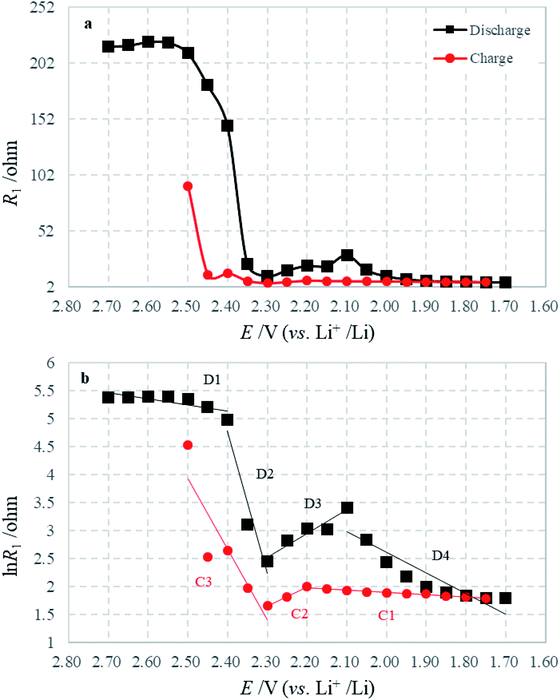 | ||
Fig. 8 Variations of (a) R1 and (b) ln![[thin space (1/6-em)]](https://www.rsc.org/images/entities/char_2009.gif) R1 with electrode potential during the first discharge–charge process. R1 with electrode potential during the first discharge–charge process. | ||
According to thermionic emission diffusion theory, Schottky contact behaviour can be described by an equation which considers the lattice defects, electric field, tunnelling effects, the presence of an interfacial layer, and carrier recombination in the space charge region of the metal–semiconductor contact. Therefore, the Schottky contact resistance R, as deduced in our previous studies,18,19 can be described in terms of the following expression:
 | (2) |
 q is the electronic charge, I0 is the saturation current, E is the applied bias voltage, n is the ideality factor, k is the Boltzmann constant, and T is the absolute temperature. When the contact media do not change, n and I0 can be considered invariable, i.e. C is constant. That is to say, a plot of ln
![[thin space (1/6-em)]](https://www.rsc.org/images/entities/char_2009.gif) R versus E should show a straight line with −q/nkT as the slope and ln
R versus E should show a straight line with −q/nkT as the slope and ln![[thin space (1/6-em)]](https://www.rsc.org/images/entities/char_2009.gif) C as the y-intercept if there is no change in contact media.
C as the y-intercept if there is no change in contact media.
The graph of ln![[thin space (1/6-em)]](https://www.rsc.org/images/entities/char_2009.gif) R1 against E is plotted in Fig. 8b, which is well consistent with eqn (2). In the discharge–charge processes, there are several segments with different slopes and intercepts, which indicate the alternation of contact media: intercept between D1 and D2 means the main reaction of sulfur transformed to long-chain polysulfides; intercept between D2 and D3 shows the main transformation from long-chain to short-chain polysulfides; and intercept between D3 and D4 describes the following reaction from polysulfides to Li2S2 or Li2S, which are reversed in the charging process. The above transformations cause the variation of the Schottky barrier height in I0 and the ideality factor n. That means the transformation of intermediates can influence the viscosity of the electrolyte, but also effect the contact between reactive material and conductive agent.
R1 against E is plotted in Fig. 8b, which is well consistent with eqn (2). In the discharge–charge processes, there are several segments with different slopes and intercepts, which indicate the alternation of contact media: intercept between D1 and D2 means the main reaction of sulfur transformed to long-chain polysulfides; intercept between D2 and D3 shows the main transformation from long-chain to short-chain polysulfides; and intercept between D3 and D4 describes the following reaction from polysulfides to Li2S2 or Li2S, which are reversed in the charging process. The above transformations cause the variation of the Schottky barrier height in I0 and the ideality factor n. That means the transformation of intermediates can influence the viscosity of the electrolyte, but also effect the contact between reactive material and conductive agent.
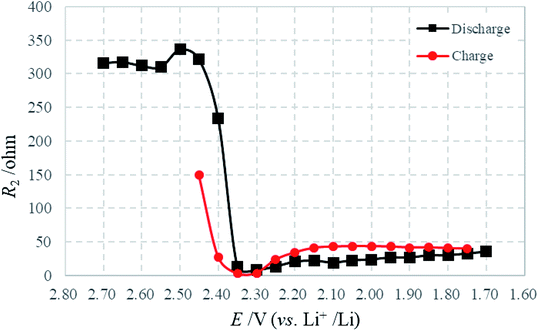
Fig. 9 presents the variation of R2 with potential in the discharge–charge process, where R2 should be attributable to the charge transfer of sulfur intermediates. Note that R2 is highest at initial discharge where the concentration of sulfur intermediates is minimized. And then, the drastic decrease of R2 during the first stages of discharge may be caused by the changes in composition and morphology occurring in the cathode during this period. Because of the dissolution and reaction of sulfur, the content of solid sulfur in the cathode diminishes; a more porous structure remains, with a higher surface area and greater conductivity. The charge transfer of polysulfide ions is enhanced as a result of these factors.25 Moreover, R2 stabilizes at the final stages of discharge with the progressive reduction of polysulfides. The charging process shows a reverse effect.
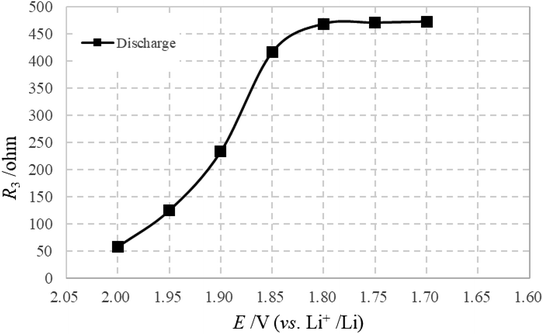
The LFA, appearing below 2.00 V, should be attributed to the formation of Li2S, which is in accordance with the voltage of Li2S generation. Because of this, the diffusion process is strongly influenced and cannot be observed in the test frequency range. Therefore, R3 (variations shown in Fig. 10) is visible when the formation of Li2S starts, and increases continuously with further generation of Li2S. On further discharge from 1.80 to 1.70 V, R3 remains stable due to the main generation of Li2S being finished. For the charge process, it is difficult to observe the effective LFA due to the huge and unsmooth charge transfer reaction, and one only observes the influence of the diffusion process from 2.00 to 2.20 V.
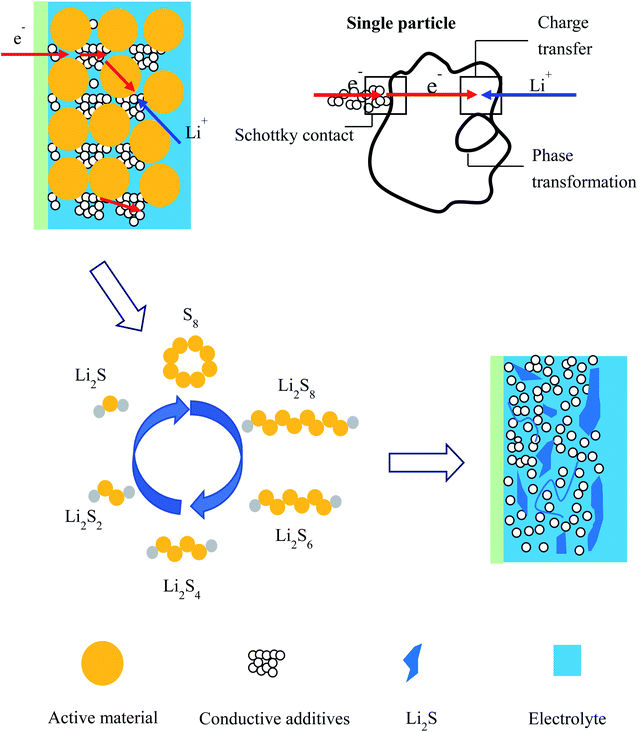
Based on the experimental results and analysis in this study, a schematic model for the discharge process is proposed, as shown in Fig. 11, to explain the physical/chemical mechanism in the sulfur electrode: (1) ionic charge conduction through the electrolyte in the pores of the active material; (2) electronic charge conduction through the conductive additives and the electrons hopping on the surface of active particles through a Schottky contact; (3) electrochemical reaction on the interface of active particles including charge transfer; (4) phase transfer.
4. Conclusions
EIS was used to characterize the electronic and ionic transport properties of a sulfur electrode in a Li–S battery, as well as to study the charge transfer reaction and Li2S film generation at the electrode/electrolyte interface. The EIS spectra were collected as a function of electrode potential and the changes of that were verified very well by cyclic voltammetry. The EIS spectra exhibit two semicircles and an arc as the frequency decreases in the later discharge process. The high-frequency semicircle, the middle-frequency semicircle and the low-frequency arc were attributed to the Schottky contact reflecting the electronic properties of the material, the charge transfer step and the formation of Li2S respectively. Such results advance the viewpoints of previous EIS reports. Based on the experimental results and analysis in this study, a schematic model for the discharge process is proposed to explain the physical/chemical mechanism in the sulfur electrode.Conflicts of interest
There are no conflicts to declare.Acknowledgements
This work was supported by China Postdoctoral Science Foundation (2018M632616), Qingdao Postdoctoral Applied Research Project, National Natural Science Foundation of China (201805146) and Natural Science Foundation of Shandong Province (ZR201709240128).References
- M. Armand and J. M. Tarascon, Nature, 2008, 451, 652–657 CrossRef CAS PubMed.
- R. C. Xu, X. H. Xia, S. Z. Zhang, D. Xie, X. L. Wang and J. P. Tu, Electrochim. Acta, 2018, 284, 177–187 CrossRef CAS.
- Z. J. He, L. B. Tang, J. L. Wang, C. S. An, B. Xiao and C. J. Zheng, Ionics, 2018, 25, 9–15 CrossRef.
- X. X. Peng, Y. Q. Lu, L. L. Zhou, T. Sheng, S. Y. Shen, H. G. Liao, L. Huang, J. T. Li and S. G. Sun, Nano Energy, 2017, 32, 503–510 CrossRef CAS.
- J. Wang, C. M. Fu, X. F. Wang, Y. M. Yao, M. L. Sun, L. N. Wang and T. X. Liu, Electrochim. Acta, 2018, 292, 568–574 CrossRef CAS.
- D. Aurbach, E. Pollak, R. Elazari, G. Salitra, C. S. Kelley and J. Affinito, J. Electrochem. Soc., 2009, 156, A694–A702 CrossRef CAS.
- L. Xiao, Y. Cao, J. Xiao, B. M. Schwenzer, H. Engelhard, L. V. Saraf, Z. Nie, G. J. Exarhos and J. Liu, Adv. Mater., 2012, 24, 1176–1181 CrossRef CAS PubMed.
- Y. X. Yin, S. Xin, Y. G. Guo and L. J. Wan, Angew. Chem. Int. Ed., 2013, 52, 13186–13200 CrossRef CAS PubMed.
- Z. W. Seh, W. Li, J. J. Cha, G. Zheng, Y. Yang, M. T. McDowell, P. C. Hsu and Y. Cui, Nat. Commun., 2013, 4, 1331–1336 CrossRef PubMed.
- R. P. Fang, S. Y. Zhao, Z. H. Sun, D. W. Wang, H. M. Cheng and F. Li, Adv. Mater., 2017, 29, 1606823 CrossRef PubMed.
- X. Y. Qiu, Q. S. Hua, Z. Q. Dai, Z. M. Zheng, F. J. Wang and H. X. Zhang, Ionics, 2019 DOI:10.1007/s11581-019-03271-3.
- Q. C. Zhuang, X. Y. Qiu, S. D. Xu, Y. H. Qiang and S. G. Sun, Diagnosis of electrochemical impedance spectroscopy, Lithium Ion Battery – New Developments, InTech, 2012, ISBN 978-953-307-900-4 Search PubMed.
- X. G. Sun and S. Dai, J. Power Sources, 2010, 195, 4266–4271 CrossRef CAS.
- M. D. Levi, C. Wang and D. Aurbach, J. Electrochem. Soc., 2004, 151, A781–A790 CrossRef CAS.
- Q. C. Zhuang, T. Wei, L. L. Du, Y. L. Cui, L. Fang and S. G. Sun, J. Phys. Chem. C, 2010, 114, 8614–8621 CrossRef CAS.
- X. Y. Qiu, Q. C. Zhuang, Q. Q. Zhang, R. Cao, P. Z. Ying, Y. H. Qiang and S. G. Sun, Phys. Chem. Chem. Phys., 2012, 14, 2617–2630 RSC.
- X. Y. Qiu, Q. C. Zhuang, Q. Q. Zhang, R. Cao, Y. H. Qiang, P. Z. Ying and S. G. Sun, J. Electroanal. Chem., 2012, 687, 35–44 CrossRef CAS.
- Y. L. Shi, M. F. Shen, S. D. Xu, Q. C. Zhuang, L. Jiang and Y. H. Qiang, Solid State Ionics, 2012, 222–223, 23–30 CrossRef CAS.
- Y. L. Shi, M. F. Shen, S. D. Xu, X. Y. Qiu, L. Jiang, Y. H. Qiang, Q. C. Zhuang and S. G. Sun, Int. J. Electrochem. Sci., 2011, 6, 3399–3415 CAS.
- P. Z. Ying, X. Y. Qiu, Q. Q. Zhang and Q. C. Zhuang, Ionics, 2015, 21, 657–665 CrossRef CAS.
- K. Wu, J. Yang, X. Y. Qiu, J. M. Xu, Q. Q. Zhang, J. Jin and Q. C. Zhuang, Electrochim. Acta, 2013, 108, 841–851 CrossRef CAS.
- L. X. Yuan, X. P. Qiu, L. Q. Chen and W. T. Zhu, J. Power Sources, 2009, 189, 127–132 CrossRef CAS.
- V. S. Kolosnitsyn, E. V. Kuzmina, E. V. Karaseva and S. E. Mochalov, Russ. J. Electrochem., 2011, 47, 793–798 CrossRef CAS.
- C. Barchasz, J. C. Lepretre, F. Alloin and S. Patoux, J. Power Sources, 2012, 199, 322–330 CrossRef CAS.
- N. A. Canas, K. Hirose, B. Pascucci, N. Wagner, K. A. Friedrich and R. Hiesgen, Electrochim. Acta, 2013, 97, 42–51 CrossRef CAS.
- Z. F. Deng, Z. A. Zhang, Y. Q. Lai, J. Liu, J. Li and Y. X. Liu, J. Electrochem. Soc., 2013, 160, A553–A558 CrossRef CAS.
- M. He, L. X. Yuan, W. X. Zhang, X. L. Hu and Y. H. Huang, J. Phys. Chem. C, 2011, 115, 15703–15709 CrossRef CAS.
- E. Karden, S. Buller and R. W. De Doncker, J. Power Sources, 2000, 85, 72–78 CrossRef CAS.
- A. Martinent, B. L. Gorrec, C. Montella and R. Yazami, J. Power Sources, 2001, 97–98, 83–86 CrossRef CAS.
- J. Y. Song, H. H. Lee, Y. Y. Wang and C. C. Wan, J. Power Sources, 2002, 111, 255–267 CrossRef CAS.
- H. B. Ding, Q. F. Zhang, Z. M. Liu, J. Wang, R. F. Ma, L. Fan, T. Wang, J. G. Zhao, J. M. Ge, X. L. Lu, X. Z. Yu and B. G. Lu, Electrochim. Acta, 2018, 284, 314–320 CrossRef CAS.
- S. E. Cheon, K. S. Ko, J. H. Cho, S. W. Kim, E. Y. Chin and H. T. Kim, J. Electrochem. Soc., 2003, 150, A796–A799 CrossRef CAS.
- Y. V. Mikhaylik and J. R. Akridge, J. Electrochem. Soc., 2004, 151, A1969–A1976 CrossRef CAS.
- S. M. Sze, Physics of semiconductor devices, Wiley, New Jersey, 2nd edn, 1981 Search PubMed.
- E. H. Rhoderick and R. H. Williams, Metal-semiconductor contacts, Clarendon, Oxford, 1988 Search PubMed.
- H. C. Card and E. H. Roderick, J. Phys. D: Appl. Phys., 1971, 4, 1589–1601 CrossRef CAS.
| This journal is © The Royal Society of Chemistry 2020 |

