 Open Access Article
Enhanced chemical sensing for Cu2+ based on composites of ZIF-8 with small molecules†
Jun Zhang *,
Xiuyang Zhao,
Xuefeng Liu and
Chuan Dong
Institute of Environmental Science, Shanxi University, Taiyuan 030006, P. R. China. E-mail: dc104@sxu.edu.cn; Fax: +86-351-7011011
First published on 7th April 2020
Abstract
Two organic molecules, pyridoxal hydrazide (PAH) and salicylaldehyde based Rhodamine B hydrazone (RBS) were integrated into zeolitic imidazolate framework-8 (ZIF-8) to give composites, namely PAH/ZIF-8 and RBS/ZIF-8. The organic molecules and ZIF-8 are proposed to be assembled via hydrogen bonds and π–π stacking in the composites. The mass fraction of PAH and RBS in the composites was calculated to be 21.86% and 29.3%. The fluorescence of PAH/ZIF-8 is quenched regularly by Cu2+. The detection limit for Cu2+ was calculated to be 1.42 nM for PAH/ZIF-8, which is one order of magnitude lower than that of PAH. The detection limit for Cu2+ was determined to be 0.8 μM for RBS/ZIF-8, which is three times lower than that of RBS. The two composites both display high selectivity to Cu2+ over competing metal ions. The PAH/ZIF-8 fluorescent sensor was successfully applied to Cu2+ determination in environmental water. PAH/ZIF-8 exhibits excellent cell membrane permeability and low cytotoxicity in cellular imaging. The enhanced chemical sensor was designed by introducing small molecules into ZIF-8 for the specific recognition of Cu2+.
1 Introduction
As an essential component of proteins and enzymes in the cell, copper is of great importance to human health. Copper plays a key role in maintaining the health and normal operation of organs. The lack of copper leads to serious illnesses such as anemia, arterial abnormalities, brain disorders, and so on. In addition, excess copper may cause cirrhosis, diarrhea, motor disorders, and perceptual neurological disorders.1 Hence it is significant to efficiently and sensitively determinate Cu2+ to meet the biological and environmental requirements. Currently, many Cu2+ detection methods are available, such as atomic absorption, ion chromatography, and voltammetry. But these methods generally need expensive instruments, or large sample volumes, or special skills, or complicated procedures.2 In view of this, developing a simple and efficient chemosensor for Cu2+ offers extraordinary advantages.With a high specific surface area, good stability, and structural tunability, the porous zeolitic imidazolate framework-8 (ZIF-8) has been found practical applications in many fields,3,4 such as hydrogen storage,5 catalyzes,6–8 separation,9–11 adsorptions,12 and chemosensor.13,14 To achieve high sensitivity and selectivity, ZIF-8 was also used as the host of optical sensing materials for trace detection.15,16 The guests including GaN quantum dots,17 Au nanoclusters,18 Ag nanoclusters,19 and silicon dioxide20 was introduced into ZIF-8. For example, a BPEI-CQDs/ZIF-8 composite was reported that Cu2+ is not only selectively enriched by ZIF-8 but also specifically recognized by the carbon quantum dots of BPEI-CQDs. It is shown that the BPEI-CQDs/ZIF-8 is more sensitive to Cu2+ than BPEI-CQDs.21
Indeed, the ZIF-8-based sensing materials are constantly being challenged to provide excellent optical performance. The charge transfer between the metal and ligand, or among the ligands in ZIF-8 consequently weakens the specific recognition of analyte from parent ligands.22 In addition, the luminescent guest is basically confined to quantum dots or fluorescent protein. It should be noted that small organic molecules may offer significant advantages in photostability and cytotoxicity. It is of meaning to construct the ZIF-8 sensor has simultaneously the specific recognition from the guest molecule and the selective enrichment from ZIF-8. Pyridoxal and Rhodamine B are well-known platforms for the development of fluorescent or colorimetric chemosensors for metal ions.23–25 Herein, we propose using these two kinds of small molecules to assemble the ZIF-8 sensor for Cu2+ with excellent spectral properties, sensing efficiency and biocompatibility.
In this work, pyridoxal hydrazide (PAH) and salicylaldehyde based Rhodamine B hydrazone (RBS) were integrated with ZIF-8 to give composites of PAH/ZIF-8 and RBS/ZIF-8. The structure of the two composites was studied by various characterization techniques including 1H NMR, 13C NMR, Fourier transform infrared spectra (FTIR), X-ray diffraction (XRD), Scanning electron micrographs (SEM) and Brunauer–Emmett–Teller (BET) analysis. The Cu2+ sensing of PAH/ZIF-8 and RBS/ZIF-8 was investigated by fluorescence and UV-Vis spectroscopy. The pH conditions, Cu2+ selectivity, and cell imaging research, as well as the actual sample detection of the ZIF-8-based sensor were discussed.
2 Experimental
2.1 Apparatus and reagents
All chemicals and solvents used in the experiment are of analytical grade and bought from Sigma-Aldrich or Aladdin without further purification. The experimental water was secondary ultrapure water. Phosphate buffer saline (PBS) solutions at different pH were arranged by titrating 0.02 M phosphate solution with NaOH (1.0 M) and H3PO4 (1.0 M). Various metal-ion solutions with a concentration of 1.0 mM were formulated from chloride and nitrate salts of Ca2+, Mg2+, Al3+, Zn2+, Co2+, Fe3+, Cu2+, Hg2+, Cr3+, Mn2+, Pb2+, Ni2+, Ba2+, and Cd2+.The solution of Ag+ was prepared from its nitrate salt. The human hepatocellular carcinoma cell line (HepG2) was purchased from the Cell Bank of the Type Culture Collection (CAS, China).UV-Vis absorption spectra were obtained using a PerkinElmer Lambda 950 spectrophotometer. Fluorescence spectral data were recorded on a Varian Cary Eclipse Fluorescence Spectrophotometer (Palo Alto, CA, USA). Measurements were carried out at room temperature. A slit width of 10 nm was applied for both excitation and emission. Fluorescent images were taken on an FV1000 confocal laser scanning microscope (Olympus Co., Ltd. Japan). FTIR was recorded on a Bruker Tensor II FTIR spectrometer (Bremen, Germany). All NMR spectra were recorded on a Bruker Avance 600 MHz NMR spectrometer. Thermogravimetric analysis (TGA) was obtained from a TA Instruments Q50 thermal analyzer (New Castle, DE, U.S.A.) under a stream of nitrogen (N2) gas with a heating rate of 10 °C min−1. SEM was obtained using a field emission scanning electron microscope (JEOL JEM-7001F, Japan). The XRD patterns were recorded on a Bruker D8 Advance powder X-ray diffractometer (Bremen, Germany). N2 gas adsorption analysis was performed on the extracted monoliths using a Micromeritics ASAP 2000. The surface area was calculated using the BET equation.
2.2 Synthesis of ZIF-8
The improved hydrothermal method was employed.26 Zinc nitrate hexahydrate (0.298 g) and dimethylimidazole (0.246 g) were dissolved in methanol (15 mL). The two solutions were mixed and stirred for 5 minutes, and then the reaction was kept on at 80 °C for 24 h. After cooling to room temperature, the product was centrifuged and washed with methanol, and finally, vacuum dried at 100 °C for 24 h to give a white ZIF-8 solid powder.2.3 Synthesis of PAH27
Pyridoxal hydrochloride (0.41 g) and hydrazine hydrate (3 mL, 85%) were mixed in anhydrous ethanol (20 mL). The mixture was stirred at 80 °C for 8 h, then cooled to room temperature and crystallized. After precipitation, the product was filtered, washed and recrystallized. Finally, it was vacuum dried at 80 °C for 24 h to give a white pyridoxal hydrazide solid 0.26 g, yield 72%. 1H NMR (600 MHz, 25 °C, DMSO-d6): δ 2.34 (s, 3H), 4.52 (d, J = 5.2 Hz, 2H), 5.20 (s, 1H), 7.50 (s, 2H), 7.84 (s, 1H), 8.19 (s, 1H), 12.08 (s, 1H); 13C NMR (150 MHz, 25 °C, DMSO-d6): δ 150.28, 146.28, 138.99, 137.76, 130.87, 122.29, 59.31, 19.14 (Scheme 1).2.4 Synthesis of PAH/ZIF-8
ZIF-8 (0.40 g) and PAH (0.10 g) were mixed in anhydrous ethanol (30 mL) and then stirred at 40 °C for 48 h. After cooling to room temperature, the product was centrifugally washed with ethanol. By vacuum drying at 80 °C for 24 h, a yellow PAH/ZIF-8 solid was given.2.5 Synthesis of RBS
Rhodamine B (4.8 g) was dissolved in dichloromethane (20 mL), and then sulfoxide chloride (2 mL) is added. The mixture was refluxed and stirred for 8 h. The solvent was evaporated under reduced pressure. Then the product was dissolved with anhydrous ethanol (30 mL), and hydrazine hydrate (5 mL) was added. With stirring under reflux at 80 °C for 12 h, the product was filtered, washed and vacuum dried for 24 h. Then it was dissolved in 30 mL anhydrous ethanol, and 1.5 g salicylaldehyde was added. After 12 h of condensation and reflux at 80 °C, the product was cooled to room temperature. The crystallized product was filtered, washed and recrystallized by vacuum drying at 80 °C for 24 h to give RBS solid 0.39 g, yield 65%. 1H NMR (600 MHz, CDCl3, 25 °C): δ = 7.34–7.78 (m, 7H, Ph–H), 7.25 (d, 3H, JH–H = 7.2 Hz, Ph–H), 6.79 (t, 4H, JH–H = 8.4 Hz, Ph–H), 5.03 (s, 1H, OH–H), 3.39 (q, 8H, JH–H = 7.8 Hz, N–CH2CH3–H), 2.03 (s, 1H, NH–H), 1.15 (t, 12H, JH–H = 8.4 Hz, N–CH2CH3–H). 13C NMR (150 MHz, CDCl3, 25 °C): δ = 167.3, 165.8, 156.9, 156.7, 156.1, 148.6, 141.7, 141.3, 133.3132.4, 131.6129.0, 128.7, 128.5, 127.8, 126.1, 121.2, 120.7, 115.6, 106.7, 60.7, 47.8, 12.8 (Scheme 2).2.6 Synthesis of RBS/ZIF-8
ZIF-8 (0.40 g) and RBS (0.10 g) were added in anhydrous ethanol (30 mL) with stirring at 40 °C for 48 h. Then the solution was cooled to room temperature. The product was centrifugally washed by ethanol 4 or 5 times. After vacuum drying at 80 °C for 24 h, a yellow RBS/ZIF-8 solid was given.2.7 Optimization of synthesis conditions for PAH/ZIF-8
The fluorescence spectra of PAH at various concentrations were recorded. The regression equation of working curve was F = 8.96258 + 43.08766c, (R2 = 0.9959) (Fig. S1a†). The reaction of PAH and ZIF-8 were carried out under different conditions. The product was centrifugally washed until no fluorescence of PAH is detected in the washing ethanol. Then all the washing ethanol was collected to determine the amount of PAH with the fluorescence method. Consequently, the PAH mass in PAH/ZIF-8 was calculated to be the PAH mass difference between the washing ethanol and the reactant. In this way, the optimum reaction temperature was determined to be 40 °C, at which the PAH content in PAH/ZIF-8 is maximum (Fig. S1b†). Follow a similar route, the pH is optimized to be 7 and the reaction time was determined to be 48 h (Fig. S1c and d†).3 Results and discussions
3.1 Characterization of ZIF-8, PAH/ZIF-8, and RBS/ZIF-8
The SEM images show that ZIF-8, PAH/ZIF-8, and RBS/ZIF-8 particles are uniformly distributed with nearly spherical morphology (Fig. 1a–c). The size distribution of the three kinds of particles is consistent with Gaussian distribution (Fig. 1d–f). The average particle size of ZIF-8 is 75.1 ± 1.8 nm, which is smaller than the 81.2 ± 1.5 nm of PAH/ZIF-8 and the 92.8 ± 1.9 nm of RBS/ZIF-8. It suggests that ZIF-8 has been modified by PAH and RBS. The SEM images also show the presence of varying sizes of nanoparticles distributed homogeneously in the composites.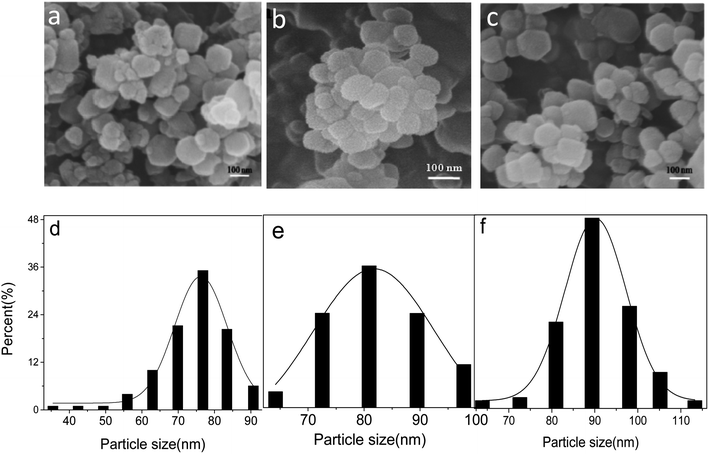 | ||
| Fig. 1 SEM images of ZIF-8 (a), PAH/ZIF-8 (b) and RBS/ZIF-8 (c); particle size distribution of ZIF-8 (d), PAH/ZIF-8 (e) and RBS/ZIF-8 (f). | ||
In the infrared spectra of ZIF-8, the absorption peak at 421 cm−1 is assigned to the stretching vibration of the Zn–N bond. For PAH and RBS, the absorption peaks between 3000 cm−1 and 3500 cm−1 are attributed to the stretching vibration of –OH and –NH2 (Fig. 2a). For PAH/ZIF-8 and RBS/ZIF-8, both the stretching vibration peaks of the Zn–N bond at 421 cm−1 and the stretching vibration peaks of –NH2 and –OH between 3000 cm−1 and 3500 cm−1 are observed. It indicates that PAH, RBS, and ZIF-8 are well incorporated in PAH/ZIF-8 and RBS/ZIF-8.
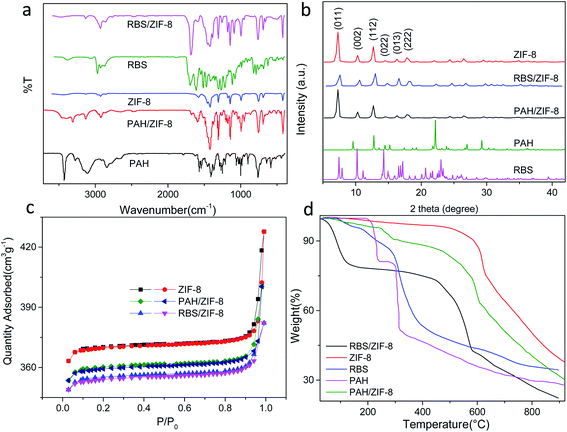 | ||
| Fig. 2 FT-IR spectra (a), PXRD patterns (b), N2 sorption isotherms (c), and TGA curves (d) of ZIF-8, PAH/ZIF-8, and RBS/ZIF-8. | ||
The powder XRD (PXRD) patterns show that the diffraction peaks of the as-prepared ZIF-8 are consistent with the characteristic peaks of ZIF-8, namely (011), (002), (112), (022), (013), (222) (Fig. 2b). It suggests the ZIF-8 is a pure phase with high crystallinity. In addition, no diffraction peaks of PAH and RBS were observed in the PXRD patterns of PAH/ZIF-8 and RBS/ZIF-8, which indicates the structure and integrity of ZIF-8 crystal are retained in PAH/ZIF-8 and RBS/ZIF-8.
The pore structure and the specific surface area of ZIF-8, PAH/ZIF-8 and RBS/ZIF-8 were characterized by the nitrogen adsorption and desorption isotherms (Fig. 2c). The three isotherms are shown the mixed type of I and IV type adsorption isotherm, indicating the microporous and mesoporous characteristics of the synthesized ZIF-8 materials. Comparing with that of ZIF-8, the saturated adsorption capacities of PAH/ZIF-8 and RBS/ZIF-8 are reduced in consequence of loading small molecules. In addition, PAH/ZIF-8 and RBS/ZIF-8 have decreased specific surface area and pore volume as well as increased average pore diameter than ZIF-8 (Table S1†).
ZIF-8 has a cavity with a diameter of 11.6 Å, and its hexagonal holes window is 3.3 Å wide, which is not static and can be expanded to 7.6 Å or greater. The length and width of the PAH molecule are about 8.65 Å and 6.58 Å by calculation. The approximate size of the RBS molecule is slightly larger than that of PAH. In view of this, most PAH and RBS cannot enter into the cavity of ZIF-8. However, the moiety of PAH and RBS is smaller than 3.4 Å. The adsorption on the surface of ZIF-8 or the part embedding process was possible because there is micropore and mesoporous that occurred in the texture formed by the accumulation of nanocrystals ZIF-8.
The TGA curves show that RBS and PAH are almost completely decomposed at 380 °C, while ZIF-8 is still thermally stable at 500 °C (Fig. 2d). Three distinct stages of weight loss are illustrated in the TGA curve of PAH/ZIF-8. The first stage occurs below 150 °C, which is attributed to the evaporation of water and solvent in the sample. The second stage is in the range of 150–380 °C. It is ascribed to the carbonization of the PAH complexed with ZIF-8. The third stage begins at 450 °C, wherein the organic ligands in ZIF-8 are decomposed and the crystal structure is collapsed. The weight loss of PAH in PAH/ZIF-8 was calculated to be 15.3%, and the residual amount of PAH is 30%. The total PAH content is calculated to be 21.86% in PAH/ZIF-8. Comparably, the PAH content in PAH/ZIF-8 was calculated to be 23.17% by the fluorescence method revealed in part 2.7. The two results are consistent with each other.
A similar process was observed in the TGA curves of RBS, ZIF-8 and RBS/ZIF-8. The weight loss of RBS in RBS/ZIF-8 is 18.2%, and the residual amount of RBS is 37.8% after decomposition. The total mass fraction of RBS in RBS/ZIF-8 is 29.3%.
3.2 The Cu2+ sensing of PAH and PAH/ZIF-8
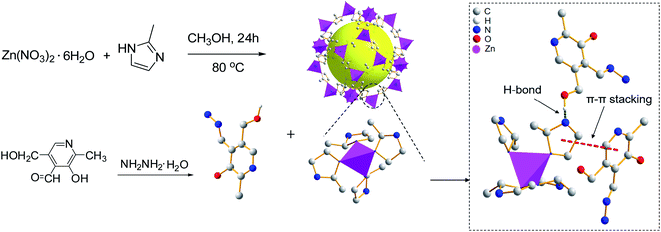
In the UV-Vis absorption spectrum, the maximum absorption of PAH and PAH/ZIF-8 is at 278 nm and 290 nm, respectively. In the fluorescence spectrum, the maximum emission of PAH and PAH/ZIF-8 is at 485 nm and 473 nm under the excitation of 356 nm and 354 nm, respectively. The fluorescence peak width of PAH/ZIF-8 is slightly narrow than that of PAH (Fig. S2†). These facts indicate that the spectral property of PAH was changed by the interaction of PAH with ZIF-8. In combination with the PXRD and spectral analysis results, it is deduced that the composite PAH/ZIF-8 is not a simple mechanical mixture of PAH and ZIF-8. More than two kinds of interaction may be responsible for the combination of PAH and ZIF-8. One is the hydrogen bonding between the –OH in PAH and the N in the imidazole of ZIF-8. The other is the π–π stacking between the imidazole ring of ZIF-8 and the pyridinium ring of PAH (Scheme 1).28–30Equal amounts of Cu2+ were added into the solution of PAH/ZIF-8 and PAH in the same fluorescence intensities respectively (Fig. S3†). Both the fluorescence intensities of PAH/ZIF-8 and PAH were decreased by the addition of Cu2+. The fluorescence quenching of PAH/ZIF-8 is more significant than that of PAH. The selective enrichment of Cu2+ by ZIF-8 may be account for this difference.
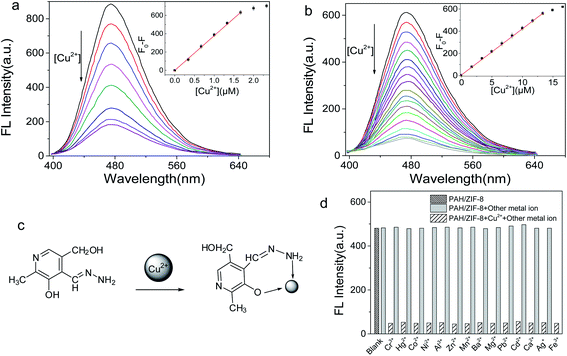
A PAH–Cu(II) complex is consequently formed (Fig. 3c) by the interaction of Cu2+ with PAH.27 In the pH range of 7–12, a notable fluorescence quenching of PAH and PAH/ZIF-8 was brought out by Cu2+. The fluorescence quenching of PAH/ZIF-8 was measured at 473 nm, and the maximum (F0 − F) was obtained at pH 10.0 (Fig. S4†). It is known that the precipitation of Cu(OH)2 is formed at a high pH. And it is reflected that PAH and Cu2+ have been complexed completely at pH 9.0. Given these facts, the followed study on the interaction between PAH/ZIF-8 and Cu2+ was performed at pH 9.0.
The interaction of Cu2+ with PAH/ZIF-8 and PAH was investigated by fluorescence quenching titration. With the increase of [Cu2+], the fluorescence intensity of PAH/ZIF-8 and PAH was gradually decreased (Fig. 3a). The fluorescence quenching degree (F0 − F) of PAH/ZIF-8 is linearly correlated with [Cu2+] in the range of 5 nM to 1.6 × 10³ nM, with the equation of F0 − F = 379.998c + 3.6147 (R2 = 0.9988). For the fluorescence quenching of PAH at 485 nm, the linear range is from 38.2 nM to 1.3 × 10⁴ nM with the equation of F0 − F = 41.91903c + 3.54003 (R2 = 0.99988) (Fig. 3b). Wherein, F0 and F are the fluorescence intensity of PAH/ZIF-8 and PAH in the absence or presence of Cu2+ respectively, c is [Cu2+].
The detection limit of the PAH/ZIF-8 (S/N = 3) for Cu2+ is found to be 1.42 nM, which is about one order of magnitude lower than that of PAH (11.45 nM). It is also much lower than the allowable concentrations of Cu2+ in drinking water (32 μM or 2 mg L−1) that specified by the World Health Organization.
The selectivity of PAH/ZIF-8 for Cu2+ was investigated against 14 kinds of metal ions. No significant fluorescence change of PAH/ZIF-8 was induced by the competing ions. But the fluorescence is intensely quenched by the subsequently added Cu2+ (Fig. 3d). In accordance with the rule of Irving–Williams, copper(II) has a particularly high thermodynamic affinity for typical N,O-chelate ligands and fast metal-to-ligand binding kinetics. Although the other metal ions also have the complex ability as well, which is not as strong as Cu2+, they only lead to the decreasing of fluorescence to a certain degree. Accordingly, PAH/ZIF-8 exhibits excellent selectivity for Cu2+.
The performances of the fluorescence sensor based on PAH/ZIF-8 were compared with some other Cu2+ sensors in Table 1. The resulting sensor showed some superiority. To sum up, the PAH/ZIF-8 not only maintains an excellent sensing selectivity derived from PAH but also strongly and selectively accumulate Cu2+ due to the adsorption property of ZIF-8. The selective accumulation effect of ZIF-8 greatly amplifies the sensing signal and the specificity of the PAH/ZIF-8 sensor.
| Fluorescent probes | Detection limit/nM | Linear range/nM | Ref. |
|---|---|---|---|
| ZIF-8@Rhodamine-B | 22.8 | 68.4–1.25 × 10⁵ | 25 |
| Carbon nano-dots (CNDs) | 170 | 0–3.5 × 10⁴ | 31 |
| Rhodamine-based derivative | 3.42 × 10³ | 10 × 103 to 3 × 10⁵ | 32 |
| SiO2@ZIF-8 | 3.8 | 10–500 | 33 |
| Molecular beacons@graphene oxide | 53.3 | 53.3–1.3 × 10³ | 34 |
| Fluorophore indolizine | 9.1 | 0–1× 10⁴ | 35 |
| PAH | 11.45 | 38.2–1.3 × 10⁴ | This work |
| PAH/ZIF-8 | 1.42 | 5–1.6 × 10³ | This work |
3.3 The Cu2+ sensing of RBS and RBS/ZIF-8
In the UV-Vis absorption spectra, the absorption maximum of RBS is at 238 nm. For RBS/ZIF-8, both the absorption peak at 238 nm and the maximum absorption at 209 nm is recorded (Fig. S5†). The spectral change suggests that RBS and ZIF-8 are chemically bonded in RBS/ZIF-8. It is proposed that at least two kinds of interactions are responsible for the combination. One is the π–π stacking between the benzene rings of RBS and the imidazole rings of ZIF-8. The other is the hydrogen bonds between the –OH of RBS and the imidazole N of ZIF-8.10,36In the pH range of 2–12, the absorption intensity of RBS/ZIF-8 at 238 nm is decreased by the same amount of Cu2+ (1.0 μM) (Fig. S4†). The maximum of the absorption decrease (A0 − A) was recorded at pH 7.0. Thereupon, the interaction between RBS/ZIF-8 and Cu2+ was optimally studied at pH 7.0.
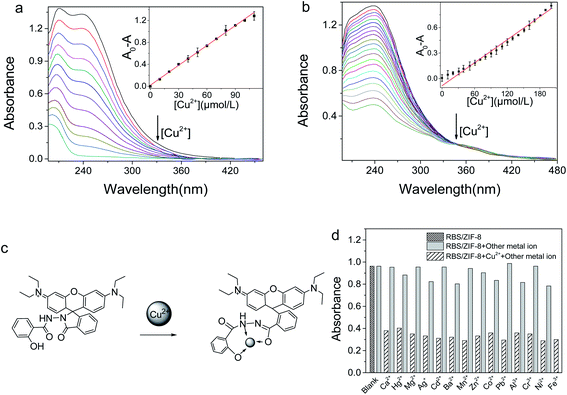
The UV-Vis absorption intensity of RBS/ZIF-8 is significantly decreased with the increase of [Cu2+] (Fig. 4a). This decrease is due to the formation of a Cu-RBS complex via opening the spirolactam ring of RBS (Fig. 4c).37 The linear correlation between the absorption variation of RBS/ZIF-8 (A0 − A) at 238 nm and [Cu2+] is derived in the range of 2.7–110 μM (inset Fig. 4a), with the equation of A0 − A = 0.012c + 0.024 (R2 = 0.9968). For RBS, the absorption variation was also measured at 238 nm. The linear range is 8.8–200 μM with the equation of A0 − A = 0.004c + 0.055 (R2 = 0.983) (Fig. 4b). Wherein A and A0 is the absorption intensity of RBS/ZIF-8 and RBS in the presence or absence of Cu2+, and c is [Cu2+].
The detection limit (S/N = 3) of RBS/ZIF-8 for Cu2+ is calculated to be 0.80 μM, which is three times lower than that of RBS (2.63 μM). And it is also much lower than the allowable [Cu2+] in drinking water. The UV-Vis absorption of RBS/ZIF-8 was basically unaffected by 14 kinds of competing metal ions except for Cu2+ (1.0 mM). A good selectivity of RBS/ZIF-8 for Cu2+ is illustrated in Fig. 4d. The performances of the colorimetric sensor based on RBS/ZIF-8 were compared with some other Cu2+ sensors in Table 2, demonstrating that the RBS/ZIF-8 sensing system exhibits superior sensitivity over previously reported sensing systems. The good performance of this sensor was ascribed to their extremely good selection of RBS to Cu2+ and the large specific adsorption of ZIF-8 for accumulating Cu2+.
| Colorimetric probes | Detection limit/μM | Linear range/μM | Ref. |
|---|---|---|---|
| Furfuraldehyde fluorescein hydrazone | 6.6 | 6.6–330 | 38 |
| 3-Bromo-5-methylsalicylaldehyde fluorescein hydrazone | 3.0 | 3.0–330 | 32 |
| 5-Nitrosalicylaldehyde fluorescein hydrazone | 1.89 | 1.89–25 | 39 |
| Pyridoxal-based fluorescein derivative | 0.14 | 0–15 | 40 |
| RBS | 2.63 | 8.8–200 | This work |
| RBS/ZIF-8 | 0.80 | 2.7–110 | This work |
It is noted that the loading amount of guests into ZIF-8 is subject to the size of the guest molecule. The detection limit of the analyte is closely related to the guest loading amount. Accordingly, the sensing efficiency of the guest-ZIF-8 sensor can be improved in ways, such as changing the aperture of ZIF-8, constructing ZIF-8 with penetrating structure and selecting the guest molecule in a suitable size.
3.4 Cell imaging
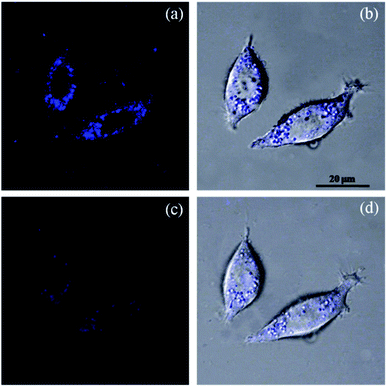
The new probe PAH/ZIF-8 showed a fluorescent response to Cu2+ in living cells at physiological pH. The optical window at the blue channel (400–500 nm) was selected as the signal output for fluorescence imaging. Human liver cancer HepG2 cells were incubated in PAH/ZIF-8 (5 mg mL−1) for 1 hour at 37 °C wherein PAH/ZIF-8 emitted blue fluorescence upon the excitation of 365 nm (Fig. 5a). Soon afterward, the PAH/ZIF-8-incubated HepG2 cells were additionally incubated with Cu2+ (10.0 mM) for 30 minutes at 37 °C. This time the fluorescence intensity of PAH/ZIF-8 in the HepG2 cells was observed to be significantly decreased by Cu2+ (Fig. 5c). The good cell membrane permeability of PAH/ZIF-8 is proved by this cell experiment. It suggests that PAH/ZIF-8 can be used as an efficient fluorescent probe for Cu2+ in living cells. Fig. 5b and d shows that the morphology of the cells keeps integral during the culture process. These results indicate that PAH/ZIF-8 is not only non-toxic but also biocompatible to cells. It allows the potential application of PAH/ZIF-8 in biomedicine.3.5 Determination of Cu2+ in environmental water
The standard working curve for the fluorescence intensity of PAH/ZIF-8 vs. Cu2+ was established. The tap water and the lake water were filtrated in pretreatment. The pH of samples was adjusted with PBS buffer (10 mM, pH = 9.0) in the determination. As shown in Table 3, Cu2+ was not detected in the lake water and the tap water. The recovery was in the range of 96.25–103.33% and RSD was in the range of 1.15–2.23% respectively, showing the high accuracy of the determination. In general, the PAH/ZIF-8-based fluorescence method is precise enough for the determination of Cu2+ in environmental water.| Sample | Cu2+ added (μM) | Cu2+ found (μM) | Recovery (%) | RSD (%) |
|---|---|---|---|---|
| Lake water | 0 | Undetected | — | — |
| 0.60 | 0.59 | 98.33 | 1.72 | |
| 0.80 | 0.81 | 101.25 | 2.23 | |
| Tap water | 0 | Undetected | — | — |
| 0.60 | 0.62 | 103.33 | 1.15 | |
| 0.80 | 0.77 | 96.25 | 1.38 |
4 Conclusions
Two ZIF-8 composites were designed and synthesized by integrating PAH and RBS into ZIF-8. The specific recognition of Cu2+ by PAH and RBS is retained in the composites, giving the two composite sensors good Cu2+ selectivity. The sensing signal is amplified due to the selective enrichment of Cu2+ by ZIF-8. The composite sensors have a lower detection limit for Cu2+ comparing to their parent organic molecules. The novel methods for the determination of Cu2+ was developed based on the composites with high sensitivity, selectivity, and low detection limits. In addition, PAH/ZIF-8 exhibits good cell membrane permeability and low cytotoxicity. The fluorescence spectroscopy based on PAH/ZIF-8 is applied to the determination of Cu2+ in environmental water. In conclusion, by introducing small sensing molecules into ZIF-8, the enhanced chemical sensing for Cu2+ was achieved, and the sensor with specific recognition of Cu2+ was targeted constructed based on ZIF-8.Conflicts of interest
There is no conflict to declare.Acknowledgements
This work was supported by grants from the National Natural Science Foundation of China (No. 21575084), the open funds of Guangxi Key Laboratory of Electrochemical Energy Materials (No. 2019-006).References
- P. Verwilst, K. Sunwoo and J. S. Kim, Chem. Commun., 2015, 51, 5556–5571 RSC.
- S. Zhan, H. Xu, W. Zhang, X. Zhan, Y. Wu, L. Wang and P. Zhou, Talanta, 2015, 142, 176–182 CrossRef CAS PubMed.
- T. D. Bennett and A. K. Cheetham, Acc. Chem. Res., 2014, 47, 1555–1562 CrossRef CAS PubMed.
- J. L. C. Rowsell and O. M. Yaghi, Microporous Mesoporous Mater., 2004, 73, 3–14 CrossRef CAS.
- M. P. Suh, H. J. Park, T. K. Prasad and D. W. Lim, Chem. Rev., 2012, 112, 782–835 CrossRef CAS PubMed.
- J. Lee, O. K. Farha, J. Roberts, K. A. Scheidt, S. T. Nguyen and J. T. Hupp, Chem. Soc. Rev., 2009, 38, 1450–1459 RSC.
- S. M. R. Chandra and M. Nath, Mater. Lett., 2016, 164, 571–574 CrossRef.
- M. Mon, R. Adam, J. Ferrando-Soria, A. Corma, D. Armentano, E. Pardo and A. Leyva-Pérez, ACS Catal., 2018, 8, 10401–10406 CrossRef CAS.
- J. R. Li, J. Sculley and H. C. Zhou, Chem. Rev., 2012, 112, 869–932 CrossRef CAS PubMed.
- X. Jiang, H. Y. Chen, L. L. Liu, L. G. Qiu and X. Jiang, J. Alloys Compd., 2015, 646, 1075–1082 CrossRef CAS.
- F. Tian, A. M. Mosier, A. Park, E. R. Webster, A. M. Cerro, R. S. Shine and L. Benz, J. Phys. Chem. C, 2015, 119, 15248–15253 CrossRef CAS.
- N. A. Khan, B. K. Jung, Z. Hasan and S. H. Jhung, J. Hazard. Mater., 2015, 282, 194–200 CrossRef CAS PubMed.
- L. E. Kreno, K. Leong, O. K. Farha, M. Allendorf, R. P. Van Duyne and J. T. Hupp, Chem. Rev., 2012, 112, 1105–1125 CrossRef CAS PubMed.
- J. W. Ye, S. Y. Liu, X. N. Cheng, R. B. Lin, X. L. Qi, J. P. Zhang and X. M. Chen, Chem. Mater., 2015, 27, 8255–8260 CrossRef CAS.
- T. T. Han, H. L. Bai, Y. Y. Liu and J. F. Ma, J. Solid State Chem., 2019, 269, 588–593 CrossRef CAS.
- X. Qiao, B. Su, C. Liu, Q. Song, D. Luo, G. Mo and T. Wang, Adv. Mater., 2018, 30, 1702275 CrossRef PubMed.
- D. Esken, S. Turner, C. Wiktor, S. B. Kalidindi, G. Van Tendeloo and R. A. Fischer, J. Am. Chem. Soc., 2011, 133, 16370–16373 CrossRef CAS PubMed.
- R. Bian, T. Wang, L. Zhang, L. Li and C. Wang, Biomater. Sci., 2015, 3, 1270–1278 RSC.
- D. Jonckheere, E. Coutino-Gonzalez, W. Baekelant, B. Bueken, H. Reinsch, I. Stassen, O. Fenwick, F. Richard, P. Samorì, R. Ameloot, J. Hofkens, M. B. J. Roeffaers and D. E. De Vos, J. Mater. Chem. C, 2016, 4, 4259–4268 RSC.
- X. Hu, X. Yan, M. Zhou and S. Komarneni, Microporous Mesoporous Mater., 2016, 219, 311–316 CrossRef CAS.
- X. M. Lin, G. M. Gao, L. Y. Zheng, Y. W. Chi and G. N. Chen, Anal. Chem., 2014, 86, 1223–1228 CrossRef CAS PubMed.
- Y. W. Cui, Y. Yue, G. D. Qian and B. L. Chen, Chem. Rev., 2012, 112, 1126–1162 CrossRef CAS PubMed.
- D. Rana, A. M. Rana and S. K. Sahoo, Chem. Sci. J., 2017, 8, 177 Search PubMed.
- D. Sharma, A. Kuba, R. Thomas, S. A. Kumar, A. Kuwar, H. J. Choi and S. K. Sahoo, Spectrochim. Acta, Part A, 2016, 157, 110–115 CrossRef CAS PubMed.
- N. Liu, J. Hao, L. Chen, Y. Song and L. Wang, Luminescence, 2019, 34, 193–199 CrossRef CAS PubMed.
- J. Q. Jiang, C. X. Yang and X. P. Yan, ACS Appl. Mater. Interfaces, 2013, 5, 9837–9842 CrossRef CAS PubMed.
- C. X. Yin, L. J. Qu and F. J. Huo, Chin. Chem. Lett., 2014, 25, 1230–1234 CrossRef CAS.
- A. Jamali, A. A. Tehrani, F. Shemirani and A. Morsali, Dalton Trans., 2016, 45, 9193–9200 RSC.
- E. M. Mahdi and J. C. Tan, J. Membr. Sci., 2016, 498, 276–290 CrossRef CAS.
- Y. Wang, S. Jin, Q. Wang, G. Lu, J. Jiang and D. Zhu, J. Chromatogr. A, 2013, 1291, 27–32 CrossRef CAS PubMed.
- W. Lu, Y. Gao, Y. Jiao, S. Shuang, C. Li and C. Dong, Nanoscale, 2017, 9, 11545–11552 RSC.
- Z. Xu, L. Zhang, R. Guo, T. Xiang, C. Wu, Z. Zheng and F. Yang, Sens. Actuators B Chem., 2011, 156, 546–552 CrossRef CAS.
- Y. Song, D. Hu, F. Liu, S. Chen and L. Wang, Analyst, 2015, 140, 623–629 RSC.
- J. Huang, Q. Zheng, J. Kim and Z. Li, Biosens. Bioelectron., 2013, 43, 379–383 CrossRef CAS PubMed.
- X. Zheng, R. Ji, X. Cao and Y. Ge, Anal. Chim. Acta, 2017, 978, 48–54 CrossRef CAS PubMed.
- Y. Wang, X. Dai, Y. Zhan, X. Ding, M. Wang and X. Wang, Int. J. Biol. Macromol., 2019, 137, 77–86 CrossRef CAS PubMed.
- Y. Liu, X. Lv, Y. Zhao, J. Liu, Y. Q. Sun, P. Wang and W. Guo, J. Mater. Chem., 2012, 22, 1747–1750 RSC.
- J. G. Zhang, L. Zhang, Y. L. Wei, J. Ma, S. Shuang, Z. Cai and C. Dong, Spectrochim. Acta, Part A, 2014, 122, 731–736 CrossRef CAS PubMed.
- Y. T. Yang, F. J. Huo, C. X. Yin, Y. Y. Chu, J. B. Chao, Y. B. Zhang, J. J. Zhang, S. D. Li, H. G. Lv, A. M. Zheng and D. S. Liu, Sens. Actuators B Chem., 2013, 177, 1189–1197 CrossRef CAS.
- F. L. Leite, A. Firmino, C. E. Borato, L. H. Mattoso, W. T. da Silva and O. N. Oliveira Jr, Synth. Met., 2009, 159, 2333–2337 CrossRef CAS.
Footnote |
| † Electronic supplementary information (ESI) available. See DOI: 10.1039/c9ra10695b |
| This journal is © The Royal Society of Chemistry 2020 |

