 Open Access Article
Revisiting the seed-assisted synthesis of zeolites without organic structure-directing agents: insights from the CHA case†
Grandprix T. M. Kadja *abc,
Iftitah R. Kadira,
Adroit T. N. Fajara,
Veinardi Suendoab and
Rino R. Mukti*abc
aDivision of Inorganic and Physical Chemistry, Institut Teknologi Bandung, Jl. Ganesha No. 10, Bandung, 40132, Indonesia. E-mail: kadja@chem.itb.ac.id; rino@chem.itb.ac.id; Tel: +62 22 2502104
bResearch Center for Nanosciences and Nanotechnology, Institut Teknologi Bandung, Jl. Ganesha No. 10, Bandung, 40132, Indonesia
cCenter for Catalysis and Reaction Engineering, Institut Teknologi Bandung, Jl. Ganesha No. 10, Bandung, 40132, Indonesia
First published on 3rd February 2020
Abstract
Herein, the crystallization behaviour of the CHA zeolite synthesized via the seed-assisted method and in the absence of an organic structure-directing agent has been revisited. To date, the working hypothesis of the seed-assisted synthesis method is that the parent gel and seed share the common composite building unit (cbu) of the targeted zeolite crystal. In the case of the CHA zeolite, we reveal that the parent gel in the absence of CHA seeds leads to the formation of the MER zeolite, which does not follow the cbu working hypothesis. It appears that smaller, but essential common units, i.e., 4-membered ring (4-MR) aluminosilicate, play a key role, instead of a larger cbu. The parent gel contains 4-MRs, which can grow into MER and/or CHA, depending on several factors, i.e. alkalinity, Si/Al ratio, synergistic effects of Na+ and K+, and the seeds. In this study, the CHA zeolite with an Si/Al ratio of up to 15 was selectively crystallized in the presence of CHA seeds at suitable alkalinity ((Na2O + K2O)/SiO2 < 0.4) with a fixed point at the tie line of Na2O/SiO2 = 0.3 with K2O/SiO2 = 0.1. Subsequently, the ternary phase diagram was drawn as high alkalinity with (Na2O + K2O)/H2O > 0.4 showing the formation of an MER zeolite, a thermodynamically more stable phase than the CHA zeolite, whereas low alkalinity with (Na2O + K2O)/SiO2 < 0.4 showed the less crystalline CHA zeolite or amorphous products with MER as a competing phase. The crystallization of the CHA zeolite was found to be strongly dependent on the synergistic effects of sodium and potassium ions. The former appears to organize the 4-MRs into essential double-six rings (d6rs), while the latter arranges the formed d6rs into cha cages. The seeds are partially dissolved and provide the outer surface for the crystal growth of CHA. We anticipate that these results may provide useful insight for understanding the crystallization of zeolites and stimulate versatile design in the synthesis of zeolites, particularly for the industrially demanding seed-assisted technique.
Introduction
The seed-assisted technique has opened a new horizon for the synthesis of many useful zeolites in the absence or with an enormous reduction in the amount of organic structure-directing agent (OSDA) via a simple, relatively low-cost and environmentally benign route. To date, many types of zeolites have been reported to be successfully synthesized through this technique, such as, *BEA,1–3 MFI,4,5 LEV,6,7 MTW,8–10 MSE,11,12 TON,13 MAZ14 and MTT.15 Moreover, this technique can also be applied to crystallize certain types of zeolites that have a different topology compared to the seeds.16–18 Furthermore, it is only limited to aluminosilicate zeolites, where the applicable scope of the seed-assisted technique has also been reported to realize the crystallization of other metallosilicate zeolites such as VET zincosilicate19 and RTH borosilicate20 zeolites.However, despite its significant progress, the chemistry of the seed-assisted synthesis of zeolites is not fully understood to date. Additionally, an established agreement on the general mechanism dictating the crystallization of zeolites has not been attained to date, even in the conventional synthesis of zeolite without the use of seeds. This may be due to the complexity of the occurring reactions, which sometimes lead to discrepancies among the reported results. Unlike the crystallization of common solids, which generally consists of two phases, i.e. the solid phase and the liquid phase, the crystallization of zeolites involves three distinct phases, the amorphous gel, the liquid phase, and the crystalline phase, which is the zeolite itself.21
Okubo and co-workers3,8–12,14,19,22 thoroughly investigated the crystallization of a series of zeolites using the seed-assisted technique. In most cases, the seeds underwent partial dissolution and new *BEA zeolites were grown on the surface of the seeds after they were exposed to the liquid phase. In parallel, Xie et al.23 also investigated the crystallization mechanism in the seed-assisted synthesis of the *BEA zeolite. They proposed that the crystallization occurs through the “core–shell” mechanism, in which the seeds act as the core and the amorphous aluminosilicates are crystallized and grown on the surface of the seeds.
In other cases, such as TON, the investigation carried out by Wang et al.24 showed that the seeds did not act as the core, rather, they were mostly dissolved, resulting in the formation of essential building units having the ability to orient the zeolite crystallization. This was supported by the fact that the resulting products possessed a significantly smaller size compared to that of the seeds. Similar results were also reported by Liu et al.25 for the seed-assisted synthesis of AlPO-5 (AFI topology) using ultrafast-heating in a continuous flow reactor. The use of 20 μm seeds resulted in 2 μm products, suggesting that crystallization started with the complete dissolution of the seeds. This insight is supported by the fact that the reuse of these 2 μm products led to the formation of ALPO-5 with a similar morphology and size distribution also around 2 μm. However, the detailed crystallization mechanisms were not further discussed in these reports.
The seed-assisted synthesis of zeolites has achieved remarkable progress, but detailed insight at the molecular level remains unclear. To solve this issue, Itabashi et al.22 reported a working hypothesis based on the structural similarities (composite building units/cbu) between the targeted zeolites, the seed zeolites, and the unseeded gels. For example, for the synthesis of *BEA zeolites from *BEA seeds, unseeded gels are required, which, if crystallize, result in the MOR zeolite. *BEA has cbu of mor, bea, and mtw, while MOR has one cbu, i.e. mor. Thus, mor is believed to be the common building unit between *BEA and MOR. This working hypothesis can also be extended and applied to the synthesis of target zeolites with different structures from the seeds, but it is still believed to share a common structure with the gels. The synthesis of MTW was successful using MFI gels and *BEA seeds.22 MTW itself possesses building units of bik, jbw, mtw, and cas, which share the common building unit with MFI (cas) and *BEA (mtw). However, although these results are interesting and encouraging, other concerns still exist. For example, in the latter case, gels and seeds supply two of the four building units. It is not clear the roles of the other building units, which are not provided by the gels or seeds. Also, it unclear what are the structural similarities.
In an effort to resolve these concerns, we performed a detailed investigation on the seed-assisted synthesis of the CHA zeolite in the complete absence of OSDAs. CHA was selected since it comprises a simple, yet unique structure composed of two types of building units, which are the cha cage and double six-membered ring (d6r). Moreover, the CHA zeolite is of industrial interest as a small pore zeolite due to its superiority in the particular fields of adsorption,26,27 separation28,29 and catalysis.30,31 To the best of our knowledge, only one publication regarding the seed-assisted synthesis of CHA zeolite has been reported by Imai et al.32 However, no detailed characterizations have been reported thus far, particularly at the atomistic level using spectroscopic techniques such as Raman and solid-state NMR spectroscopy. These structural elucidations were required to further determine the absolute crystalline boundary out of the ternary phase diagram and understand the comparative topology in the absence of seed and/or parent gel. Notably, the crystallization profile during the synthesis was, unfortunately, not clarified; notwithstanding the striking impacts of the seeds.
Herein, we thoroughly study the seed-assisted synthesis of the CHA zeolite to clarify the determining factors that govern the crystallization of the CHA zeolite and systematically rule out the proposed working hypothesis of a common building unit for the crystallization of zeolites in the absence of OSDA. This detailed investigation is anticipated to provide a clearer understanding of the “big picture” of this industrially demanding zeolite synthetic method.
Experimental
Synthesis of CHA seeds through interzeolite conversion
CHA-type seeds were synthesized via the interzeolite conversion of an FAU-type zeolite. The detailed procedure for the synthesis of the FAU-type zeolite can be found elsewhere.33 In a typical synthesis of seeds, 1.6 g of FAU was mixed with 15.84 g of a solution having a molar composition of 0.0128K2O![[thin space (1/6-em)]](https://www.rsc.org/images/entities/char_2009.gif) :
:![[thin space (1/6-em)]](https://www.rsc.org/images/entities/char_2009.gif) 1H2O, which was previously prepared in a PP bottle using deionized water and KOH (47 wt%, Merck), and vigorously stirred for 30 min. The PP bottle containing the mixture was subsequently transferred to a preheated oven at 95 °C for 96 h. The obtained product was filtered, washed and dried at 90 °C overnight. The XRD and SEM images of the seeds are shown in Fig. S1.†
1H2O, which was previously prepared in a PP bottle using deionized water and KOH (47 wt%, Merck), and vigorously stirred for 30 min. The PP bottle containing the mixture was subsequently transferred to a preheated oven at 95 °C for 96 h. The obtained product was filtered, washed and dried at 90 °C overnight. The XRD and SEM images of the seeds are shown in Fig. S1.†
Seed-assisted synthesis of CHA-type zeolite
The initial mixture was prepared with the following molar composition, 1SiO2![[thin space (1/6-em)]](https://www.rsc.org/images/entities/char_2009.gif) :
:![[thin space (1/6-em)]](https://www.rsc.org/images/entities/char_2009.gif) 0.05Al2O3
0.05Al2O3![[thin space (1/6-em)]](https://www.rsc.org/images/entities/char_2009.gif) :
:![[thin space (1/6-em)]](https://www.rsc.org/images/entities/char_2009.gif) 0.1–0.4Na2O
0.1–0.4Na2O![[thin space (1/6-em)]](https://www.rsc.org/images/entities/char_2009.gif) :
:![[thin space (1/6-em)]](https://www.rsc.org/images/entities/char_2009.gif) 0–0.4K2O
0–0.4K2O![[thin space (1/6-em)]](https://www.rsc.org/images/entities/char_2009.gif) :
:![[thin space (1/6-em)]](https://www.rsc.org/images/entities/char_2009.gif) 100H2O. In a typical preparation, sodium aluminate (Sigma-Aldrich), NaOH (50 wt%, Merck) and KOH (47 wt%, Merck) were dissolved using deionized water as the solvent in a PP bottle. Subsequently, Ludox HS-40 (colloidal silica, Sigma-Aldrich) and the seeds were slowly and simultaneously added to the above solution under stirring to obtain a homogenous mixture. The final mixture was transferred to a Teflon-sealed autoclave and subjected to hydrothermal treatment in a preheated oven at 170 °C for various periods. The obtained products were filtered, washed and dried at 60 °C overnight. The solid yield was calculated by comparing the weight of the obtained products with that of the initial mixture excluding water.
100H2O. In a typical preparation, sodium aluminate (Sigma-Aldrich), NaOH (50 wt%, Merck) and KOH (47 wt%, Merck) were dissolved using deionized water as the solvent in a PP bottle. Subsequently, Ludox HS-40 (colloidal silica, Sigma-Aldrich) and the seeds were slowly and simultaneously added to the above solution under stirring to obtain a homogenous mixture. The final mixture was transferred to a Teflon-sealed autoclave and subjected to hydrothermal treatment in a preheated oven at 170 °C for various periods. The obtained products were filtered, washed and dried at 60 °C overnight. The solid yield was calculated by comparing the weight of the obtained products with that of the initial mixture excluding water.
The products were also used as seeds in the successive seed-assisted synthesis using the same procedure described above.
Characterization
Powder X-ray diffraction (XRD) measurements were performed on a Bruker D8 Advance diffractometer using a Cu-Kα incident beam, filtered by nickel, with a wavelength (λ) of 1.5418 Å. The crystallinity of the samples was calculated by integrating the area of the five major peaks from 2θ = 19.5–38° and comparing the total area with the sample having the highest total area, assuming 100% crystallinity.34 The lattice parameters were calculated with the Le Bail method using the Rietica v4.2 software package.35 The crystallography data of the CHA zeolite was obtained from the International Zeolite Association (IZA) database.36Attenuated total reflectance-infrared (ATR-IR) spectra were measured on a Bruker Alpha spectrometer with a spectral resolution of 4 cm−1 at room temperature. Zinc selenide (ZnSe) crystals were used as the ATR prism.
Raman spectra were recorded on a Bruker Senterra spectrometer using 532 nm laser excitation and a power output of 20 mW. All spectra were measured at room temperature with a spectral resolution of 4 cm−1.
N2 adsorption–desorption isotherms were measured at 77 K on a Quantachrome Autosorb iQ-MP instrument. Prior to the measurement, each sample was treated under vacuum at 300 °C for 6 h. The Brunauer–Emmet–Teller (BET) and t-plot methods were applied to calculate the specific surface area (SBET) and the micropore volume (Vmicro), respectively. The total pore volume (Vtot) was determined at the relative pressure, P/P0 ≅ 0.99.
Scanning electron microscopy (SEM) images were obtained on a Hitachi SU-3500 microscope using an accelerating voltage of 15 kV.
29Si and 27Al magic angle spinning nuclear magnetic resonance (MAS NMR) spectra were recorded on an Agilent DD2 500 MHz spectrometer at resonance frequencies of 99.31 and 130.28 MHz, respectively. The measurement was performed at a spinning rate of 9 kHz with a pulse width of 1.0 μs. The scans were added with a 5 s recycle delay. The 29Si and 27Al MAS NMR spectra are reported relative to tetramethylsilane (TMS) using tetrakis(trimethylsilyl)silane (TTMSS) (−9.85 ppm from TMS) as the external reference and aluminum nitrate, respectively. The Si/Al ratios in the framework were calculated using equation below,
 | (1) |
X-ray fluorescence (XRF) analysis was performed on a PANalytical Axios mAX spectrometer to determine the chemical composition of the products.
Results and discussion
Factors governing the crystallization
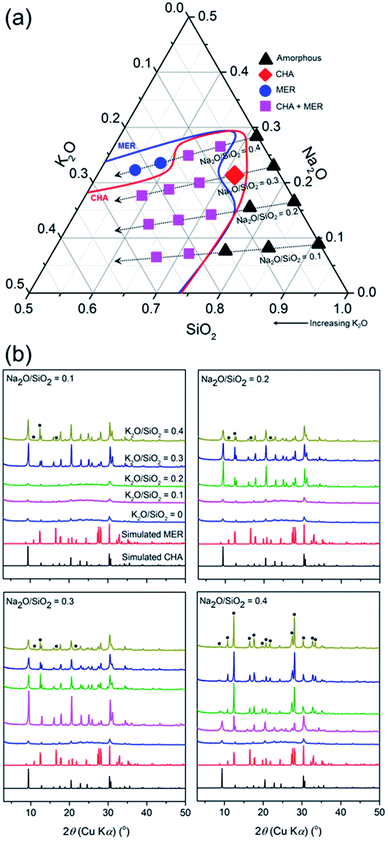
In this section, we discuss the crystallization in the seed-assisted synthesis of the CHA zeolite as a function of inorganic cations and alkalinity. Fig. 1 shows the mapping of the synthesis compositions of the CHA zeolites in a ternary phase diagram. Two crystalline phases are observed, i.e. MER and CHA zeolites, either in mixed or pure forms, together with the amorphous form. The diagram is classified into four tie lines based on the Na2O/SiO2 ratio. As can be seen in Fig. 1a, each line shows transformations from amorphous to crystalline phases as the K2O/SiO2 ratio increases. These transformations are more clearly observed in the line of Na2O/SiO2 = 0.3 and 0.4, which include the following stages, amorphous → CHA → (CHA + MER) and amorphous → (CHA + MER) → MER, respectively.The observed transformations should be related to the effect of alkalinity. This is due to the kinetics of the zeolite crystallization, which can be explained by the Ostwald rule of stages, whereby the thermodynamically metastable phase is initially formed and progressively transformed into a more stable phase through a series of recrystallizations. At higher alkalinity, the solubility of the silica and alumina sources increases, resulting in a reduction of the degree of polymerization of the silicate anions and accelerated polymerization of the poly(alumino)silicate anions. Note that the fundamentals of zeolite crystallization are the breaking (hydrolysis) and formation (condensation) of T–O–T bonds catalyzed by hydroxyl ions, as described by the following reactions,
![[triple bond, length as m-dash]](https://www.rsc.org/images/entities/char_e002.gif) T–O–T T–O–T![[triple bond, length as m-dash]](https://www.rsc.org/images/entities/char_e002.gif) + OH− → + OH− → ![[triple bond, length as m-dash]](https://www.rsc.org/images/entities/char_e002.gif) T–O− + HO–T T–O− + HO–T![[triple bond, length as m-dash]](https://www.rsc.org/images/entities/char_e002.gif)
| (2) |
![[triple bond, length as m-dash]](https://www.rsc.org/images/entities/char_e002.gif) T–OH + OH− → T–OH + OH− → ![[triple bond, length as m-dash]](https://www.rsc.org/images/entities/char_e002.gif) T–O− + H2O T–O− + H2O
| (3) |
![[triple bond, length as m-dash]](https://www.rsc.org/images/entities/char_e002.gif) T–O− + HO–T T–O− + HO–T![[triple bond, length as m-dash]](https://www.rsc.org/images/entities/char_e002.gif) → → ![[triple bond, length as m-dash]](https://www.rsc.org/images/entities/char_e002.gif) T–O–T T–O–T![[triple bond, length as m-dash]](https://www.rsc.org/images/entities/char_e002.gif) + OH− + OH−
| (4) |
Consequently, the overall crystallization of the zeolite is speeded up. Our results suggest that the higher alkalinity contributes to the crystallization from amorphous gel to the MER zeolite, which possesses a higher framework density (16.4 T) compared to that of the CHA zeolite (15.1 T), and is, therefore, the more thermodynamically stable phase, following the Ostwald rule of stages. Conversely, amorphous products were obtained at low alkalinity ((K2O + Na2O)/SiO2 < 0.4), showing incomplete crystallization since the breaking and formation of the T–O–T bonds proceeded much slower.
MER was obtained as the sole product at the tie line of Na2O/SiO2 = 0.4 with K2O/SiO2 = 0.3 and 0.4. The disappearance of the CHA phase shows that the CHA seeds were dissolved during the hydrothermal treatment. Moreover, the XRD patterns of the products synthesized at the line of Na2O/SiO2 = 0.4 with K2O/SiO2 = 0.4 without the presence of CHA seeds still exhibit MER reflections, showing that the amorphous gel was crystallized into the MER phase (Fig. S2†). Interestingly, these XRD patterns exhibit less intense reflections, showing that the MER products possess a less crystalline nature compared to that in the presence of CHA seeds. This may have resulted from the dissolution of the seeds, which resulted in the building units of CHA. These building units may have been excessively hydrolyzed due to the very high alkalinity, and subsequently directed to form the MER structure. Therefore, it appears that the dissolved CHA seeds may accelerate the crystallization of the MER phase. Even though CHA and MER do not share common composite building units (cbu), which was hypothesized by Itabashi et al.22 to be a prerequisite for phase transformation, they both have an essential (alumino)silicate ring, such as 4-MR, which may play role in the formation of MER from the CHA phase. The transformation, in which the sharing of a common cbu is not involved, has been previously demonstrated in several systems, such as FAU-to-GIS, GIS-to-ANA and SOD-to-CAN.37
In the area in which the mixed products of CHA and MER are formed, the partial dissolution of seeds is indicated, considering the line broadening of the (100) plane peak at 2θ of 9.40° with an increase in the K2O/SiO2 ratio (Fig. 1b). This suggests a reduction in the size of the CHA crystallites, as explained by the Scherrer equation. The SEM image of the selected sample crystallized at the line of Na2O/SiO2 = 0.1 with K2O/SiO2 = 0.3 shows the distinct morphologies of CHA and MER (Fig. S3†). CHA is shown as smaller crystal-like facets, while the MER zeolite exhibited the typical elongated hexagonal-prismatic morphology. A further decrease in alkalinity did not result in any crystalline phase, but amorphous products. In addition to alkalinity, the formation of MER should also be related to the directing nature of the inorganic cations, in particular K+. It was previously reported by Skofteland et al.38 that K+ favors the crystallization of the MER structure from the amorphous gel since it perfectly fits into the buckled 8-MR, which is essential for the formation of the t-pau cage, the MER natural building units. This specifically occurs at a high K+ concentration and alkalinity, which agrees with our results.
Ultimately, the pure CHA phase was obtained at a single point, in the tie line of Na2O/SiO2 = 0.3 with K2O/SiO2 = 0.1. A further increase in the amount of K2O at fixed alkalinity, which is (Na2O + K2O)/SiO2 ratio = 0.4 as the pure CHA single point, led to the formation of the MER zeolite as the competing phase. The exclusion of K+ (Na2O/SiO2 = 0.4) did not result in the formation of any crystalline phase, but amorphous products, showing the inevitable role of the synergy between Na+ and K+ for directing the crystallization of the pure CHA phase, in addition to alkalinity.
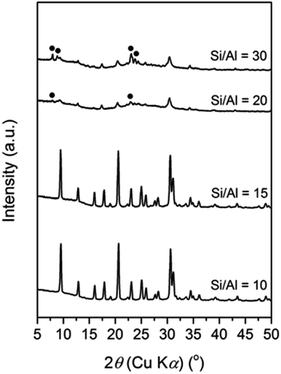
At this single point, the Si/Al ratio in the initial mixture also plays a significant role, as seen in Fig. 2. A pure CHA phase could still be obtained at an Si/Al ratio of 15. However, increasing the Si/Al to 20 resulted in amorphous phase as the major product with the presence of CHA from the seeds and MFI zeolite (18.4 T), which is denser than CHA. The latter intensity increases when the Si/Al ratio is further increased to 30. The formation of MFI in the absence of its typical OSDA, i.e. tetrapropylammonium (TPA+), has been previously reported by Kim et al.39 They found that Na+ plays the role of a structure-directing agent of the MFI phase in an initial mixture with a higher Si/Al ratio of around 30 to 80. In their report, at a fixed amount of Na+ (Na2O/SiO2 = 0.115), a less-dense phase, MOR zeolite was formed when the Si/Al ratio in the initial mixture was below 30, while a denser phase, keatite, co-existed in a trace amount in addition to MFI zeolite as the major phase when the Si/Al ratio increased above 80.
Based on our results and the previous literature, we suggest that the Al content within the initial gels controls the structure-directing role of the inorganic cations. It should be recalled that inorganic cations also serve as charge balancing agents for tetrahedrally coordinated Al in aluminosilicate species, which are negatively charged. A higher amount of Al in the aluminosilicate species results in more cations present in the framework, leading to a less-dense structure since the cations occupy spaces, which should be filled by T–O–T bonds. Conversely, a denser structure is formed due to the shortage of cations in less aluminous frameworks.
Evolution in the seed-assisted synthesis of CHA-type zeolite
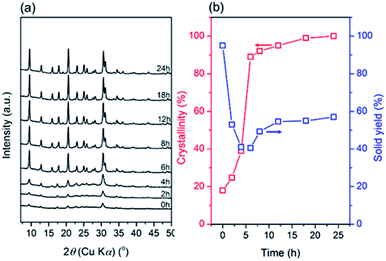
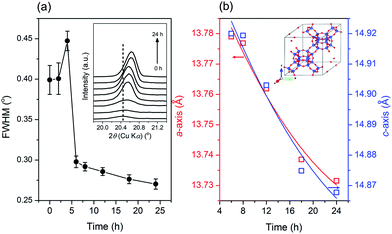
For a clearer understanding of the seed-synthesis of CHA, the evolution of the synthesized products was monitored ex situ using an array of characterization techniques. Fig. 3 depicts the XRD patterns, crystallinity and solid yield profiles of the products obtained at different periods. The appearance of the CHA zeolite peaks shows that the seeds were preserved during the hydrothermal synthesis. It should also be noted that all the peaks are assigned to CHA zeolite without the presence of any other crystalline phases. Upon hydrothermal treatment from 0 to 4 h, the crystallinity increased for around 20% but the solid yield dropped more sharply (ca. 55%), showing the dissolution of the amorphous solid gel. Interestingly, the solid yield from 4 to 6 h remained constant, albeit with a sharp increase in crystallinity (Fig. 3b). This indicates that the dissolution of the amorphous phase and the formation of crystals from the liquid phase reached a balance.Moreover, crystallization still occurred from 6 to 24 h, albeit a modest increase of crystallinity was observed. During this period, the trend in solid yield slightly increased, similar to the trend of crystallinity. In addition, the crystallite size appears to follow a similar trend, as shown by the plot of the full width at half-maximum (FWHM) of the (20![[1 with combining macron]](https://www.rsc.org/images/entities/char_0031_0304.gif) ) plane reflections versus synthesis time in Fig. 4a. From 0 to 4 h, the FWHM slightly increased, indicating the partial dissolution of the seeds. Subsequently, the FWHM decreased dramatically from 4 to 6 h, showing rapid crystal growth followed by slower growth from 6 to 24 h, as indicated by the less steep decline in the FWHM.
) plane reflections versus synthesis time in Fig. 4a. From 0 to 4 h, the FWHM slightly increased, indicating the partial dissolution of the seeds. Subsequently, the FWHM decreased dramatically from 4 to 6 h, showing rapid crystal growth followed by slower growth from 6 to 24 h, as indicated by the less steep decline in the FWHM.
Notably, from 6 to 24 h, the XRD peaks gradually shifted to higher 2θ values, which indicates an alteration in the lattice parameters of the CHA zeolite. Fig. 4b depicts the plots of the lattice parameters of the products obtained from 6 to 24 h calculated from the whole pattern fitting using the Le-Bail method (Fig. S4†). As seen, the length of the a- and c-axis decreased with a prolonged synthesis time. The contraction in the unit cell is due to the incorporation of more Si–O bonds within the CHA zeolite framework since they possess a shorter length than that of the Al–O bond. Note that the SiO2/Al2O3 ratio in the synthesis mixture is higher than that in the seeds. Moreover, the contraction of the a- and c-axis has a similar rate, which indicates that the crystal growth occurs in all directions without preference.
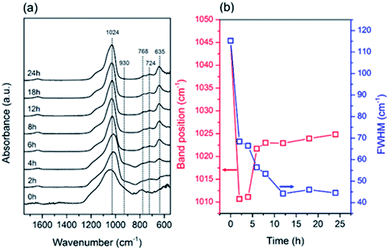
The structural evolution during the seed synthesis of the CHA zeolite was further investigated using vibrational spectroscopic studies, i.e. ATR-IR and Raman spectroscopy. Fig. 5a shows the ATR-IR spectra of the products obtained at different periods. Information on the T–O bond vibration is located in the mid-infrared region, around 1400–400 cm−1, while the small band at around 1640 cm−1 is associated with the adsorbed water bending vibrations.40 The main band at around 1024 cm−1 corresponds to the asymmetric stretching vibration (vas) of the T–O bonds. Fig. 5b depicts the evolution of the position and FWHM of this band during the synthesis. Fichtner-Schmittler et al.41 previously reported an empirical calculation, which showed a linear relationship between the vas(T–O) band position and Si/Al ratio. As seen in Fig. 5, from 0 to 4 h the vas(T–O) band underwent a dramatic redshift due to the dissolution of the amorphous gel. Furthermore, the sudden blueshift from 4 to 6 h suggests the incorporation of more Si–O bonds, which possess a shorter bond length, within the solid products. After 6 h, the blueshift still occurred, albeit at a slower rate. These results are consistent with the crystallinity and unit cell contraction trends obtained from the XRD data.
The values of FWHM show the order of the T–O bonds within the products. Upon prolonged hydrothermal treatment, the FWHM progressively decreased owing to the formation ordered T–O–T networks. Moreover, the gradual disappearance of the band at around 930 cm−1,40 which is attributed to the T–O in-plane stretching vibrations of the T–OH bonds, also indicates the formation of ordered T–O–T networks through the condensation reaction. In addition, the bands located in the region of the pseudo-lattice vibrations, around 400–800 cm−1, are assigned to the ring vibration within the zeolite frameworks.42 The appearance of the two bands at 768 and 724 cm−1 corresponds to 4-MR, while the d6r building units are shown by the band at 635 cm−1.42–45 These three bands are typical for the CHA zeolite. The notable appearance of a band at 635 cm−1 from 4 to 6 h suggests the structural rearrangement towards the formation of d6rs.
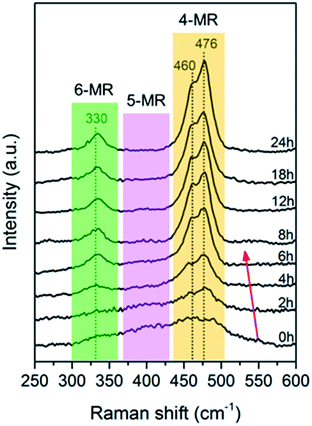
The Raman spectral region of 250–600 cm−1 is specific for the bending vibration mode of ring silicates and beneficial for kinetic studies.46,47 As seen in Fig. 6, the samples at 0 h showed broad bands in the range of 300 to 500 cm−1 due to the dominant presence of 4-, 5- and 6-MR within the amorphous phase.12,48,49 Upon hydrothermal treatment, the 5-MR band gradually disappeared due to its dissolution and structural alteration. From 0 to 6 h, a redshift and sharpening were observed for the 4-MR band concomitantly with the progressive intensification of the 6-MR band, suggesting that the formed 4-MRs are arranged into more ordered structures, which should be the d6r building units. These observations in the Raman spectra are consistent with that observed in the ATR-IR spectra.
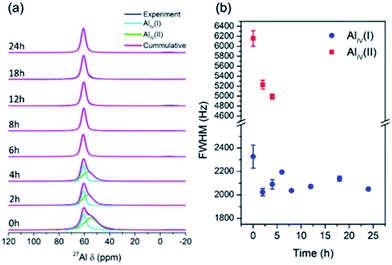
The structural alteration of aluminosilicate at the atomic scale was investigated using solid-state 27Al and 29Si MAS NMR. Fig. 7a depicts the 27Al MAS NMR spectra of the products obtained at different times. As seen, none of the spectra exhibit a band at 0 ppm, showing the absence of six-coordinated aluminum species. There is only one band at around 50–60 ppm, which corresponds to four-coordinated aluminum species. It appears that the aluminum sources dissolved and reacted with silicates to form aluminosilicates, which contain four-coordinated aluminum, even in the sample obtained at 0 h, without hydrothermal treatment. Moreover, the samples obtained from 0 to 4 h exhibited broad signals, which can be divided into two bands, i.e. AlIV(I) and AlIV(II), which presumably originated from the seeds and solid gels, respectively. The full width at half-maximum (FWHM) of AlIV(I) gradually decreased from 0 to 4 h, indicating structural alteration towards a more ordered environment (Fig. 7b). After 6 h, only one band appeared, which is AlIV(II) with a nearly constant FWHM, since highly crystalline CHA zeolite was obtained. It should be noted that 27Al is a quadrupolar nuclide in which its peak position and width depend on the external magnetic field, leading to difficulty in deconvoluting its peaks, especially in a low external magnetic field. The resulting band should be fitted with precaution since it cannot be simply divided into symmetrical bands. However, deconvolution still provides a certain significance for qualitative analysis. Accordingly, quantitative, more detailed information can be obtained using a more advanced method, such as multiple-quantum magic-angle spinning (MQMAS).
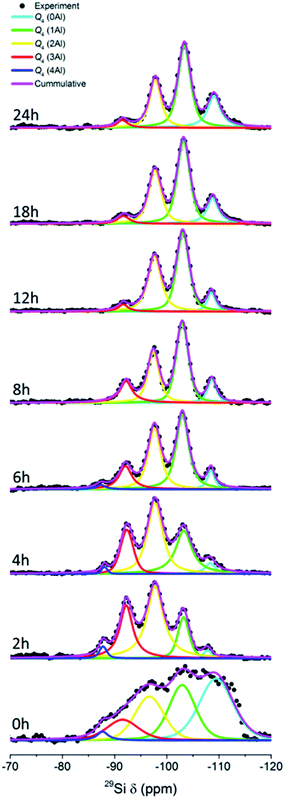
Fig. 8 depicts the 27Si MAS NMR spectra of the products obtained at different times. Five bands can be identified, which are Q4(0Al) ((SiO)4Si), Q4(1Al) ((SiO)3(AlO)Si), Q4(2Al) ((SiO)2(AlO)2Si), Q4(3Al) ((SiO) (AlO)3Si) and Q4(4Al) ((AlO)4Si) silicon species located at around −109, −103, −98, −92, and −88 ppm, respectively. As can be seen, the sample at 0 h exhibits a broad feature due to the dominance of the amorphous parts. After 2 h, the bands become more visible due to the dissolution and structural alteration of the amorphous parts. It can be clearly seen that with prolonged time, the Q4(4Al), Q4(3Al) and Q4(2Al) bands become diminished with a gradual increase in the Q4(1Al) and Q4(0Al) bands. The Q4(4Al) band even disappears after 8 h of hydrothermal treatment. These observations show that more Si–O bonds were formed within the frameworks of the products, supporting the results from XRD and ATR-IR spectroscopy.
The calculated Si/Al framework ratio of the products obtained at different periods of time is plotted in Fig. 9. From 0 to 2 h, there is a dramatic decrease in the Si/Al ratio within the products, which should be attributed to the dissolution of the solid gels and, probably, the seeds. It should be noted that the significant error in the sample obtained at 0 h may be owing to the interference from the Q3 ((TO)3(OH)Si) or Q2 ((TO)2(OH)2Si) signal since it contains abundant silanol groups, as also indicated in ATR-IR spectra.
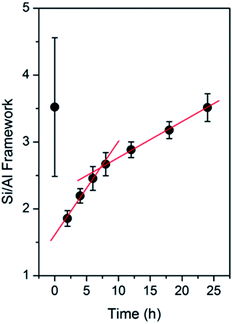 | ||
| Fig. 9 Si/Al framework ratio derived from the 29Si MAS NMR spectra of the products obtained after different periods of time. | ||
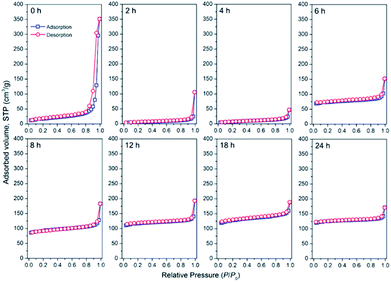
To further clarify the processes behind the seed-assisted crystallization of the CHA zeolite, the textural evolution of the obtained products was analyzed using the N2 adsorption–desorption and SEM techniques. Fig. 10 depicts the N2 adsorption–desorption isotherms of the products obtained at different times. The sample obtained at 0 h exhibit a low N2 uptake over the range of P/P0 = 0.1–0.8. The uptake dramatically increased at P/P0 above 0.8, suggesting the presence of large mesopores or macropores, which may have originated from the remaining gels. Upon prolonging the time until 4 h, the isotherm became more horizontal and the uptake at P/P0 above 0.8 decreased, which indicates the dissolution of the silica precursors. After 4 h, the initial uptake increased progressively, showing the gradual formation of the CHA zeolite micropore structure. The isotherms exhibit type-I behaviour without a hysteresis loop, showing the pure microporous nature of the products. Differently, the seeds did not exhibit a microporous nature due to their very low micropore volume value, ca. 0.001 cm3 g−1, as seen in Fig. S5.† It should be noted that the seeds are present in the K+-form, which has a large cationic size (d = 2.73 Å). Previous studies on the locations of K+ in both hydrated and dehydrated CHA-type zeolites have suggested that K+ is mainly located near the 8-MR aperture.50–52 Thus, the presence of K+ could sterically hinder N2 molecules to access the micropore, resulting in the very low micropore volume. It has been also reported that K+ has a very low affinity for N2 molecules.53,54
The evolution of the textural properties during the synthesis is provided in Table 1. As the time progresses, more amorphous species are crystallized, and thus, the micropore volume increased. From 4 to 6 h, a rapid increment of the micropore volume was observed followed by a slower rate from 6 to 24 h. This trend is similar to that obtained from XRD, ATR-IR, Raman, 27Al and 29Si MAS NMR. In our synthesis, the progressive increment in micropore volume should be associated with the crystallized parts, which have counter cation species dominated by Na+. Since Na+ possesses a smaller size compared to that of K+, the micropore structure can be accessed by N2 molecules, resulting in a higher micropore volume and surface area. This is supported by the fact that from 6 to 24 h, the micropore volume showed a notable increase (0.104–0.24 cm3 g−1), while the XRD crystallinity exhibited a slower rate trend (90–100%), showing that both crystallization and ion exchange contribute to the micropore volume increment.
![[thin space (1/6-em)]](https://www.rsc.org/images/entities/char_2009.gif) :
:![[thin space (1/6-em)]](https://www.rsc.org/images/entities/char_2009.gif) 0.05Al2O3
0.05Al2O3![[thin space (1/6-em)]](https://www.rsc.org/images/entities/char_2009.gif) :
:![[thin space (1/6-em)]](https://www.rsc.org/images/entities/char_2009.gif) 0.3Na2O
0.3Na2O![[thin space (1/6-em)]](https://www.rsc.org/images/entities/char_2009.gif) :
:![[thin space (1/6-em)]](https://www.rsc.org/images/entities/char_2009.gif) 0.1K2O
0.1K2O![[thin space (1/6-em)]](https://www.rsc.org/images/entities/char_2009.gif) :
:![[thin space (1/6-em)]](https://www.rsc.org/images/entities/char_2009.gif) 100H2O, at 170 °C in the presence of CHA seeds (10 wt% of the total silica)
100H2O, at 170 °C in the presence of CHA seeds (10 wt% of the total silica)
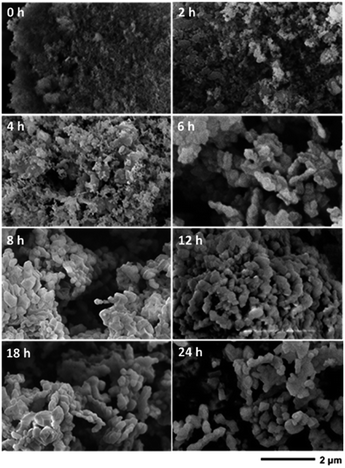
The SEM images of the products obtained at different times are shown in Fig. 11. At 0 h, which was before the hydrothermal treatment, aggregates of nanoparticles smaller than the seeds could be observed, likely representing the amorphous silica sources. However, the seeds were barely seen, presumably, because they were trapped inside the amorphous matrices of the fumed silica. This is reasonable since the characteristic bands of the CHA zeolite in the sample obtained at 0 h did not appear in both the ATR-IR and Raman spectra, but were detected by XRD. Upon prolonging the time to 2 h, seeds could be observed together with smaller particles on the surface of the seeds, which indicates the dissolution of the silica precursors. Smaller particles were still observed after 4 h, although in a smaller number. After 6 h of hydrothermal treatment, particles with crystal-like facets were observed. Since the solid yields obtained at 4 and 6 h are similar, it can be concluded that the amorphous solid phase was transformed into the crystalline CHA phase during this period. The crystal growth gradually developed during the prolonged synthesis after 6 h, as indicated by the increase in particle size. The crystal development resulted in the enhancement of the Si/Al ratio within the frameworks, as revealed by 29Si MAS NMR.
To clarify the behavior of the seeds, we performed another hydrothermal treatment in the absence of a silica source (0.3Na2O![[thin space (1/6-em)]](https://www.rsc.org/images/entities/char_2009.gif) :
:![[thin space (1/6-em)]](https://www.rsc.org/images/entities/char_2009.gif) 0.1K2O
0.1K2O![[thin space (1/6-em)]](https://www.rsc.org/images/entities/char_2009.gif) :
:![[thin space (1/6-em)]](https://www.rsc.org/images/entities/char_2009.gif) 100H2O), at 170 °C for 6 h. After the hydrothermal treatment, around 12% of the seeds was leached due to the alkaline environment. However, the crystallinity of the remaining seeds was preserved, as revealed by XRD (Fig. S6†), showing that the seeds did not undergo structural destruction or amorphization. Also, the peak broadening and weight loss after the hydrothermal treatment show the occurrence of partial dissolution (Fig. S6†).
100H2O), at 170 °C for 6 h. After the hydrothermal treatment, around 12% of the seeds was leached due to the alkaline environment. However, the crystallinity of the remaining seeds was preserved, as revealed by XRD (Fig. S6†), showing that the seeds did not undergo structural destruction or amorphization. Also, the peak broadening and weight loss after the hydrothermal treatment show the occurrence of partial dissolution (Fig. S6†).
From all the above investigations, the evolution of the seed-assisted synthesis of the CHA zeolite can be deduced as follows. Initially (0–4 h), the amorphous gels are dissolved, while the seeds are partially dissolved. This is followed directly by crystal growth without prior nucleation. The seeds themselves act as “nuclei” for the subsequent crystal growth. During 4 to 6 h, crystal growth from the aluminosilicate in the solution phase co-exists with the dissolution of the amorphous gels, resulting in a sharp increase in crystallinity but a constant solid yield. After 6 h, the rate of the crystallinity increment is decelerated since the dissolution of the amorphous gels may have stopped. Hence, the crystal growth is the sole event remaining.
Insights from the CHA case
It was previously suggested that alkali metal cations such as Na+ and K+ can act as structure-directing agents, in which the formation of ordered T–O–T bonds occur. Thus, to precisely confirm the role of these inorganic cations in our study, we performed a hydrothermal synthesis using the following initial composition, 1SiO2![[thin space (1/6-em)]](https://www.rsc.org/images/entities/char_2009.gif) :
:![[thin space (1/6-em)]](https://www.rsc.org/images/entities/char_2009.gif) 0.05Al2O3
0.05Al2O3![[thin space (1/6-em)]](https://www.rsc.org/images/entities/char_2009.gif) :
:![[thin space (1/6-em)]](https://www.rsc.org/images/entities/char_2009.gif) 0.3Na2O
0.3Na2O![[thin space (1/6-em)]](https://www.rsc.org/images/entities/char_2009.gif) :
:![[thin space (1/6-em)]](https://www.rsc.org/images/entities/char_2009.gif) 0.1 K2O
0.1 K2O![[thin space (1/6-em)]](https://www.rsc.org/images/entities/char_2009.gif) :
:![[thin space (1/6-em)]](https://www.rsc.org/images/entities/char_2009.gif) 100H2O, at 170 °C for 0 and 24 h without the addition of seeds. Consequently, although the products were amorphous as detected by XRD (Fig. S7a†), the shift in the hump towards a higher 2θ value suggests that the amorphous gel was structurally altered during the hydrothermal synthesis. This is supported by Raman spectroscopy (Fig. S7b†), which shows the enrichment of 4-MRs.
100H2O, at 170 °C for 0 and 24 h without the addition of seeds. Consequently, although the products were amorphous as detected by XRD (Fig. S7a†), the shift in the hump towards a higher 2θ value suggests that the amorphous gel was structurally altered during the hydrothermal synthesis. This is supported by Raman spectroscopy (Fig. S7b†), which shows the enrichment of 4-MRs.
As previously shown by ATR-IR (Fig. 5) and Raman spectroscopy (Fig. 6), at beginning of the seed synthesis, even before the hydrothermal treatment, the simple yet essential 4-MR aluminosilicate was easily formed in alkaline media. This is also supported by the fact that 4-MR has the lowest energy formation, around 0.16 eV, among the other rings.55 Na+ acts as coordination centers for the assembly of 4-MR into d6r, considering the size of anhydrous Na+ (d = 2.18 Å),56 which can be well-accommodated by d6r (d = 2.6 Å).51 As also suggested by Raman and ATR-IR spectroscopy, d6rs originated from the organizations of the formed 4-MRs.
To predict the role of K+ in our synthesis, the interzeolite conversion of FAU to CHA was referenced. We performed a series of experiments using solutions with the following molar composition, 0–0.0128M2O![[thin space (1/6-em)]](https://www.rsc.org/images/entities/char_2009.gif) :
:![[thin space (1/6-em)]](https://www.rsc.org/images/entities/char_2009.gif) 1H2O, where M is K and/or Na, for the interzeolite conversion of FAU to CHA. Using only KOH, FAU could be converted to CHA if K2O/H2O ≥ 0.009 (Fig. S8a†). Below this value, FAU could not be converted to CHA, presumably due to the lack of cations and alkalinity. Moreover, we gradually replaced the portions of K2O with Na2O at fixed alkalinity, i.e. (K2O + Na2O)/H2O = 0.0128 (Fig. S8b†). FAU could still be totally converted to CHA when 50% of K+ was replaced with Na+ (K2O/H2O = 0.0064 and Na2O/H2O = 0.0064). Further replacing 70% K+ with Na+ (K2O/H2O = 0.0038; Na2O/H2O = 0.009) resulted in the partial conversion of FAU to CHA. Finally, the complete replacement of K+ with Na+ (K2O/H2O = 0; Na2O/H2O = 0.0128) did not result in the formation of CHA, but preserved FAU. Hence, there should be a kinetic barrier for the conversion of FAU to CHA in the presence of cations other than K+, such as Na+. Similar results were also reported by Goel et al.57 Considering the fact that FAU and CHA exhibit a common natural building unit, i.e. d6r, it is likely that K+ is responsible for rearranging d6rs from FAU into the CHA structure.
1H2O, where M is K and/or Na, for the interzeolite conversion of FAU to CHA. Using only KOH, FAU could be converted to CHA if K2O/H2O ≥ 0.009 (Fig. S8a†). Below this value, FAU could not be converted to CHA, presumably due to the lack of cations and alkalinity. Moreover, we gradually replaced the portions of K2O with Na2O at fixed alkalinity, i.e. (K2O + Na2O)/H2O = 0.0128 (Fig. S8b†). FAU could still be totally converted to CHA when 50% of K+ was replaced with Na+ (K2O/H2O = 0.0064 and Na2O/H2O = 0.0064). Further replacing 70% K+ with Na+ (K2O/H2O = 0.0038; Na2O/H2O = 0.009) resulted in the partial conversion of FAU to CHA. Finally, the complete replacement of K+ with Na+ (K2O/H2O = 0; Na2O/H2O = 0.0128) did not result in the formation of CHA, but preserved FAU. Hence, there should be a kinetic barrier for the conversion of FAU to CHA in the presence of cations other than K+, such as Na+. Similar results were also reported by Goel et al.57 Considering the fact that FAU and CHA exhibit a common natural building unit, i.e. d6r, it is likely that K+ is responsible for rearranging d6rs from FAU into the CHA structure.
In the case of the interzeolite conversion of FAU to CHA, it is worthy to consider that CHA and FAU share a common natural building unit, i.e. d6r. Thus, K+ may organize the available d6rs that they will connect via condensation reaction to form a cha cage, and thus the whole CHA framework, as illustrated in Fig. 12. Both composite building units of CHA, d6r and cha, should not be considered as packing units for the CHA structure. This is because when these two units combine via condensation reaction, the CHA structure cannot be obtained, as illustrated in Fig. S9.† Consequently, cha should be considered as imaginary units resulting from the organization of d6rs, the actual packing units, which build the whole CHA structure. These insights are reasonable since the location of K+ in the CHA structure is preferentially at the cha cage near the 8-MR aperture (SIII′ site),50–52 while other monovalent cations reside on the other sites,52,58 which are the SI site at the center of d6r, SII site at the face d6r and SIII site adjacent to 4-MR, as illustrated in Fig. 12.
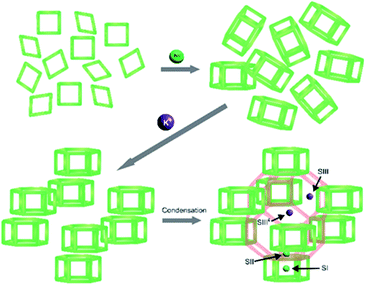 | ||
| Fig. 12 Schematic illustration of the role of Na+ and K+ in assisting the formation of CHA frameworks following the natural packing model. | ||
Previously, in the synthesis of low-silica zeolite X (FAU topology) using Na+ and K+, Iwama et al.59 showed that all of the SI sites (in the center of d6r) are occupied by Na+, while, K+ is mostly located at the SI′ sites, which are inside the t-toc cage (sodalite cage), just outside d6r. They proposed that the crystallization begins with the formation of d6r units, which assemble into a large unit, and eventually into the FAU structure. The fact that Na+ resides inside all the d6r units implies that Na+ directs the formation of the d6r units, and the location of K+ outside d6r indicates that K+ organizes the assembly of the d6r units into the FAU structure.
Successive use of the products as seeds
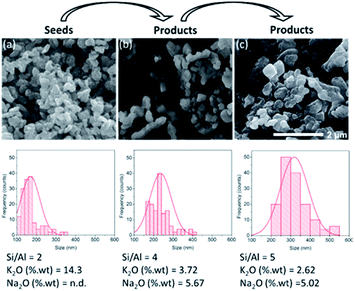
The successive use of the products as seeds is another significant aspect of the seed-assisted synthesis of zeolites. Fig. 13 depicts the SEM images, particle distributions and chemical compositions of three different CHA zeolites. The first was obtained through the interconversion of the FAU zeolite, the second was obtained through the seed-assisted synthesis using the first product as seeds, while the third was obtained through the seed-assisted synthesis using the second product as seeds. As seen, the second products exhibited a larger size than that of the first. Using the second products as seeds in the succeeding synthesis resulted in increasingly larger particles as well as Si/Al ratio. This was also followed by the simultaneous increase in Na2O and decrease in K2O in the products as well. The XRD patterns of the third products confirm that they possess the CHA zeolite topology (Fig. S10†). These results emphasize the role of seeds as “nuclei” for crystal growth.Conclusion
In summary, it was clearly demonstrated that the realization of the CHA zeolite via seed-assisted synthesis in the complete absence of OSDAs strongly depends on the control of the synergy between Na+ and K+, alkalinity, silica-to-alumina ratio and the seeds. High alkalinity ((Na2O + K2O)/H2O > 0.4) will result in a thermodynamically more stable phase, which is MER, as a competing phase, while less crystalline or amorphous products are obtained when the alkalinity is low ((Na2O + K2O)/SiO2 <0.4). At suitable alkalinity ((Na2O + K2O)/SiO2 <0.4), pure CHA zeolite can only be formed at a fixed point, i.e. at the tie line of Na2O/SiO2 = 0.3 with K2O/SiO2 = 0.1 due to the synergistic effect of Na+ and K+. In this composition, the pure CHA phase can be obtained at Si/Al ≤ 15.Our investigation on the crystallization behavior shows that the dissolution of the amorphous gel is predominant. The partial dissolution of the seed was also observed. There is a certain period in which dissolution and crystallization occur simultaneously. The crystallization does not appear to undergo nucleation, rather it directly goes to crystal growth on the surface of the remaining seeds. The crystallization is assisted by the synergy of sodium and potassium cations. The former directs the formation of d6r, while the latter assembles d6rs into the whole CHA framework. This is the synergistic role of sodium and potassium cations. It needs to be stressed that d6r should be the actual cbu, whereas the cha cage is imaginary since it is the result of the assembly of d6rs. All these results give further insight for a clearer picture of the crystallization of zeolites.
Conflicts of interest
There are no conflicts to declare.Acknowledgements
GTMK thanks to The Asahi Glass Foundation Research Grant 2019 (No. 25401/I1.C01.PL/2019) and RRM thanks to World Class University (WCU) program from the Ministry of Research, Technology, and Higher Education, Republic of Indonesia, managed by Institut Teknologi Bandung, to financially support this research. IRK is grateful for the BPPDN scholarship from Ministry of Research, Technology and Higher Education (Kemenristekdikti) Republic of Indonesia.References
- B. Xie, J. Song, L. Ren, Y. Ji, J. Li and F.-S. Xiao, Chem. Mater., 2008, 20, 4533–4535 CrossRef CAS.
- Y. Kamimura, W. Chaikittisilp, K. Itabashi, A. Shimojima and T. Okubo, Chem.–Asian J., 2010, 5, 2182–2191 CrossRef CAS PubMed.
- Y. Kamimura, S. Tanahashi, K. Itabashi, A. Sugawara, T. Wakihara, A. Shimojima and T. Okubo, J. Phys. Chem. C, 2011, 115, 744–750 CrossRef CAS.
- G. Majano, A. Darwiche, S. Mintova and V. P. Valtchev, Ind. Eng. Chem. Res., 2009, 48, 7084–7091 CrossRef CAS.
- N. Ren, J. Bronić, B. Subotić, X.-C. Lv, X.-J. Yang and Y. Tang, Microporous Mesoporous Mater., 2011, 139, 197–206 CrossRef CAS.
- A. Yashiki, K. Honda, A. Fujimoto, S. Shibata, Y. Ide, M. Sadakane and T. Sano, J. Cryst. Growth, 2011, 325, 96–100 CrossRef CAS.
- H. Zhang, C. Yang, L. Zhu, X. Meng, B. Yilmaz, U. Müller, M. Feyen and F.-S. Xiao, Microporous Mesoporous Mater., 2012, 155, 1–7 CrossRef CAS.
- K. Iyoki, Y. Kamimura, K. Itabashi, A. Shimojima and T. Okubo, Chem. Lett., 2010, 39, 730–731 CrossRef CAS.
- Y. Kamimura, K. Itabashi and T. Okubo, Microporous Mesoporous Mater., 2012, 147, 149–156 CrossRef.
- Y. Kamimura, K. Iyoki, S. P. Elangovan, K. Itabashi, A. Shimojima and T. Okubo, Microporous Mesoporous Mater., 2012, 163, 282–290 CrossRef CAS.
- Y. Kubota, K. Itabashi, S. Inagaki, Y. Nishita, R. Komatsu, Y. Tsuboi, S. Shinoda and T. Okubo, Chem. Mater., 2014, 26, 1250–1259 CrossRef CAS.
- S. Sogukkanli, K. Iyoki, S. P. langovan, K. Itabashi, M. Takano, Z. Liu, S. Inagaki, T. Wakihara, Y. Kubota and T. Okubo, Microporous Mesoporous Mater., 2017, 245, 1–7 CrossRef CAS.
- Y. Wang, X. Wang, Q. Wu, X. Meng, Y. Jin, X. Zhou and F.-S. Xiao, Catal. Today, 2014, 226, 103–108 CrossRef CAS.
- A. Ogawa, K. Iyoki, Y. Kamimura, S. P. Elangovan, K. Itabashi and T. Okubo, Microporous Mesoporous Mater., 2014, 186, 21–28 CrossRef CAS.
- Q. Wu, X. Wang, X. Meng, C. Yang, Y. Liu, Y. Jin, Q. Yang and F.-S. Xiao, Microporous Mesoporous Mater., 2014, 186, 106–112 CrossRef CAS.
- Q. Yu, X. Meng, J. Liu, C. Li and Q. Cui, Microporous Mesoporous Mater., 2013, 181, 192–200 CrossRef CAS.
- L. Wang, P. Tian, Y. Yuan, M. Yang, D. Fan, H. Zhou, W. Zhu, S. Xu and Z. Liu, Microporous Mesoporous Mater., 2014, 196, 89–96 CrossRef CAS.
- H. Zhang, Q. Guo, L. Ren, C. Yang, L. Zhu, X. Meng, C. Li and F.-S. Xiao, J. Mater. Chem., 2011, 21, 9494–9497 RSC.
- K. Iyoki, K. Itabashi, W. Chaikittisilp, S. P. Elangovan, T. Wakihara, S. Kohara and T. Okubo, Chem. Mater., 2014, 26, 1957–1966 CrossRef CAS.
- T. Yokoi, M. Yoshioka, H. Imai and T. Tatsumi, Angew. Chem., Int. Ed., 2009, 48, 9884–9887 CrossRef CAS PubMed.
- G.-T. Vuong and T.-O. Do, Nanozeolites and Nanoporous Zeolitic Composites: Synthesis and Applications, in Mesoporous Zeolites, ed. J.García-Martínez and K.Li, Wiley, Weinheim, 2015, ch. 3, pp. 79–114 Search PubMed.
- K. Itabashi, Y. Kamimura, K. Iyoki, A. Shimojima and T. Okubo, J. Am. Chem. Soc., 2012, 134, 11542–11549 CrossRef CAS PubMed.
- B. Xie, H. Zhang, C. Yang, S. Liu, L. Ren, L. Zhang, X. Meng, B. Yilmaz, U. Müller and F.-S. Xiao, Chem. Commun., 2011, 47, 3945–3947 RSC.
- Y. Wang, X. Wang, Q. Wu, X. Meng, Y. Jin, X. Zhou and F.-S. Xiao, Catal. Today, 2014, 226, 103–108 CrossRef CAS.
- Z. Liu, T. Wakihara, D. Nishioka, K. Oshima, T. Takewaki and T. Okubo, Chem. Mater., 2014, 26, 2327–2331 CrossRef CAS.
- O. Cheung and N. Hedin, RSC Adv., 2014, 4, 14480–14494 RSC.
- T. D. Pham and R. F. Lobo, Microporous Mesoporous Mater., 2016, 236, 100–108 CrossRef CAS.
- M. Miyamoto, Y. Fujioka and K. Yogo, J. Mater. Chem., 2012, 22, 20186–20189 RSC.
- J. Zhang, R. Singh and P. A. Webley, Microporous Mesoporous Mater., 2008, 111, 478–487 CrossRef CAS.
- A. Shishkin, H. Kannisto, P.-E. Carlsson, J. Härelinda and M. Skoglundh, Catal. Sci. Technol., 2014, 4, 3917–3926 RSC.
- M. K. Wardani, G. T. M. Kadja, A. T. N. Fajar, S. Subagjo, I. G. B. N. Makertihartha, M. L. Gunawan, V. Suendo and R. R. Mukti, RSC Adv., 2019, 9, 77–86 RSC.
- H. Imai, N. Hayashida, T. Yokoi and T. Tatsumi, Microporous Mesoporous Mater., 2014, 196, 341–348 CrossRef CAS.
- H. Robson, Verified Synthesis of Zeolitic Materials, Elsevier, Amsterdam, edn 2nd revised, 2001 Search PubMed.
- C. Anand, T. Kaneda, S. Inagaki, S. Okamura, H. Sakurai, K. Sodeyama, T. Matsumoto, Y. Kubota, T. Okubo and T. Wakihara, New J. Chem., 2016, 40, 492–496 RSC.
- B. Hunter, “Rietica – A visual Rietveld program”, International Crystallography Commission on Powder Diffraction Newsletter No. 20, Summer, 1998, See http://www.rietica.org Search PubMed.
- Database of Zeolite Structures, http://www.iza-structures.org/databases/ Search PubMed.
- M. Maldonado, M. D. Oleksiak, S. Chinta and J. D. Rimer, J. Am. Chem. Soc., 2013, 135, 2641–2652 CrossRef CAS PubMed.
- B. M. Skofteland, O. H. Ellestad and K. P. Lillerud, Microporous Mesoporous Mater., 2001, 43, 61–71 CrossRef CAS.
- S. D. Kim, S. H. Noh, K. H. Seong and W. J. Kim, Microporous Mesoporous Mater., 2004, 72, 185–192 CrossRef CAS.
- R. Al-Oweini and H. El-Rassy, J. Mol. Struct., 2009, 919, 140–145 CrossRef CAS.
- H. Fichtner-Schmittler, U. Lohse, H. Miessner and H. E. Z. Maneck, Z. Phys. Chem., 1990, 271, 69–79 CAS.
- W. Mozgawa, J. Mol. Struct., 2001, 596, 129–137 CrossRef CAS.
- M. Sitarz, W. Mozgawa and M. J. Handke, J. Mol. Struct., 1999, 511–512, 281–285 CrossRef CAS.
- W. Mozgawa and M. Sitarz, J. Mol. Struct., 2002, 614, 273–279 CrossRef CAS.
- A. Fernández-Jiménez and A. Palomo, Microporous Mesoporous Mater., 2005, 86, 207–214 CrossRef.
- B. Mihailova, Modern Spectroscopic Methods Applied to Nanoscale Porous Materials, in Ordered Porous Solids: Recent Advances and Prospects, ed. V. Valtchev, S. Mintova and M. Tsapatsis, Elsevier, Amsterdam, 2009, pp. 187–209 Search PubMed.
- Q. Li, B. Mihailova, D. Creaser and J. Sterte, Microporous Mesoporous Mater., 2001, 43, 51–59 CrossRef CAS.
- Y. Yu, G. Xiong, C. Li and F.-S. Xiao, Microporous Mesoporous Mater., 2001, 46, 23–34 CrossRef CAS.
- T. Ikuno, W. Chaikittisilp, Z. Liu, T. Iida, Y. Yanaba, T. Yoshikawa, S. Kohara, T. Wakihara and T. Okubo, J. Am. Chem. Soc., 2015, 137, 14533–14544 CrossRef CAS PubMed.
- F. N. Ridha and P. A. Webley, Sep. Purif. Technol., 2009, 67, 336–343 CrossRef CAS.
- J. Shang, G. Li, R. Singh, P. Xiao, J. Z. Liu and P. A. Webley, J. Phys. Chem. C, 2010, 114, 22025–22031 CrossRef CAS.
- L. J. Smith, H. Eckert and A. K. Cheetham, Chem. Mater., 2001, 13, 385–391 CrossRef CAS.
- J. Shang, G. Li, R. Singh, Q. Gu, K. M. Nairn, T. J. Bastow, N. Medhekar, C. M. Doherty, A. J. Hill, J. Z. Liu and P. A. Webley, J. Am. Chem. Soc., 2012, 134, 19246–19253 CrossRef CAS PubMed.
- J. Shang, G. Li, R. Singh, P. Xiao, J. Z. Liu and P. A. Webley, J. Phys. Chem. C, 2013, 117, 12841–12847 CrossRef CAS.
- F. L. Galeener, Solid State Commun., 1982, 44, 1037–1040 CrossRef CAS.
- I. Persson, Pure Appl. Chem., 2010, 82, 1901–1917 CAS.
- S. Goel, S. I. Zones and E. Iglesia, Chem. Mater., 2015, 27, 2056–2066 CrossRef CAS.
- L. J. Smith, H. Eckert and A. K. Cheetham, J. Am. Chem. Soc., 2000, 122, 1700–1708 CrossRef CAS.
- M. Iwama, Y. Suzuki, J. Plévert, K. Itabashi, M. Ogura and T. Okubo, Cryst. Growth Des., 2010, 10, 3471–3479 CrossRef CAS.
Footnote |
| † Electronic supplementary information (ESI) available. See DOI: 10.1039/c9ra10825d |
| This journal is © The Royal Society of Chemistry 2020 |

