 Open Access Article
Gel properties and flavor characteristics of blended anchovy (Engraulis japonicus) mince and silver carp (Hypophthalmichthys molitrix) surimi
Shumin Yi ab,
Ying Jiab,
Zhihan Guoab,
Jing Zhuab,
YongXia Xuab,
Xuepeng Li*ab and
Jianrong Li*ab
aCollege of Food Science and Technology, Bohai University, National & Local Joint Engineering Research Center of Storage, Processing and Safety Control Technology for Fresh Agricultural and Aquatic Products, 19 Keji Road, Jinzhou, Liaoning 121013, P. R. China. E-mail: xuepengli8234@163.com; lijr6491@163.com; Fax: +86-416-3719190; Tel: +86-416-3400008
bNational R&D Branch Center of Surimi and Surimi Products Processing, Jinzhou, Liaoning, China
First published on 12th February 2020
Abstract
This paper aims to research the gel properties and flavor characteristics of anchovy mince and silver carp surimi blended in different ratios (0/100, 10/90, 20/80, 30/70, 40/60 and 100/0). When the ratios of anchovy mince to silver carp surimi were 10/90 and 20/80, the gel strength of the blended systems increased significantly from 4629.17 g mm to 7568.01 g mm and 6804.22 g mm, respectively. Under these two ratios, the water-holding capacity of the blended systems increased significantly from 56.43% to 71.82% and 69.36%, respectively. In addition, the blended systems formed a highly uniform and dense network structure. At ratios of 0/100, 10/90 and 20/80, the myosin heavy chain was cross-linked, resulting in the formation of macromolecular aggregates. With the increase in anchovy mince content, the brightness and whiteness of the blended systems decreased gradually. When the ratio of anchovy mince to silver carp surimi was 10/90, the sensory evaluation score of the blended system was the highest and the bitterness score the lowest. Under this ratio, the relative contents of esters and aldehydes were the highest, while those of alcohols and ketones were the lowest. In conclusion, the optimum sample formulation contained a 10/90 ratio of anchovy mince to silver carp surimi.
1. Introduction
With the accelerating pace of life, the annual demand for surimi-based products worldwide has increased, especially in China, from 819![[thin space (1/6-em)]](https://www.rsc.org/images/entities/char_2009.gif) 100 tons in 2008 to 1
100 tons in 2008 to 1![[thin space (1/6-em)]](https://www.rsc.org/images/entities/char_2009.gif) 455
455![[thin space (1/6-em)]](https://www.rsc.org/images/entities/char_2009.gif) 460 tons in 2018.1 The main raw material of surimi products is large marine fish resources. However, marine fish resources are increasingly scarce. Low-value fish with large catches and small individuals is mostly used to produce feed. The waste of resources is serious and the added value is low.2 If low-value fish is processed into surimi-based product, the added value is greatly increased.
460 tons in 2018.1 The main raw material of surimi products is large marine fish resources. However, marine fish resources are increasingly scarce. Low-value fish with large catches and small individuals is mostly used to produce feed. The waste of resources is serious and the added value is low.2 If low-value fish is processed into surimi-based product, the added value is greatly increased.
Anchovy (Engraulis japonicus) is a small marine pelagic fish that feeds on zooplankton. The larger adult fish weighs about 10 g and measure about 10 cm.3 In the past 10 years, the amounts of caught anchovy have increased to more than 1.2 million tons worldwide annually.4 Anchovy is not only rich in resources, but also high in nutritional value. It contains a variety of fatty acids and mineral elements.5 Currently, anchovy is utilized mainly as processed and manufactured fish meal and for the extraction of fish oil.6 However, the potential for anchovy is not fully exploited. Appropriate processing methods could increase its range of applications.
Silver carp (Hypophthalmichthys molitrix) is one of the four most popular freshwater fish species in China. Over the past decade, more than four million tons of silver carp have been caught worldwide, annually.4 Silver carp is exploited because of its abundant yield. Processing silver carp into surimi is a good strategy. However, silver carp is very difficult to gelation, easy to gel and deteriorate.7 The flavor characteristics of silver carp surimi are similar to those of living fish, with a strong fishy, earthy smell.8 Therefore, improving the gel properties and flavor characteristics of silver carp surimi has become the focus of attention.
Many scholars have investigated the gel properties of blended surimi; however, few studies have analyzed its flavor characteristics. Paker et al.9 added the sarcoplasmic protein extracted from silver carp to the Alaska pollock (Theragra chalcogramma) surimi, resulting in significant improvement in brightness and whiteness of the blended surimi gel. Yu et al.7 demonstrated that the breaking force, the breaking distance, and the gel strength of the blended silver carp and the golden threadfin bream (Nemipterus virgatus) surimi were significantly higher than those of single surimi-based product. Amiza et al.10 mixed surimi and silvery catfish in a 40![[thin space (1/6-em)]](https://www.rsc.org/images/entities/char_2009.gif) :
:![[thin space (1/6-em)]](https://www.rsc.org/images/entities/char_2009.gif) 60 ratio to generate a pure surimi gel cost-effectively.
60 ratio to generate a pure surimi gel cost-effectively.
This study investigated the gel properties and flavor characteristics of blended anchovy mince and silver carp surimi. The goal was to optimally utilize the anchovy and improve the gel properties and flavor characteristics of silver carp surimi. It is hoped that this study can understand the change rules of gel properties and flavor characteristics of blended surimi, so as to provide ideas for improving the performance of silver carp surimi-based product.
2. Materials and methods
2.1 Raw materials
Silver carp surimi (AAA grade) was obtained from Honghu Jingli Aquatic Food Co., LTD. (Honghu, China). Frozen anchovy was obtained from Dalian Xinrong Fisheries Market (Dalian, China).2.2 Anchovy mince
The frozen anchovy was thawed under streaming water. Anchovy was processed (by removing the head, tail, viscera, and skin) to obtain mince. The mince was chopped at low temperatures (<10 °C) uniformly, and stored at −80 °C.2.3 Amino acid
The amino acid composition and content of anchovy mince and silver carp surimi were analyzed.112.4 Gel properties
| Whiteness = 100 − [(100 − L*)2 + a*2 + b*2]½ |
| WHC (%) = M2/M1 × 100 |
![[thin space (1/6-em)]](https://www.rsc.org/images/entities/char_2009.gif) 000 rpm for 15 min at 4 °C, and the supernatant was obtained. The concentration of supernatant was adjusted to 3 mg mL−1, mixed with the buffer (code no. 9172, Takara Bio, China) at a ratio of 1
000 rpm for 15 min at 4 °C, and the supernatant was obtained. The concentration of supernatant was adjusted to 3 mg mL−1, mixed with the buffer (code no. 9172, Takara Bio, China) at a ratio of 1![[thin space (1/6-em)]](https://www.rsc.org/images/entities/char_2009.gif) :
:![[thin space (1/6-em)]](https://www.rsc.org/images/entities/char_2009.gif) 1 (v/v), and boiled for 20 min. A 4% concentrated gum (including 30% Acr/Bis, ultrapure water, 0.5 M Tris–HCl, 10% SDS, 10% APS, TEMED) and 12% separated gum (including 30% Acr/Bis, ultrapure water, 1.5 M Tris–HCl, 10% SDS, 10% APS, TEMED) were used to prepare the gum (Bio-Rad, US). Finally, the electrophoresis map was analyzed by Image software.
1 (v/v), and boiled for 20 min. A 4% concentrated gum (including 30% Acr/Bis, ultrapure water, 0.5 M Tris–HCl, 10% SDS, 10% APS, TEMED) and 12% separated gum (including 30% Acr/Bis, ultrapure water, 1.5 M Tris–HCl, 10% SDS, 10% APS, TEMED) were used to prepare the gum (Bio-Rad, US). Finally, the electrophoresis map was analyzed by Image software.2.5 Flavor characteristics
![[thin space (1/6-em)]](https://www.rsc.org/images/entities/char_2009.gif) :
:![[thin space (1/6-em)]](https://www.rsc.org/images/entities/char_2009.gif) 5 (m/m). The sample was homogenized with a high-speed homogenizer for 1 min. Finally, the sample was centrifuged at 3000 rpm for 15 min, and a supernatant was obtained. The supernatant was diluted for determination. The samples were measured and analyzed using an electronic tongue (SA 402B, Insent, Japan).
5 (m/m). The sample was homogenized with a high-speed homogenizer for 1 min. Finally, the sample was centrifuged at 3000 rpm for 15 min, and a supernatant was obtained. The supernatant was diluted for determination. The samples were measured and analyzed using an electronic tongue (SA 402B, Insent, Japan).2.6 Statistical analysis
The experimental data were analyzed and processed using the SPSS 19.0 software (average differences were evaluated by a Tukey's test using a 95% confidence interval), and plotted with Origin 9.0 software. Each group of samples was measured three times in parallel.3. Results and discussion
3.1 Amino acid
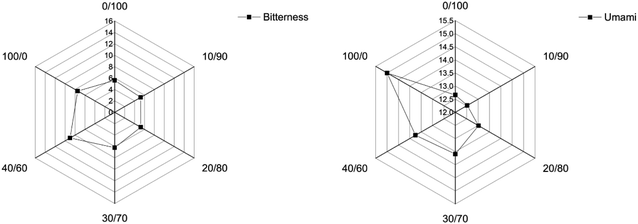
Table 1 shows the amino acid composition and content of anchovy mince and silver carp surimi. The main amino acids of anchovy mince were Glu, Asp, Lys, Leu and Arg. The composition and content of main amino acids of silver carp surimi were consistent with those of anchovy mince.20 The main umami amino acids were Glu and Asp21 which accounted for 15.01% and 14.95% of anchovy mince and silver carp surimi, respectively. The main bitterness amino acids were Val, Met, Iso, Leu, Phe, Lys, His and Arg,22 which constituted 25.29% and 21.71% of anchovy mince and silver carp surimi, respectively. This index provides a basis for the gel properties and flavor characteristics.| AA composition | Anchovy mince | Silver carp surimi |
|---|---|---|
| a AA denotes amino acid. | ||
| Aspartic (Asp) | 5.45 ± 0.12 | 5.14 ± 0.19 |
| Glutamic (Glu) | 9.56 ± 0.21 | 9.81 ± 0.34 |
| Serine (Ser) | 2.15 ± 0.14 | 2.12 ± 0.07 |
| Glycine (Gly) | 1.82 ± 0.07 | 2.04 ± 0.12 |
| Alanine (Ala) | 3.47 ± 0.09 | 2.82 ± 0.11 |
| Tyrosine (Tyr) | 1.92 ± 0.05 | 1.68 ± 0.05 |
| Proline (Pro) | 1.73 ± 0.03 | 1.74 ± 0.09 |
| Threonine (Thr) | 2.60 ± 0.05 | 2.36 ± 0.07 |
| Valine (Val) | 3.90 ± 0.12 | 2.49 ± 0.08 |
| Methionine (Met) | 1.93 ± 0.14 | 1.58 ± 0.05 |
| Isoleucine (Iso) | 2.46 ± 0.09 | 2.33 ± 0.08 |
| Leucine (Leu) | 5.24 ± 0.19 | 4.25 ± 0.15 |
| Phenylalanine (Phe) | 2.11 ± 0.11 | 1.86 ± 0.07 |
| Lysine (Lys) | 3.46 ± 0.21 | 4.94 ± 0.17 |
| Histidine (His) | 2.82 ± 0.10 | 1.03 ± 0.04 |
| Arginine (Arg) | 3.37 ± 0.15 | 3.23 ± 0.13 |
3.2 Gel properties
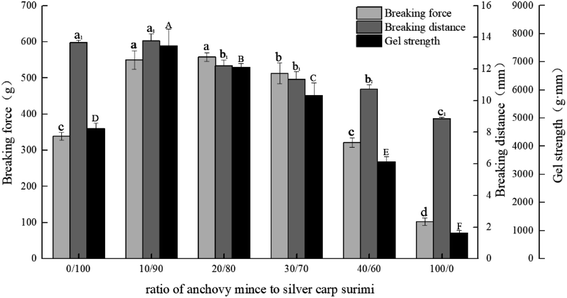
According to Fig. 1, the breaking force, breaking distance, and gel strength of silver carp surimi gel were higher than those of anchovy mince. With increase in anchovy mince content, the breaking force and gel strength of the blended systems increased initially and then decreased eventually. When the ratios of anchovy mince to silver carp surimi were 10/90, 20/80 and 30/70, the gel strength of the blended systems increased significantly compared with that of the silver carp surimi gel (p < 0.05), and increased from 4629.17 g mm to 7568.01 g mm, 6804.22 g mm and 5805.38 g mm, respectively. When the ratio of anchovy mince to silver carp surimi was 40/60, the gel strength of the blended system was lower than that of pure silver carp surimi.
The protein was separated from kilka and silver carp using the pH-shift method, the gel strength of the blended protein was enhanced at a ratio of 1![[thin space (1/6-em)]](https://www.rsc.org/images/entities/char_2009.gif) :
:![[thin space (1/6-em)]](https://www.rsc.org/images/entities/char_2009.gif) 1 (w/w). This is due to the exposure of active sulfhydryl and hydrophobic groups caused by the unfolding of some proteins.24 When the croaker-mackerel surimi blend was mixed at a ratio of 1
1 (w/w). This is due to the exposure of active sulfhydryl and hydrophobic groups caused by the unfolding of some proteins.24 When the croaker-mackerel surimi blend was mixed at a ratio of 1![[thin space (1/6-em)]](https://www.rsc.org/images/entities/char_2009.gif) :
:![[thin space (1/6-em)]](https://www.rsc.org/images/entities/char_2009.gif) 2 (w/w), it yielded a similar gel strength of blended surimi and mackerel surimi.25 The results of this experiment were similar to those reported in the literature. The gel strength of the anchovy mince was not favorable; however, it partly replaced the silver carp surimi, resulting in higher gel strength and reduce the cost of surimi product.
2 (w/w), it yielded a similar gel strength of blended surimi and mackerel surimi.25 The results of this experiment were similar to those reported in the literature. The gel strength of the anchovy mince was not favorable; however, it partly replaced the silver carp surimi, resulting in higher gel strength and reduce the cost of surimi product.
| A/S | L* | a* | b* | Whiteness |
|---|---|---|---|---|
| a A denotes anchovy mince, and S denotes silver carp surimi. A/S indicates the ratio of anchovy mince to silver carp surimi. a–f Means ± SD that have no superscript in common within a column are significantly different from each other (p < 0.05). | ||||
| 0/100 | 77.79 ± 0.48a | −5.04 ± 0.05f | 8.44 ± 0.22e | 75.71 ± 0.36a |
| 10/90 | 73.94 ± 0.30b | −3.99 ± 0.10e | 10.70 ± 0.14d | 71.55 ± 0.30b |
| 20/80 | 71.36 ± 0.67c | −3.15 ± 0.10d | 12.08 ± 0.22c | 68.76 ± 0.62c |
| 30/70 | 69.51 ± 0.35d | −2.69 ± 0.02c | 12.81 ± 0.35b | 66.81 ± 0.33d |
| 40/60 | 68.19 ± 0.87e | −1.97 ± 0.11b | 13.53 ± 0.26a | 65.37 ± 0.73e |
| 100/0 | 60.10 ± 2.63f | −1.05 ± 0.53a | 13.28 ± 0.81a | 57.91 ± 2.27f |
The current study suggests that the whiteness of blended (silver carp and white croaker) surimi was negatively correlated with gel strength probably due to the absorption of visible light by the compact myofibrillar matrix.28 The experimental results were similar to those of this experiment. However, a few studies indicated that the whiteness of blended surimi gel was positively correlated with gel strength. The muscle protein of silver carp was added to Alaska pollock surimi, and the brightness and whiteness of the blended sample were significantly improved compared with the myofibrillar protein in silver carp,9 which was contrary to our findings.
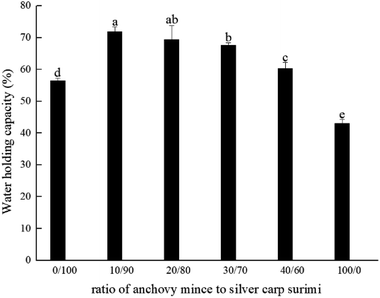 | ||
| Fig. 2 Changes in water-holding capacity of blended anchovy mince and silver carp surimi. a–d Means ± SD represents the significance between WHCs (p < 0.05). | ||
As shown in Fig. 2, the anchovy mince had the lowest WHC. With increased anchovy mince content, the WHC of the blended systems improved significantly (p < 0.05). When the ratios of anchovy mince to silver carp surimi were 10/90 and 20/80, the WHC of the blended systems increased significantly compared with that of the silver carp surimi gel (p < 0.05), from 56.43% to 71.82% and 69.36%, respectively. With the increase in anchovy mince content, the crosslinking network structure of the blended systems was further enhanced. The compact microstructure may hinder the outflow of water and increase the WHC.30 The WHC of silver carp surimi was improved by blending with Nemipterus virgatus surimi.7 The WHC of mackerel surimi was improved by blending with croaker surimi.25 The results suggest that the silver carp surimi can be partially replaced by anchovy mince, thereby enhancing the WHC of the blended systems, which was consistent with previous results of gel strength.
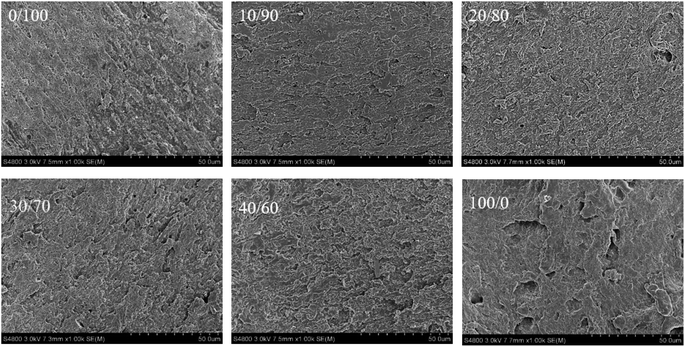
As shown in Fig. 3, the microstructure of anchovy mince, silver carp surimi and blended systems showed obvious differences. The microstructure of silver carp surimi gel was uneven, rough and lacked an ordered network structure. In comparison, the microstructure of the blended systems was relatively smooth, homogeneous, and contained small pores. With the increase in anchovy mince content, the blended systems gradually formed a denser network structure. Especially, at ratios of 10/90 and 20/80, the blended systems formed highly uniform and orderly three-dimensional network structure. The dense gel network structure of surimi gel facilitated tight binding of additional free water, increasing the WHC and gel strength.
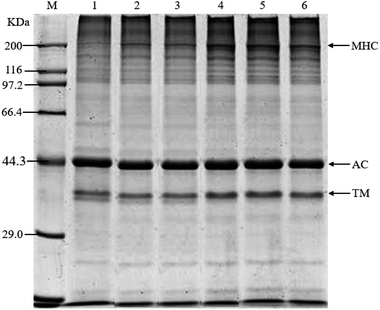
As shown in Fig. 4, with the increase in anchovy mince content, the MHC of the blended systems gradually increased in depth. When the ratios of anchovy mince to silver carp surimi were 10/90 and 20/80, the MHC strips of the blended systems were the thinnest and the lightest. The MHC strip of the anchovy mince was the deepest. That was because the MHC of the gel sample with adequate gel strength undergoes crosslinking via salt bridges, forming larger aggregates, which do not enter the separation gel, thereby explaining the relatively shallow MHC strip.31 These findings were consistent with previous results.
3.3 Flavor characteristics
| A/S | Smell | Color | Shape | Taste | Score |
|---|---|---|---|---|---|
| a A denotes anchovy mince, and S denotes silver carp surimi. A/S indicates the ratio of anchovy mince to silver carp surimi. a–d Means ± SD that have no superscript in common within a column are significantly different from each other (p < 0.05). | |||||
| 0/100 | 3.00 ± 1.00b | 5.00 ± 0.00a | 4.33 ± 0.58ab | 2.67 ± 0.58b | 13.67 ± 0.58c |
| 10/90 | 4.33 ± 0.58a | 4.33 ± 0.58a | 5.00 ± 0.00a | 4.33 ± 0.57a | 17.33 ± 0.57a |
| 20/80 | 4.33 ± 0.57a | 3.33 ± 0.57b | 4.33 ± 0.57ab | 4.33 ± 0.57a | 15.67 ± 0.57b |
| 30/70 | 4.50 ± 0.00a | 2.67 ± 0.58bc | 3.67 ± 0.58bc | 3.67 ± 0.58ab | 13.50 ± 1.00c |
| 40/60 | 4.55 ± 1.00a | 2.33 ± 0.57c | 3.00 ± 1.00c | 3.33 ± 0.58ab | 13.22 ± 0.58c |
| 100/0 | 4.67 ± 0.58a | 1.33 ± 0.58d | 1.33 ± 0.57d | 3.33 ± 0.57ab | 9.33 ± 0.58d |
| Classification | Compound name | RT/min | RI | Relative amount/% | |||||
|---|---|---|---|---|---|---|---|---|---|
| 0/100 | 10/90 | 20/80 | 30/70 | 40/60 | 100/0 | ||||
| Esters | Ethyl acetate | 3.0196 | <800 | 1.5939 | 3.0295 | 3.3413 | 3.9189 | 3.7856 | 4.9045 |
| 2-Ethylhexyl cyanoacetate | 17.1074 | 822.6574 | — | 0.0922 | 0.1097 | 0.3584 | 0.8527 | 0.9245 | |
| Butyl isobutyrate | 31.6624 | 811.6050 | 0.1495 | — | — | — | — | — | |
| Alcohols | 1-Penten-3-ol | 3.5714 | <800 | — | — | — | — | — | 3.6919 |
| 3-Hexanol | 3.8137 | <800 | — | — | — | — | — | 10.1584 | |
| 2-Methyl-2-butanol | 3.9175 | <800 | — | — | — | — | — | 2.3483 | |
| 3-Methyl-1-butanol | 5.0654 | <800 | — | — | — | — | 0.4984 | 2.2716 | |
| 1-Butanol | 5.4403 | <800 | — | — | — | — | 7.0249 | 6.8470 | |
| 1-Hexanol | 9.7953 | 816.2212 | 0.8122 | 0.7805 | 0.709 | 0.6984 | 0.6851 | 0.4201 | |
| 1-Octen-3-ol | 14.5471 | 858.2727 | 2.6345 | 1.3636 | 1.3733 | 1.9081 | 1.919 | 4.5621 | |
| 2-Ethylhexanol | 16.7690 | 815.9163 | 2.2822 | — | — | — | — | — | |
| Aldehyde | Valeraldehyde | 2.4639 | <800 | — | — | — | — | — | 2.0288 |
| Isovaleraldehyde | 3.0754 | <800 | — | — | — | — | — | 2.5165 | |
| Hexanal | 6.8016 | 822.4479 | 1.7622 | 10.1350 | 10.9103 | 11.4223 | 2.9795 | 0.9933 | |
| Heptaldehyde | 10.6720 | 842.7879 | 0.7868 | 0.4965 | — | — | — | — | |
| Ketone | 2-Butanone | 2.5216 | <800 | — | — | — | — | — | 0.8643 |
| 3-Pentanone | 4.0847 | <800 | 2.8715 | 2.4062 | — | — | — | — | |
| 2,3-Octanedione | 14.8308 | 866.5924 | 2.5063 | — | — | — | — | — | |
| Alkanes | 2-Chloro-2-methylpropane | 4.1367 | <800 | — | — | — | — | — | 1.1227 |
| Dodecane | 24.8906 | 894.9051 | 0.4555 | — | — | — | — | — | |
| 3,5-Dimethyloctane | 14.8078 | 865.9179 | 1.6133 | — | — | — | — | — | |
| N-Pentadecane | 32.9699 | 839.0735 | 0.2790 | — | — | — | 2.0098 | 1.3176 | |
| N-Heptadecane | 41.4011 | 871.0415 | 0.431 | 0.9515 | 1.2400 | 1.6808 | 1.3298 | 3.0015 | |
| Dipentene | 16.4498 | 809.5578 | 0.2314 | 0.5194 | 0.4289 | 0.3968 | 0.1529 | 0.1490 | |
| 2-Phenyl-1-propene | 19.3762 | 867.8526 | — | — | — | — | — | 0.5118 | |
| 1-Hexadecene | 30.0993 | 863.6439 | 0.3259 | 0.2684 | — | — | — | — | |
| Toluene | 5.76905 | <800 | 2.4429 | 0.3519 | — | — | — | — | |
| Ethylbenzene | 9.1780 | 897.4132 | 0.4851 | — | — | — | — | — | |
| o-Xylene | 9.4780 | 806.6061 | 0.2290 | — | — | — | — | — | |
| m-Xylene | 9.6279 | 811.1485 | 0.7970 | — | — | — | — | — | |
| Other | N-Methylhexylamine | 1.841 | <800 | — | — | — | — | — | 2.3583 |
| Trimethylamine hydrochloride | 2.1947 | <800 | 6.3245 | 5.8512 | 5.5011 | 5.0939 | 3.1917 | 2.2724 | |
| Isopropylamine | 2.4754 | <800 | 17.9439 | — | — | — | — | — | |
| 2-Butene oxide | 3.1330 | <800 | — | 1.3125 | — | — | — | — | |
| 2,3-Dihydrofuran | 6.0633 | <800 | 0.4076 | — | — | — | — | — | |
| Ethylene oxide | 2.0082 | <800 | 2.1519 | 2.5865 | 4.5621 | 6.5307 | 7.5811 | 8.2541 | |
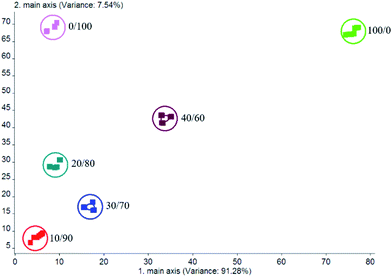
Aldehydes are mostly derived from the oxidation of unsaturated fatty acids. The aldehydes content is usually lower than that of the other compounds, and account for a fatty flavor.32 Hexanal is the product of linoleic acid oxidation, with the smell of raw oil, green grass and apple. When the ratios of anchovy mince to silver carp surimi were 10/90, 20/80 and 30/70, the content of the blended systems aldehydes were higher, which was consistent with the previous results. Ketones have higher threshold than aldehydes, and are produced by oxidation or thermal degradation of polyunsaturated fatty acids, amino acid degradation or microbial oxidation.36 Ketones contribute minimally to fish odor, but they do enhance the fishy odor. When the content of anchovy mince was reduced, the ketone content of the blended systems was higher, resulting in a stronger fishy smell.
4. Conclusion
The ratio of anchovy mince to silver carp surimi affected the gel strength, whiteness, WHC, cooking loss rate, microstructure, and SDS-PAGE, as well as smell, taste, and volatile substances. The optimum sample formulation contained anchovy mince and silver carp surimi in a 10/90 ratio, which resulted in the highest gel strength, the highest WHC, and the most desirable sensory attributes. Because anchovy is marine fish, its may contain various endogenous enzymes, which will enhance the gel properties of the blended system, and the specific mechanism needs further experimental study.Conflicts of interest
The authors have declared no conflicts of interest.Acknowledgements
This study was supported by the grant from National Key R&D Program of China (2018YFD0901004), National Natural Science Foundation of China (31571868, 31972107, 31771999, 31701631, 31701629), and Natural Science Foundation of Liaoning Province (20180550889) and Liaoning Revitalization Talents Program (XLYC1907040, 1807133).References
- L. Xu and F. Wu, China Fishery Ministry, China Agriculture Press, Beijing, China, 2019.
- L. Abbey, M. Glover-Amengor, M. O. Atikpo, A. Atter and J. Toppe, Food Sci. Nutr., 2017, 5, 374–379 CrossRef PubMed.
- I. Aydin and N. Gokoglu, Eur. J. Lipid Sci. Technol., 2014, 116, 996–1001 CrossRef.
- L. Garibaldi and S. Funge-Smith, FAO Fishery and Aquaculture Statistics, Fishery Year Book, Rome, Italy, 2018 Search PubMed.
- J. A. Park, S. Y. Joo, M. S. Cho and J. E. Oh, Fish. Sci., 2018, 84, 1091–1098 CrossRef.
- W. Tang, H. Zhang, L. Wang and H. Qian, Int. J. Food Sci. Technol., 2014, 49, 969–975 CrossRef.
- Y. Yu, S. Yi, Y. Xu, J. Shao, J. Li, Y. Li and G. Ji, Food Sci., 2016, 37, 17–22 Search PubMed.
- X. Fu, S. Xu and Z. Wang, Food Res. Int., 2009, 42, 90 CrossRef.
- I. Paker and K. E. Matak, LWT–Food Sci. Technol., 2015, 63, 985–991 CrossRef.
- M. A. Amiza and S. C. Ng, J. Aquat. Food Prod. Technol., 2015, 24, 213–226 CrossRef.
- AOAC, Official Methods of Analysis of the Association of Official Analytical Chemists, Washington, DC, 17th edn, 2002 Search PubMed.
- M. Chaijan, W. Panpipat and S. Benjakul, Food Chem., 2010, 121, 85–92 CrossRef.
- J. W. Park, J. Food Sci., 1994, 59, 525–527 CrossRef.
- I. Sanchez-Gonzalez, P. Carmona, P. Moreno, J. Borderías, I. Sanchez-Alonso, A. Rodríguez-Casado and M. Careche, Food Chem., 2008, 106, 56–64 CrossRef.
- A. Oujifard, S. Benjakul, M. Ahmad and J. Seyfabadi, LWT–Food Sci. Technol., 2012, 47, 261–266 CrossRef.
- J. Jaczynski and J. W. Park, J. Food Sci., 2004, 69, 53–57 CrossRef.
- H. Tian, F. Li, L. Qin, H. Yu and X. Ma, J. Food Sci., 2014, 79, 2346–2353 CrossRef PubMed.
- D. Liu, S. Li, N. Wang, Y. Deng, L. Sha, S. Gai, H. Liu and X. Xu, J. Food Sci., 2017, 82, 1076–1082 CrossRef PubMed.
- D. Ansorena, O. Gimeno, I. Astiasaran and J. Bello, Food Res. Int., 2001, 34, 67–75 CrossRef.
- J. Toppe, S. Albrektsen, B. Hope and A. Aksnes, Comp. Biochem. Physiol., Part B: Biochem. Mol. Biol., 2007, 146, 395–401 CrossRef PubMed.
- Z. Yu, H. Jiang, R. Guo, B. Yang, G. You, M. Zhao and X. Liu, Food Res. Int., 2018, 108, 144–150 CrossRef PubMed.
- V. Stoeger, K. I. Liszt, B. Lieder, M. Wendelin, M. Zopun, J. Hans and V. Somoza, J. Agric. Food Chem., 2018, 66, 6762–6771 CrossRef PubMed.
- P. Tanyamon and B. Soottawat, RSC Adv., 2017, 7, 52423–52434 RSC.
- M. Abdollahi, M. Rezaei, A. Jafarpour and I. Undeland, Food Chem., 2017, 229, 695–709 CrossRef PubMed.
- W. Panpipat, M. Chaijan and S. Benjakul, Food Chem., 2010, 122, 1122–1128 CrossRef.
- H. Ding, X. Li, R. Li, S. Yi, Y. Xu, H. Mi and J. Li, J. Texture Stud., 2019, 50, 332–340 CrossRef.
- A. Elyasi, E. Zakipour Rahim Abadi, M. A. Sahari and P. Zare, Int. Food Res. J., 2010, 17, 915–920 Search PubMed.
- L. Liu, Y. Luo, Y. Song, H. Shen and H. Hong, J. Aquat. Food Prod. Technol., 2013, 22, 36–46 CrossRef.
- S. Chanarat and S. Benjakul, J. Sci. Food Agric., 2013, 83, 929–937 Search PubMed.
- R. Gu, X. Xiao, J. Sun, L. Shi and H. Yang, Int. J. Food Prop., 2018, 21, 1743–1754 CrossRef.
- J. Pan, H. Jia, M. Shang, C. Xu, H. Lian, H. Li and X. Dong, J. Texture Stud., 2018, 49, 578–585 CrossRef.
- H. Zhang, Y. Zhu, S. Chen, C. Xu, Y. Yu, X. Wang and W. Shi, Food Sci. Nutr., 2018, 6, 2079–2091 CrossRef.
- H. Jiang, M. Zhang, B. Bhandari and B. Adhikari, Food Rev. Int., 2018, 3, 1–24 Search PubMed.
- T. Tian, H. Yang, F. Yang, B. Li, J. Sun, D. Wu and J. Lu, LWT–Food Sci. Technol., 2018, 89, 542–550 CrossRef.
- R. Jin, R. Meng, H. Zhang, X. Yang and Z. Wu, Int. J. Food Sci. Technol., 2018, 53, 2045–2053 CrossRef.
- D. Klein, S. Maurer, U. Herbert, J. Kreyenschmidt and P. Kaul, Food Anal. Methods, 2018, 11, 88–98 CrossRef.
| This journal is © The Royal Society of Chemistry 2020 |

