 Open Access Article
Enhanced electrochemical performance of α-MoO3/graphene nanocomposites prepared by an in situ microwave irradiation technique for energy storage applications
P. Nagarajua,
M. Arivanandhan a,
A. Alsalme
 b,
A. Alghamdib and
R. Jayavel
 *a
*a
aCentre for Nanoscience and Technology, Anna University, Chennai-600 025, Tamil Nadu, India. E-mail: rjvel@annauniv.edu; Tel: +91-44-22358326
bDepartment of Chemistry, College of Science, King Saud University, P.O. Box 2455, Riyadh, Riyadh Province-11451, Saudi Arabia
First published on 16th June 2020
Abstract
Nanoparticles of α-molybdenum oxide (α-MoO3) are directly grown on graphene sheets using a surfactant-free facile one step ultrafast in situ microwave irradiation method. The prepared α-MoO3 and α-MoO3/G nanocomposites are analysed by different characterization techniques to study their structural, morphological and optical properties. Transmission electron microscope images reveal the intercalation of three dimensional (3D) α-MoO3 nanoparticles into 2D graphene sheets without any agglomeration. The electrochemical results exhibit improved performance for the α-MoO3/G composite electrode compared to pristine α-MoO3 owing to its structural superiority. The specific capacitance (Cs) values of the α-MoO3/G composite and pristine α-MoO3 are measured to be 483 and 142 F g−1 respectively at a current density of 1 A g−1. The α-MoO3/G composite maintains a very strong cyclic performance after 5000 cycles. The capacitance retention of the composite electrode shows stable behavior without any degradation confirming its suitability as an enduring electrode material for high-performance supercapacitor applications.
1. Introduction
Electrical energy constitutes the primary form of energy consumption and the most significant secondary energy source. However, energy storage provides well advanced methods for enhanced grid reliability applications and electrochemical energy storage/release is driven by electrons and ion charge–discharge. Among the different energy storage systems, electrochemical capacitors are considered to be very reliable for supercapacitor systems and conversion technologies, having high energy density and power density with lengthy cycle life compared to conventional capacitors and batteries. They can be used for various kinds of applications like security, hybrid vehicles and power back-up.1–3 Transition metal oxide (TMO) based supercapacitors exhibit much higher specific capacitance and lower electrochemical stability than the conventional carbon related materials and conducting polymers.4–6 Among them molybdenum trioxide (MoO3) has fascinated with unique properties such as low cost, non-toxicity, high electrochemical activity and better environmental safety than other transition metal oxides.7 It has rich polymorphism, structural flexibility and rigid two dimensional (2D) layered structures. The MoO3 can be categorized into three polymorphs such as (i) orthorhombic (α-MoO3), (ii) monoclinic (m-MoO3) and (iii) hexagonal (h-MoO3).8 The orthorhombic crystal system is thermodynamically more stable and highly desirable phase owing to its double layer structure and anisotropic growth.9 This layer of α-MoO3 simplifies the intercalation of outer ions between binary layers, which are significant for supercapacitor performance.10,11 However, the lack of electrical conductivity and structural reliability under the electrochemical reaction will affect the charge–discharge rate and the long-term cyclic stability of the device.12 The commercial application of α-MoO3 for supercapacitor construction is restricted owing to poor electrical conductivity and oxidation and reduction process with narrow potential window.13 To increase the electrical conductivity, stability and specific capacitance, α-MoO3 can be decorated or doped with various materials.Graphene has gained considerable attention as the champion material with two-dimensional (2D) carbon layers for powerful energy devices because of its high electrical conductivity, flexibility, mechanical strength, high chemical stability and broader electrochemical window.14–19 However, graphene composed of stacked layers tends to be restacked into “graphite” due to the strong van der Waal's attraction during the synthesis process, which leads to small penetration of electrolyte into graphene sheets restricting the active surface area.20 The metal oxide/graphene composites reveal higher specific capacitance with enhanced rate capability, outstanding electrochemical stability and higher energy density at low scan rate.21 The overall specific capacitance of the nanocomposite exceeds the values of graphene and metal oxide, indicating a positive synergistic effect of both metal oxide and graphene with improved the electrochemical properties.
Recently, attempts have been made to synthesis metal oxide/graphene composites as electrode materials for supercapacitors. Several groups have reported MoO3/graphene composites, such as MoO3 nanodots deposited on multiwalled carbon nanotubes,22 MoO3/PANI coaxial heterostructure nanobelts,23 MoO3-x nanobelt/carbon nanotube24 and MoO3-GAs hybrids25 for supercapacitor electrodes. For the preparation of α-MoO3/graphene composite surfactants were commonly used, which leads to reduced specific surface area for the composite by restricting the absorption of ions on the surface.8,26 The α-MoO3/graphene composite, without the surfactant, provides the most effective transport path for the transfer of ions between electrode materials, to improve the supercapacitor performance. The MoO3/graphene can also enhance the cyclic stability and power density of the supercapacitor. In most of the literature α-MoO3/graphene nanocomposite has been prepared by conventional methods such as hydrothermal and sonochemical methods; however, these methods are time-consuming and difficult to control the morphology. Whereas, in situ microwave method can be used as an efficient method, which leads to rapid heating to achieve the desired temperature in a short time and boosts the reaction mobility.27 Microwave irradiation method is adopted in industries as well as in domestic applications owing to the efficient and fast transfer of energy and influence on the size, shape and morphology of the prepared material. This technique provides single step, non-toxic, high yield for the preparation.28–30 Facile and inexpensive preparation methods are to be envisaged to synthesize α-MoO3/graphene to achieve good specific capacitance for supercapacitor applications. Compared with conventional methods, microwave preparation method raps off all limitations and improves the characteristics of the synthesized materials. However, the in situ microwave method is rarely used to synthesis α-MoO3/graphene nanocomposite. Therefore in the present work, α-MoO3/graphene nanocomposites have been synthesized via an in situ microwave irradiation technique without using any surfactant. The electrodes prepared by this technique possess improved electrochemical properties with longer cyclic stability. The higher values of energy density and power density with promising coulombic efficiency reveal that the composites can be used as potential electrodes for asymmetric supercapacitor applications.
2. Experimental
2.1 Preparation of MoO3/G nanocomposite and electrode material
The modified Hummer's method was followed to synthesize graphene oxide (GO) from natural graphite powder.30 For the preparation of composite by microwave irradiation method, 80 mg of graphene oxide was mixed in distilled water through ultra-sonication for 2 h to attain the homogeneous solution. To this solution 0.1 M of hexa-ammonium molybdate tetrahydrate ((NH4)6Mo7O24·4H2O) was added. After stirring for 30 min, 3 ml HCl solution was added drop-wise with continuous stirring. The obtained solution was transferred to the microwave oven maintained at 850 W for 5 min. with this mixture 3 ml of H2O2 was added and stirred for 10 min. The centrifugation followed by washing with water and ethanol yielded the product, which was vacuum heated for 12 h. The crystallinity of the product was improved by annealing at 650 °C for 3 h.For electrochemical studies, a three electrode configuration was used. The working electrode was prepared by mixing the α-MoO3/graphene composite, Nafion and ethanol in the weight ratio of 8![[thin space (1/6-em)]](https://www.rsc.org/images/entities/char_2009.gif) :
:![[thin space (1/6-em)]](https://www.rsc.org/images/entities/char_2009.gif) 1
1![[thin space (1/6-em)]](https://www.rsc.org/images/entities/char_2009.gif) :
:![[thin space (1/6-em)]](https://www.rsc.org/images/entities/char_2009.gif) 1. For the fabrication of asymmetric two electrode cell, α-MoO3/G material was mixed with activated carbon and polyvinylidene fluoride (PVDF) binder in the ratio of 8
1. For the fabrication of asymmetric two electrode cell, α-MoO3/G material was mixed with activated carbon and polyvinylidene fluoride (PVDF) binder in the ratio of 8![[thin space (1/6-em)]](https://www.rsc.org/images/entities/char_2009.gif) :
:![[thin space (1/6-em)]](https://www.rsc.org/images/entities/char_2009.gif) 1
1![[thin space (1/6-em)]](https://www.rsc.org/images/entities/char_2009.gif) :
:![[thin space (1/6-em)]](https://www.rsc.org/images/entities/char_2009.gif) 1. This was mixed with N-methyl-1-2 pyrrolidone (NMP) and pasted onto a nickel plate current collector (1 × 1 cm2) and dried for 4 h at 120 °C. The electrodes were prepared with mass loading of 6 mg cm−2 using PTFE membrane as the separator.
1. This was mixed with N-methyl-1-2 pyrrolidone (NMP) and pasted onto a nickel plate current collector (1 × 1 cm2) and dried for 4 h at 120 °C. The electrodes were prepared with mass loading of 6 mg cm−2 using PTFE membrane as the separator.
2.2 Characterization studies
Powder XRD analysis using Miniflux-Rigaku diffractometer confirmed the crystalline nature. The presence of functional groups was examined by FTIR spectroscopy using Alfa Bruker FTIR spectrophotometer. Morphology of the composite was analysed by SEM (TESCAN, VEGA3) and TEM (JEOL-JEM-2100F). The binding nature of the composite was studied by Raman Spectroscopy (HR micro Raman system). Thermogravimetry analysis (TGA) was carried out using SII-TG/DTA 6300 thermal analyzer under N2 atmosphere. The Brunauer–Emmett–Teller (BET) surface area of the nanocomposite was estimated using Quantachrome Instruments (version 6.0). XPS was used to analyse the electronic states of the samples using Shimadzu ESCA 3400 spectrometer. The prepared electrodes were analysed by cyclic voltammetry (CV), chronopotentiometry (CP) and electrochemical impedance spectroscopy (EIS) using the electrochemical workstation (Biologic VMP3).3. Results and discussion
3.1 Morphology studies
The schematic of formation mechanism of nanocomposites is shown in Fig. 1. Hydrolysis of starting material ((NH4)6Mo7O24·4H2O) along with graphene oxide (GO) in the presence of hydrogen hydrate accompanied by microwave irradiation synthesis leads to the formation of MoO3/graphene nanocomposite.The SEM results reveal that graphene sheets were composed of a few thin layers as depicted in Fig. 2(a) and (b). The composite consisted of large-scale α-MoO3 nanoparticles randomly formed on the surface of the wrinkled graphene sheets. The images confirmed that α-MoO 3 nanoparticles adhered to the G-surface was positioned at the folds of the bulge.31–33 The above inference reveals that the α-MoO3 was intercalated/anchored into G-layers through strong covalent bonding with carbon structures, which controlled the re-stacking of G during the reduction process. Fig. 2(c) shows the HR-TEM image of α-MoO3/G nanocomposite after annealing at 450 °C with crinkles and continuous area, which appears as a transparent thin film. The results provide strong evidence for 2D graphene sheets decorated with 3D α-MoO3 nanoparticles. Fig. 2(d) shows HR-TEM image, which provides direct proof for strong interfacial interaction between α-MoO3 nanoparticles and graphene sheets. Furthermore, G-sheets can prevent α-MoO3 nanoparticles from agglomeration enabling good dispersion over the surface. The HR-TEM image shows an average particle size of 64 nm for MoO3 in the composite. The high-resolution image (Fig. 2(e)) displays the lattice spacing of 0.32 nm corresponding to the (021) plane. Fig. 2(f) displays the FFT image, confirming the strong crystalline nature of orthorhombic α-MoO3 nanoparticles. The intercalation and anchoring of α-MoO3 into the graphene surface allow fast ion transport, which in-turn improves the electrochemical performance of nanocomposite.
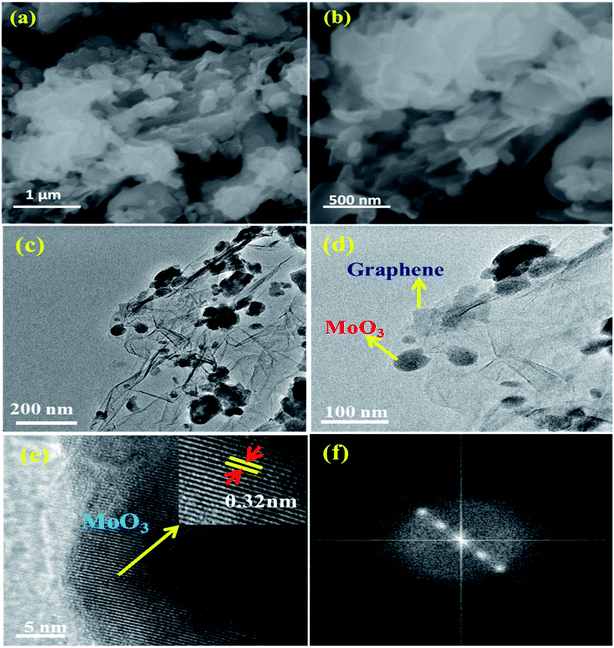 | ||
| Fig. 2 SEM images (a and b) of α-MoO3/G composite and HRTEM images (c and d) of α-MoO3/G nanocomposite, (e) lattice fringe pattern of α-MoO3 nanoparticles and (f) FFT image of the nanocomposite. | ||
3.2 Structural characterization
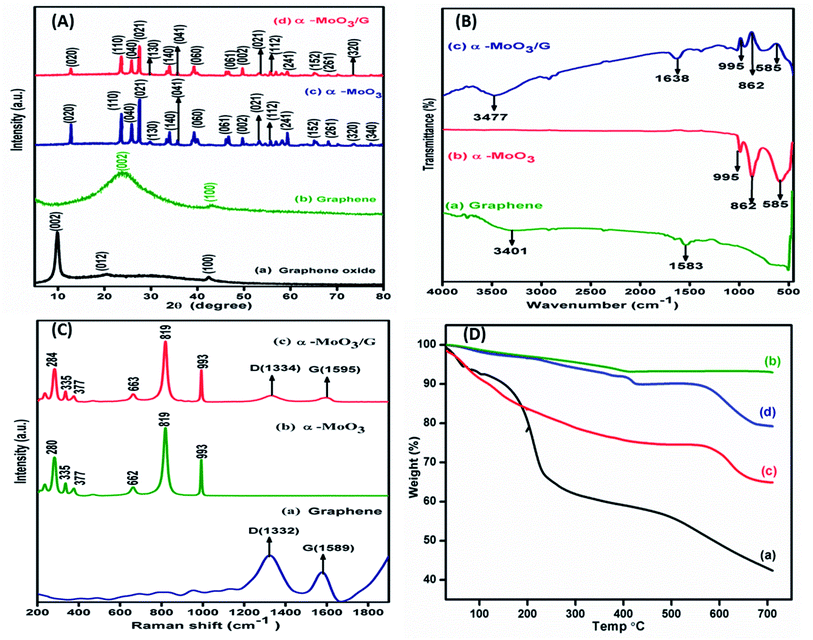
Powder X-ray diffraction patterns of GO, G, α-MoO3 and α-MoO3/G are shown in Fig. 3A. XRD patterns of GO and G exhibited two prominent peaks at 2θ values of 10.50, 42.25 and 25.60, 43.40 respectively as depicted in Fig. 3A(a) and (b) corresponding to (002) and (100) diffraction planes. The diffraction peaks very well match with JCPDS No. 05-0508, which ensured the hexagonal crystal structure of graphene with sp2 hybridized carbon atoms.8,34,35 Fig. 3A(c) and (d) shows XRD patterns of α-MoO3 nanoparticles with peaks located at 12.5°, 23.3°, 25.6°, 27.2°, 29.6°, 34.4°, 35.3°, 39.24°, 46.7°, 49.6°, 54.5°, 55.6°, 59.2°, 65.0°, 68.1°, 73.6° and 77.24° representing (020), (110), (040), (021), (130), (140), (041), (060), (061), (002), (221), (112), (241), (152), (261), (320) and (340) diffraction planes respectively. The peaks were indexed to orthorhombic structure of α-MoO3, (JCPDS. No. 89-5108). The absence of GO peak at the 2θ value of 10.50° strongly supports that GO was transformed to G during the synthesis process. The characteristic peak of G (25.4°) was not perceived in the XRD pattern of the α-MoO3/G nanocomposite due to the overlap of α-MoO3 peak at 25.6°. The presence of peaks corresponding to α-MoO3 in the composite confirmed the formation of α-MoO3/G nanocomposite. The measured crystallite size values from the XRD analysis are 68.5 nm and 34.3 nm for α-MoO3 and α-MoO3/G respectively. The reduced crystallite size of α-MoO3/G nanocomposite is favourable for better electrochemical performance.3.3 FTIR spectral studies
FTIR studies carried out to elucidate the functional groups of graphene, α-MoO3 and α-MoO3/G nanocomposite are shown in Fig. 3B. The absorption at 1583 cm−1 denoted the strong aromatic ring C![[double bond, length as m-dash]](https://www.rsc.org/images/entities/char_e001.gif) C due to graphitic formation as depicted in Fig. 3B(a). Besides, the wide peak at 3401 cm−1 might be due to the O–H stretching vibration of adsorbed water molecules. Fig. 3B(b) exhibits three emblematic peaks at 995, 862, 585 cm−1 characteristics of α-MoO3 nanoparticles. The peaks at 995 and 862 cm−1 are assigned to the Mo
C due to graphitic formation as depicted in Fig. 3B(a). Besides, the wide peak at 3401 cm−1 might be due to the O–H stretching vibration of adsorbed water molecules. Fig. 3B(b) exhibits three emblematic peaks at 995, 862, 585 cm−1 characteristics of α-MoO3 nanoparticles. The peaks at 995 and 862 cm−1 are assigned to the Mo![[double bond, length as m-dash]](https://www.rsc.org/images/entities/char_e001.gif) O bond of α-MoO3 phase32 and doubly coordinated oxygen (Mo2–O) stretching mode. The bending vibration of the Mo–O–Mo entity was assigned to the band at 585 cm−1, whereas the oxygen ions were distributed over three Mo–O octahedrons in 3D structure.33 Fig. 3B(c) shows the α-MoO3/G composite peak at 3477 cm−1 representing O–H stretching vibration of absorbed water molecules. The absorption band appeared at 1638 cm−1 can be assigned to the aromatic C
O bond of α-MoO3 phase32 and doubly coordinated oxygen (Mo2–O) stretching mode. The bending vibration of the Mo–O–Mo entity was assigned to the band at 585 cm−1, whereas the oxygen ions were distributed over three Mo–O octahedrons in 3D structure.33 Fig. 3B(c) shows the α-MoO3/G composite peak at 3477 cm−1 representing O–H stretching vibration of absorbed water molecules. The absorption band appeared at 1638 cm−1 can be assigned to the aromatic C![[double bond, length as m-dash]](https://www.rsc.org/images/entities/char_e001.gif) C stretching vibration mode. The graphene absorption band at 1583 cm−1 is red shifted to 1638 cm−1 in the composite, which confirmed the formation of α-MoO3 with graphene. Strong α-MoO3 peaks are present in the composite.
C stretching vibration mode. The graphene absorption band at 1583 cm−1 is red shifted to 1638 cm−1 in the composite, which confirmed the formation of α-MoO3 with graphene. Strong α-MoO3 peaks are present in the composite.
3.4 Raman studies
Raman spectra of graphene with D and G band positions at 1332 cm−1 and 1589 cm−1 are shown Fig. 3C(a). The spectrum of α-MoO3 Fig. 3C(b) displays sharp peaks located at 662, 819 and 993 cm−1 corresponding to the stretching vibrations of n(O–Mo), n(O–Mo2), n(O–Mo3).36 The asymmetric stretching peak at 993 cm−1 is ascribed to unshared oxygen (Mo6+![[double bond, length as m-dash]](https://www.rsc.org/images/entities/char_e001.gif) O). Symmetric stretching peak at 819 cm−1 is attributed to doubly coordinated oxygen (Mo–O–Mo) stretching mode. The stretching point at 662 cm−1 is due to triply organized oxygen (O(3)–Mo) anti-symmetric stretching.37 Additional peaks located at 280, 335, 377 cm−1 are characteristics of α-MoO3. The strong intensity peaks of terminal M
O). Symmetric stretching peak at 819 cm−1 is attributed to doubly coordinated oxygen (Mo–O–Mo) stretching mode. The stretching point at 662 cm−1 is due to triply organized oxygen (O(3)–Mo) anti-symmetric stretching.37 Additional peaks located at 280, 335, 377 cm−1 are characteristics of α-MoO3. The strong intensity peaks of terminal M![[double bond, length as m-dash]](https://www.rsc.org/images/entities/char_e001.gif) O bonds (993 and 819 cm−1) specify oxygen vacancy during the microwave treatment of α-MoO3/G nanocomposite.38 Fig. 3C(c) shows the spectrum of α-MoO3/G nanocomposites with clear D and G bands. The G band (1595 cm−1) in the composite exhibited red shift compared with G band of graphene (1589 cm−1), revealing the transformation of GO to G during the microwave treatment process, which was also confirmed by XPS and FT-IR results.
O bonds (993 and 819 cm−1) specify oxygen vacancy during the microwave treatment of α-MoO3/G nanocomposite.38 Fig. 3C(c) shows the spectrum of α-MoO3/G nanocomposites with clear D and G bands. The G band (1595 cm−1) in the composite exhibited red shift compared with G band of graphene (1589 cm−1), revealing the transformation of GO to G during the microwave treatment process, which was also confirmed by XPS and FT-IR results.
3.5 Thermogravimetry analysis
Thermal stability of as-prepared GO, G, α-MoO3 and α-MoO3/G nanocomposite was investigated by TGA analysis in air atmosphere. TGA curves showed in Fig. 3D exhibits three steps of weight degradation. In all samples the initial weight loss observed in the temperature range from 30 to 150 °C, is ascribed to desorption of physically adsorbed water molecules. In Fig. 3D(a) the carboxyl and hydroxyl groups present in the GO were responsible for the as the second weight loss at 150–250 °C. Further increasing the temperature, gradual weight loss was perceived upto 700 °C. Fig. 3D(b) shows that the G attained gradual weight loss at temperature above 150 °C and a small weight reduction due to the thermal decay of the carbon skeleton upto 700 °C. Fig. 3D(c) and (d) represents the second weight reduction observed between 200 to 250 °C owing to the nitrates and ammonia decay. The subsequent reduction at 450 °C was due to the dehydration and de-ammonization process, where the meta-stable hexagonal MoO3 undergoes irreversible phase transition to highly thermodynamically stable orthorhombic structure.39 The curves show linear plateaus from 350 to 550 °C followed by a strong reduction owing to the removal of α-MoO3 fragments beyond 600 °C.8 The total weight loss for the α-MoO3/G nanocomposite (19%) is higher compared to G (4%) but lower than the GO (65%) and pure α-MoO3 (35%). The difference in weight loss was due to the reduction of GO to G, which has significant influence in enhancing the thermal stability.3.6 Electronic states
Fig. 4(a) depicts the wide-scan survey spectra of the α-MoO3/G nanocomposite, which contains Mo, C, and O elements. The peaks at 233.7, 284.3, 399.7, 416 and 530 eV correspond to Mo 3d, C 1s, Mo 3p3/2, Mo 3p1/2 and O 1s respectively, were observed in α-MoO3/G composite. Fig. 4(b) shows the deconvoluted Gaussian 3d peak of Mo and the corresponding oxidation state of Mo. The deconvolution peaks at 232.0 and 235.1 eV match with the 3d5/2 and 3d3/2 of Mo6+ oxidation states which are in agreement with the binding energy of Mo orthorhombic structure. The XPS results confirm that α-MoO3 nanoparticles are intercalated/anchored on the surface of G.26 Fig. 4(c) shows three deconvoluted Gaussian peaks of α-MoO3/G composite centered at C 1s peak containing various oxygen-functional groups like carbonyl groups (C![[double bond, length as m-dash]](https://www.rsc.org/images/entities/char_e001.gif) O) at 287.2 eV, epoxy/ether groups (C–O) at 286 eV, and non-oxygenated C–C/C
O) at 287.2 eV, epoxy/ether groups (C–O) at 286 eV, and non-oxygenated C–C/C![[double bond, length as m-dash]](https://www.rsc.org/images/entities/char_e001.gif) C at 284.9 eV. The deconvoluted Gaussian peaks of the O 1s spectrum can be divided into two binding states of 529.56 and 531.12 eV as depicted in Fig. 4(d).
C at 284.9 eV. The deconvoluted Gaussian peaks of the O 1s spectrum can be divided into two binding states of 529.56 and 531.12 eV as depicted in Fig. 4(d).
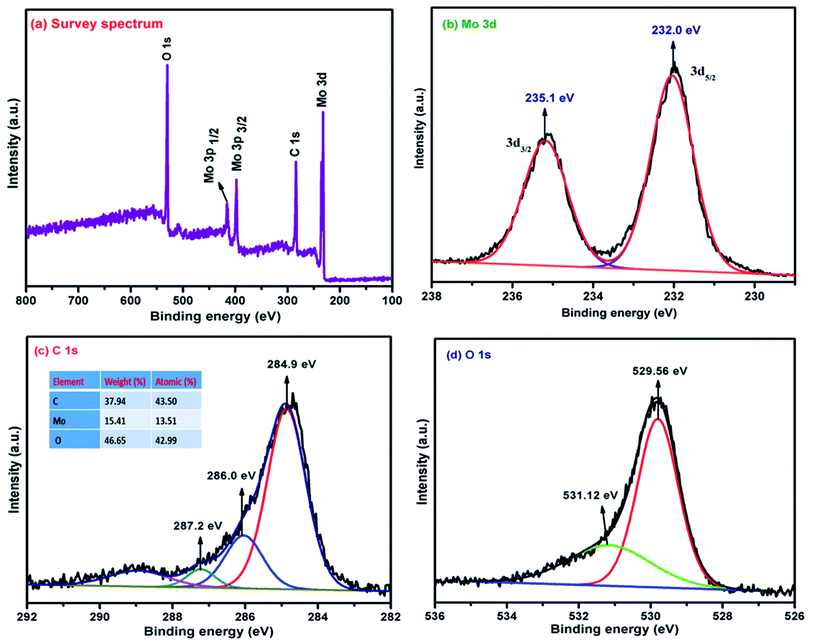 | ||
| Fig. 4 XPS spectra of α-MoO3/G composite (a) survey spectrum (b) deconvolution spectra of Mo 3d (c) C 1s and (d) O 1s. | ||
3.7 BET studies
The prepared α-MoO3/G nanocomposites and α-MoO3 nanoparticles were characterized for N2 adsorption–desorption isotherms using BET analysis. The isotherm curves of α-MoO3/G nanocomposites and α-MoO3 nanoparticles illustrated type IV isotherm and were associated to the mesopores structure. The specific surface area of the composite and α-MoO3 nanoparticles was calculated to be 21.65 and 12.43 m2 g−1 with pore volumes of 0.036 and 0.076 cm3 g−1, respectively. Moreover, the pore size distribution from the BJH result demonstrates that the composite and pure α-MoO3 consists of porous structure with pore size of 5.7 and 8.9 nm as displayed in Fig. 5(b). The large surface area with porous structure of composite electrode provides additional access points to the electrolyte to have large volume change making it easier for effective charge-exchange at the electrode/electrolyte interface.40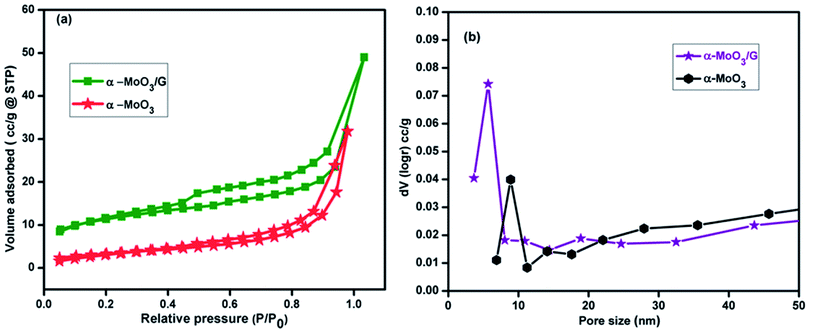 | ||
| Fig. 5 (a) N2 adsorption–desorption isotherm curves and (b) BJH curves of pore size distribution of α-MoO3 and α-MoO3/G at 77 K. | ||
3.8. Electrochemical studies
Cyclic voltammetry performance of α-MoO3 and α-MoO3/G nanocomposites was investigated in the voltage window from 0.0 to 1.0 V using three electrodes system in 1 M aqueous solution H2SO4 as illustrated in the Fig. 6. The CV curves of the α-MoO3 electrode recorded at various sweep rates of 5, 10, 25, 50, 75 and 100 mV s−1 at room temperature are depicted in Fig. 6(a). The CV curves of pure α-MoO3 shows nearly rectangular shape, signifying the EDLC behavior.41 The integral area of the CV curves increases with increasing sweep rates. The CV arcs at 100 mV s−1 with slight distortion from rectangular shape compared to 5 mV s−1 may be due to the kinetics of ion transport mechanism in the electrode material and the small quantity of ions adsorption/desorption at the electrode/electrolyte interface.42 However, reduced area of the CV curve reveals that the capacitance of α-MoO3 is limited. Fig. 6(b) displays the CV arcs of α-MoO3/G electrode exhibiting nearly rectangular shape with no redox peak, implying an ideal-capacitive behavior. Shape of the CV arcs was not altered with increasing scan rates, which manifests the fast charge/discharge kinetics and excellent reversibility. With increasing sweep rates, area of the CV has increased and at the higher sweep rate, the charge diffusion could not maintain the difference in the electric field, resulting in lower specific capacitance. No redox peak is observed in the CV curves for all scan rates, suggesting that the electrode is charged and discharged at a pseudo-constant rate over the complete voltammetric cycle. The CVs are nearly rectangular for the composite, indicating the fast charging/discharging processes.43 The CV arcs for α-MoO3 and α-MoO3/G composites at a sweep rate of 5 mV s−1 are compared in Fig. 6(c). The area of the CV arcs for the composite was higher than the pure α-MoO3 electrode. The high electrical conductivity of G combined with α-MoO3 nanoparticles effectively increases the conducting pathways for the ions and reduced EDL capacitance, thus increasing the integral area of CV for the α-MoO3/G electrode. In addition, composite displays large contact area for the electrolyte ions, which increases the capacitance by reducing the distortion. The synergistic effect of the complementary properties of both the metal oxide and the graphene improved the specific capacitance of the α-MoO3/G.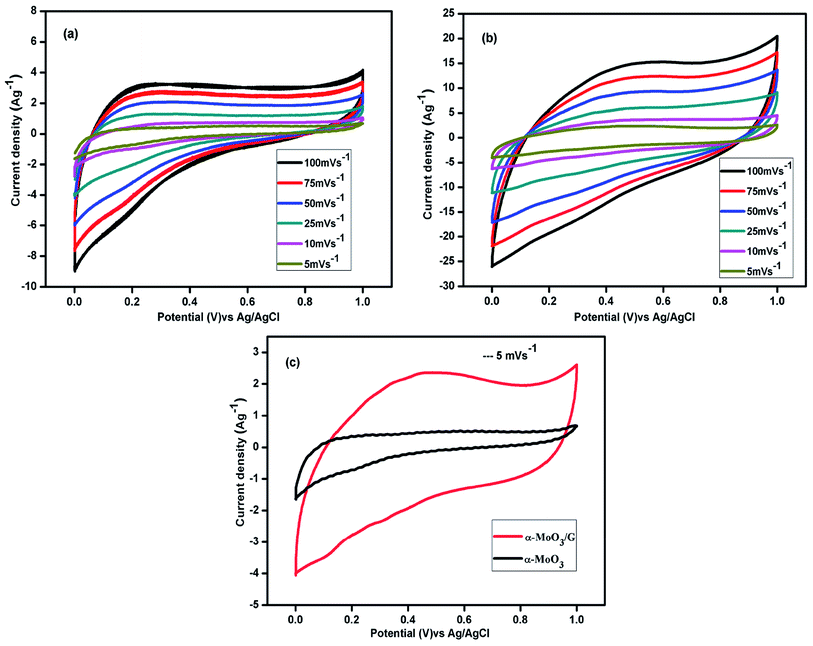 | ||
| Fig. 6 Cyclic voltammetry curves of (a) α-MoO3, (b) α-MoO3/G composite electrode at different scan rates. (c) Comparison of CV of α-MoO3, and α-MoO3/G composite at a scan rate of 5 mV s−1. | ||
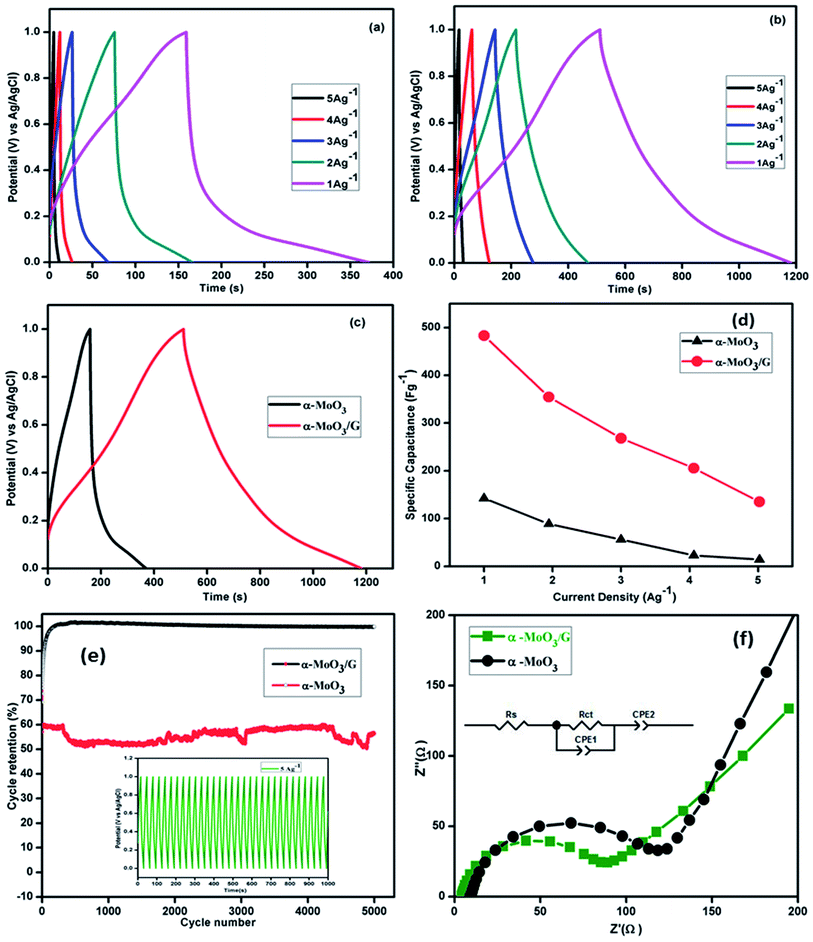
Fig. 7(a) depicts the charge–discharge curves of α-MoO3 at different current densities ranging from 1 to 5 A g−1 with 1 M H2SO4 electrolyte in the potential range 0–1.0 V. The charge–discharge results represent nearly symmetric and triangular shape without internal resistance (IR) drop. Due to the excess of charge at the interface, a gradual increase in the discharge time occurs with reducing current density. Solvated ions might reduce the actual surface area of the aggregated nanoparticles and reduce the charge–discharge period of pristine α-MoO3 nanoparticles. Charge–discharge curves of α-MoO3/G shown in Fig. 7(b) were identical and nearly symmetrical, suggesting a higher reversibility owing to the existence of both EDLC and pseudocapacitance behavior of the electrodes for the fast charge–discharge process. With increasing current density, the charge–discharge response time increases without any significant variation in the shape of CP curves, representing the better rate performance. No IR drop was observed during the discharge confirming the higher electrical conductivity of α-MoO3/G composite. The comparison of CP curves of two electrodes at a constant current density of 1 A g−1 is shown in Fig. 7(c). The charge–discharge time of α-MoO3/G electrode was much faster than the α-MoO3 electrode. The charge storage process has been improved by the intercalation of α-MoO3 ions on the graphene surface.12,44 The composite electrode exhibited lower internal resistance due to higher dual capacitive behavior. The specific capacitance (Cs) was calculated from CP curves using the relation:
| Cs = I × Δt/m × ΔV | (1) |
| Electrode material | Preparation technique | Specific capacitance (F g−1) | Number of cycles | Cyclic retention | Energy density (W h kg−1) | Power density (kW kg−1) | Ref. |
|---|---|---|---|---|---|---|---|
| α-MoO3/G | Hydrothermal | 360.00 | 1000 | 100% | — | — | 8 |
| Graphene/MoO3 | Hydrothermal | 362.32 | 10 | — | — | — | 26 |
| MoO3/rGO | Hydrothermal | 486.00 | 1000 | 92% | — | — | 46 |
| MoO3/carbon cloth | Magnetron sputtering | 240.00 | 5000 | 78.8 | — | — | 47 |
| MoO3-rGO | Microwave | 543.00 | 4000 | 85 | 36.2 | 0.535 | 29 |
| MoO3/GO/MWCNTs/G | Electrodeposition technique | 473.00 | 2000 | 86.8 | — | — | 48 |
| Molybdenum oxide/graphene aerogel | Hydrothermal | 148.00 | 5000 | 82 | 51.91 | 0.838 | 49 |
| α-MoO3/graphene | In situ microwave irradiation | 483.00 | 5000 | 100% | 12.35 | 2.67 | Present work |
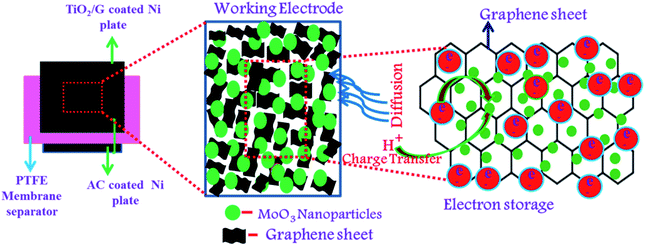
The variation of specific capacitance values with current density obtained from the CP curves are shown in Fig. 7(d). The specific capacitance values decrease with increasing current density, owing to slow rate of the redox reaction. At high current density, the diffusion of ions into the pores of the electrode material is controlled by the electrode surface. Additionally, the α-MoO3 nanoparticles support the short diffusion path lengths of electrolyte ions in the vertical direction and provide the transport pathways for electrons in parallel and potentially tailor the gap between each graphene layer to allow more electrolyte ions to penetrate into the composite material.50 The retention of the composite electrode material studied from CP analysis for 5000 cycles is depicted in Fig. 7(e). The capacitance of the composite increases with increasing cycles and attained 100% cyclic retention upto 5000 cycles. However, the pristine α-MoO3 electrode shows retention of 60% for the same current density. The cyclic retention of composite electrode was higher than α-MoO3 nanoparticle based electrodes due to tightly attached stable layered structure of α-MoO3 nanoparticles with G sheets. The porosity and large surface area of graphene provide large amount of stored charges and ensure the fast transport of ions during charging/discharging process. The 2D structure of graphene is physically and chemically stable for the multiple intercalation/deintercalation that provides long cycle lifetime. It is proposed that the graphene supports in two aspects for the higher specific capacitance and longer cycle life for α-MoO3 composites. First, the graphene sheets serve as a conductive matrix to promote fast faradaic charging and discharging of α-MoO3 nanoparticles. Second, the graphene inhibits aggregation of α-MoO3 nanoparticles, preserving the high surface area interface between the α-MoO3 nanoparticles and the electrolyte.51
The mechanical stability of the α-MoO3/G composite is due to the fact that the electrochemical double layer capacitance has higher retention than the pseudocapacitance.51 The inset in Fig. 7(e) shows a few charge–discharge cycles of α-MoO3/G electrode material. The coulombic efficiency (η) of the composite electrode was estimated from CP curves using the relation,
| η = (td/tc) × 100 | (2) |
Electrochemical impedance spectra of α-MoO3 and α-MoO3/G electrode material analyzed using 1 M H2SO4 aqueous electrolyte in the frequency range from 43 kHz to 5 Hz are displayed in Fig. 7(f). Both the spectra exhibit semicircle at higher frequency region and conventional line at low frequency region. Randles equivalent circuit shows the best fit for the experimental data as shown in the inset of Fig. 7(f). The semicircle at high frequency region explains the charge-transfer limiting process due to the double-layer capacitance (Cdl) in parallel with the charge transfer resistance (Rct) at the interface between the electrode and electrolyte.29,48 The solution resistance (Rs) values of α-MoO3 and α-MoO3/G are 9.9 Ω and 4.3 Ω respectively. The charge transfer resistance (Rct) value of α-MoO3 nanoparticles is 106.1 Ω and for α-MoO3/G nanocomposite the value is 72.1 Ω. The lower Rct value of composite indicates high conductivity and enhanced charge transportation due to the presence of G. The lower value of charge transfer resistance suggests that the composite improves the rate of charge transfer and thereby enhancing the electrochemical performance. The graphene facilitates the electronic conductive paths and enhanced charge/discharge time, rate performance and cyclic stability for composite material.52
3.9 Electrochemical cell
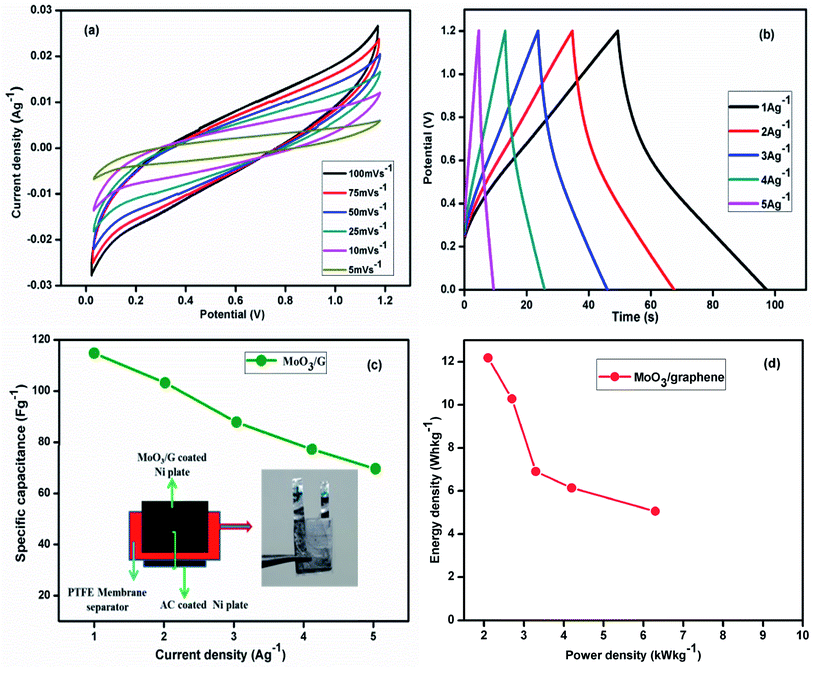
The CV performance of actual two electrode cell assembled with α-MoO3/G and activated carbon at different sweep rates is displayed in Fig. 8(a). The current response increased with increasing sweep rates without the redox peak at all sweep rates. At higher sweep rate of 100 mV s−1, no distortion was observed indicating the high rate capability and good capacitive behavior with low contact resistance. The stable electrochemical response was attributed to the higher electrical conductivity and electron transport pathway generated by the graphene sheets. CP curves of the composite electrode were recorded at various current density values as depicted in Fig. 8(b).The capacitance of the cell was measured using the relation53
| Csc = 4 × C/m | (3) |
| E = I × Id × td/W | (4) |
| P = I × Id/W | (5) |
4. Conclusion
Highly efficient supercapacitive α-MoO3/graphene composite electrode was prepared by simple, cost-effective and environmental friendly microwave irradiation technique. The α-MoO3/G composite electrodes possess higher specific capacitance than pristine α-MoO3 electrodes and exhibit superior supercapacitor performance with longer cyclic stability and coulombic efficiency. The combination of α-MoO3 and graphene is proved to be a better electro-active material for supercapacitor applications with higher energy density and power density.Conflicts of interest
There are no conflicts to delcare.Acknowledgements
The authors would like to acknowledge the Researchers Supporting Project (RSP-2020/78), King Saud University, Riyadh, Saudi Arabia. The author PN, gratefully acknowledges the University Grants Commission, Government of India for the award of the Rajiv Gandhi National Fellowship to carry out this work (F1-17.1/2015-17/RGNF-2015-17-SC-TAM-23248).Reference
- K. Chen, C. Sun and D. Xue, Phys. Chem. Chem. Phys., 2015, 17, 732–750 RSC
.
- Y.-B. An, S. Chen, M.-M. Zou, L.-B. Geng, X.-Z. Sun, X. Zhang, K. Wang and Y.-W. Ma, Rare Met., 2019, 38, 1113–1123 CrossRef CAS
.
- R. Wang, Q.-R. Wang, M.-J. Yao, K.-N. Chen, X.-Y. Wang, L.-L. Liu, Z.-Q. Niu and J. Chen, Rare Met., 2018, 37, 536–542 CrossRef CAS
.
- Z. Fan, J. Yan, T. Wei, L. Zhi, G. Ning, T. Li and F. Wei, Adv. Funct. Mater., 2011, 21, 2366–2375 CrossRef CAS
.
- H. Jiang, J. Ma and C. Li, Adv. Mater., 2012, 24, 4197–4202 CrossRef CAS PubMed
.
- Z. Wei, B. Ding, H. Dou, J. Gascon, X.-J. Kong, Y. Xiong, B. Cai, R. Zhang, Y. Zhou, M. Long, J. Miao, Y. Dou, D. Yuan and J. Ma, Chin. Chem. Lett., 2019, 30, 2110–2122 CrossRef CAS
.
- X. Zhang, X. Zeng, M. Yang and Y. Qi, ACS Appl. Mater. Interfaces, 2014, 6, 1125–1130 CrossRef CAS PubMed
.
- J. Zhou, J. Song, H. Li, X. Feng, Z. Huang, S. Chen, Y. Ma, L. Wang and X. Yan, New J. Chem., 2015, 39, 8780–8786 RSC
.
- L. Wang, X. Zhang, Y. Ma, M. Yang and Y. Qi, Mater. Lett., 2016, 164, 623–626 CrossRef CAS
.
- L. Noerochim, J.-Z. Wang, D. Wexler, Z. Chao and H.-K. Liu, J. Power Sources, 2013, 228, 198–205 CrossRef CAS
.
- L. Zhou, L. Yang, P. Yuan, J. Zou, Y. Wu and C. Yu, J. Phys. Chem. C, 2010, 114, 21868–21872 CrossRef CAS
.
- I. Shakir, M. Shahid, H. W. Yang and D. J. Kang, Electrochim. Acta, 2010, 56, 376–380 CrossRef CAS
.
- I. Shakir, M. Nadeem, M. Shahid and D. J. Kang, Electrochim. Acta, 2014, 118, 138–142 CrossRef CAS
.
- M. Wu, J. Liao, L. Yu, R. Lv, P. Li, W. Sun, R. Tan, X. Duan, L. Zhang, F. Li, J. Kim, K. H. Shin, H. Seok Park, W. Zhang, Z. Guo, H. Wang, Y. Tang, G. Gorgolis, C. Galiotis and J. Ma, Chem. - Asian J., 2020, 15, 995–1013 CrossRef CAS PubMed
.
- D. Wu, F. Zhang, H. Liang and X. Feng, Chem. Soc. Rev., 2012, 41, 6160–6177 RSC
.
- A. Moyseowicz and G. Gryglewicz, Composites, Part B, 2019, 159, 4–12 CrossRef CAS
.
- S. Qiu, R. Li, Z. Huang, Z. Huang, C. P. Tsui, C. He, X. Han and Y. Yang, Composites, Part B, 2019, 161, 37–43 CrossRef CAS
.
- D. Vikraman, K. Karuppasamy, S. Hussain, A. Kathalingam, A. Sanmugam, J. Jung and H.-S. Kim, Composites, Part B, 2019, 161, 555–563 CrossRef CAS
.
- J. M. Tarascon and M. Armand, Nature, 2001, 414, 359–367 CrossRef CAS PubMed
.
- M. Li, Z. Tang, M. Leng and J. Xue, Adv. Funct. Mater, 2014, 24, 7495–7502 CrossRef CAS
.
- R. B. Rakhi and H. N. Alshareef, J. Power Sources, 2011, 196, 8858–8865 CrossRef CAS
.
- L. S. Aravinda, U. Bhat and B. Ramachandra Bhat, Electrochim. Acta, 2013, 112, 663–669 CrossRef CAS
.
- F. Jiang, W. Li, R. Zou, Q. Liu, K. Xu, L. An and J. Hu, Nano Energy, 2014, 7, 72–79 CrossRef CAS
.
- X. Xiao, Z. Peng, C. Chen, C. Zhang, M. Beidaghi, Z. Yang, N. Wu, Y. Huang, L. Miao, Y. Gogotsi and J. Zhou, Nano Energy, 2014, 9, 355–363 CrossRef CAS
.
- K. Zhou, W. Zhou, X. Liu, Y. Sang, S. Ji, W. Li, J. Lu, L. Li, W. Niu, H. Liu and S. Chen, Nano Energy, 2015, 12, 510–520 CrossRef CAS
.
- B. Shatabda, D. Diptiman and K. S. Shyamal, J. Phys. D: Appl. Phys., 2015, 48, 145303 CrossRef
.
- P. Zhang, S. Yin and T. Sato, Appl. Catal., B, 2009, 89, 118–122 CrossRef CAS
.
- L.-Y. Meng, B. Wang, M.-G. Ma and K.-L. Lin, Mater. Today Chem., 2016, 1–2, 63–83 CrossRef
.
- B. J. Reddy, P. Vickraman and A. S. Justin, J. Mater. Sci.: Mater. Electron., 2019, 30, 3618–3628 CrossRef CAS
.
- P. Nagaraju, A. Alsalme, A. Alswieleh and R. Jayavel, J. Electroanal. Chem., 2018, 808, 90–100 CrossRef CAS
.
- T. Tao, Q. Chen, H. Hu and Y. Chen, Mater. Lett., 2012, 66, 102–105 CrossRef CAS
.
- X. Xia, Q. Hao, W. Lei, W. Wang, H. Wang and X. Wang, J. Mater. Chem., 2012, 22, 8314–8320 RSC
.
- J. Hu, A. Ramadan, F. Luo, B. Qi, X. Deng and J. Chen, J. Mater. Chem., 2011, 21, 15009–15014 RSC
.
- J. Ding, S. A. Abbas, C. Hanmandlu, L. Lin, C.-S. Lai, P.-C. Wang, L.-J. Li, C.-W. Chu and C.-C. Chang, J. Power Sources, 2017, 348, 270–280 CrossRef CAS
.
- S. Wang, H. Zhang, D. Zhang, Y. Ma, X. Bi and S. Yang, J. Mater. Chem. A, 2018, 6, 672–679 RSC
.
- D. Diaz-Droguett, R. El Far, V. Fuenzalida and A. Cabrera, Mater. Chem. Phys, 2012, 134, 631–638 CrossRef CAS
.
- Q. P. Ding, H. B. Huang, J. H. Duan, J. F. Gong, S. G. Yang, X. N. Zhao and Y. W. Du, J. Cryst. Growth, 2006, 294, 304–308 CrossRef CAS
.
- P.-J. Lu, M. Lei and J. Liu, CrystEngComm, 2014, 16, 6745–6755 RSC
.
- C. Angamuthuraj, N. S. Sanjini, S. Velmathi and A. Chandra Bose, Phys. Chem. Chem. Phys., 2013, 15, 14761–14769 RSC
.
- K. Palanisamy, Y. Kim, H. Kim, J. M. Kim and W.-S. Yoon, J. Power Sources, 2015, 275, 351–361 CrossRef CAS
.
- N. P. Lebedeva and G. J. M. Janssen, Electrochim. Acta, 2005, 51, 29–40 CrossRef CAS
.
- Y. Zhang, B. Lin, Y. Sun, P. Han, J. Wang, X. Ding, X. Zhang and H. Yang, Electrochim. Acta, 2016, 188, 490–498 CrossRef CAS
.
- A. Shinde Pragati, C. Lokhande Vaibhav, M. Patil Amar, T. Ji and D. Lokhande Chandrakant, Journal, 2017, 3, 35 Search PubMed
.
- W. Shaheen, M. F. Warsi, M. Shahid, M. A. Khan, M. Asghar, Z. Ali, M. Sarfraz, H. Anwar, M. Nadeem and I. Shakir, Electrochim. Acta, 2016, 219, 330–338 CrossRef CAS
.
- S. Ramesh, A. Kathalingam, K. Karuppasamy, H.-S. Kim and H. S. Kim, Composites, Part B, 2019, 166, 74–85 CrossRef CAS
.
- N. G. Prakash, M. Dhananjaya, A. L. Narayana, H. Maseed, V. V. S. S. Srikanth and O. M. Hussain, Appl. Phys. A: Mater. Sci. Process., 2019, 125, 488 CrossRef CAS
.
- D. Murugesan, S. Prakash, N. Ponpandian, P. Manisankar and C. Viswanathan, Colloids Surf., A, 2019, 569, 137–144 CrossRef CAS
.
- M. Faraji and A. Abedini, Int. J. Hydrogen Energy, 2019, 44, 2741–2751 CrossRef CAS
.
- K. Ghosh and C. Y. Yue, Electrochim. Acta, 2018, 276, 47–63 CrossRef CAS
.
- J. Chang, M. Jin, F. Yao, T. H. Kim, V. T. Le, H. Yue, F. Gunes, B. Li, A. Ghosh, S. Xie and Y. H. Lee, Adv. Funct. Mater., 2013, 23, 5074–5083 CrossRef CAS
.
- J. W. Lee, A. S. Hall, J.-D. Kim and T. E. Mallouk, Chem. Mater., 2012, 24, 1158–1164 CrossRef CAS
.
- H. Xia, D. Zhu, Z. Luo, Y. Yu, X. Shi, G. Yuan and J. Xie, Sci. Rep., 2013, 3, 2978 CrossRef PubMed
.
- V. Venkatachalam, A. Alsalme, A. Alswieleh and R. Jayavel, Chem. Eng. J., 2017, 321, 474–483 CrossRef CAS
.
| This journal is © The Royal Society of Chemistry 2020 |


