 Open Access Article
Creative Commons Attribution 3.0 Unported Licence
The effect of n–π* electronic transitions on the N2 photofixation ability of carbon self-doped honeycomb-like g-C3N4 prepared via microwave treatment
Xuelei Liab,
Jinfeng Bai *a,
Jiaqi Lib,
Chao Lia,
Xiangyun Zhonga and
Shuping Deng*b
aSchool of Chemical Engineering, University of Science and Technology Liaoning, Anshan, 114051, China. E-mail: baijinfeng2002@163.com
bDepartment of Chemistry and Environmental Engineering, Yingkou Institute of Technology, Bowen Road, Yingkou, 115014 China. E-mail: 15242339645@163.com
First published on 17th February 2020
Abstract
Light harvesting is an important part of the photocatalysis process. In this work, carbon self-doped honeycomb-like g-C3N4 with outstanding N2 photofixation ability was prepared via microwave treatment. XRD, N2 adsorption, UV-Vis, SEM, XPS, ESR and PL were used to characterize the as-prepared catalysts. Combining the carbon self-doping with microwave treatment, the n–π* transition was successfully stimulated. The remarkable red shift of absorption edge from 465 nm to near 600 nm was observed, leading to the obviously promoted visible light absorption. The synergy effect of carbon doping and microwave treatment also enhances the surface area and separation efficiency of electron–hole pairs. The as-prepared catalyst displays the highest NH4+ concentration of 5.3 mg L−1 gcat−1, over 11 times higher than that of neat g-C3N4, as well as excellent photocatalytic stability. DFT calculation was also used to further prove our point of view. This paper provides a new way for the construction of high efficiency photocatalysts.
Introduction
Artificial nitrogen fixation has become the second most important chemical reaction after photosynthesis. The traditional Haber–Bosch process is not in line with the standards of the contemporary chemical industry due to its high energy consumption, high risk and strong pollution characteristics. Therefore, finding a more energy-efficient, environmentally friendly and low-risk nitrogen fixation process is a hot topic in the scientific community.Since the birth of life on Earth, it has survived mainly with the energy provided by the Sun. With the decline of fossil fuels, solar energy has become an important part of human energy use and has been continuously developed. Photocatalytic reaction is one of the ways to use solar energy.1–4 Its core mission is to find effective photocatalysts that can work stably for a long time under ultraviolet/visible light. So far, hundreds of photocatalysts have been reported one after another. Among them, graphite phase carbon nitride (g-C3N4) has attracted more and more researchers' attention due to its excellent performance, such as remarkable stability, fascinating electronic property and low-cost.5,6 However, g-C3N4 has a relatively large band gap, so that it can only absorb light with a wavelength of less than 460 nm. This makes the photocatalytic performance of g-C3N4 unsatisfactory.7 In order to improve the photocatalytic performance, researchers have used many methods to expand the photoresponse range of g-C3N4 based catalyst, including hetero-atomic doping and hetero-molecular doping.8–11 However, these exotic dopants also play as the recombination centres for photogenerated electron–hole, which is harmful to the photocatalytic performance.12,13
How to achieve the expansion of photoresponse range without addition the exotic dopants? The utilizing of lone pair electrons on N atoms is a effective measures.14–16 Theoretical calculations show that there are two feasible electronic transitions in g-C3N4, namely π–π* and n–π* transitions.17 The π–π* transition produces a strong absorption peak around 400 nm and an absorption boundary around 460 nm, as often shown in the UV-Vis spectrum. In contrast, the n–π* transition is an excitation of a lone pair on the N atom, and its corresponding absorption peak is around 500 nm. However, this n–π* transition is rarely reported although it can greatly expand the photoresponse range of the g-C3N4 based catalyst. This is due to that the lone pair of electrons of the N atom cannot be photoexcited in planar and symmetric heptazine units in g-C3N4.18,19 Therefore, an effective strategy is highly needed to achieve the excitation of such lone pair electrons in g-C3N4.
In order to achieve n–π* transition, heptazine units must be distorted to destroy the planar and symmetric g-C3N4. In this work, carbon self-doped honeycomb-like g-C3N4 with outstanding N2 photofixation ability was prepared via microwave treatment using supramolecular aggregates consisting of cyanuric acid, ethylene glycol and melamine as the polycondensation precursors. Combining the carbon self-doping with microwave treatment, the remarkable n–π* transition was stimulated. On the one hand, three precursors can self-assemble into supramolecular aggregates through multiple hydrogen bonds and π–π interactions.20–22 Such supramolecular aggregates can directly polymerize to obtain the modified g-C3N4 based catalyst. Ethylene glycol is not only used as a solvent to build supramolecular aggregates, but also simultaneously serves as a source for carbon doping, leading to the distortion of g-C3N4 construction.23,24 On the other hand, the microwave heating is very fast which can produce g-C3N4 in less than half hour. Lots of gases can be released during the microwave polymerization process of supramolecular aggregates. These rapid released gases create a special honeycomb-like three-dimensional structure of the g-C3N4 catalyst, leading to the further distortion of the structural unit in g-C3N4. In consequence, the n–π* transition becomes allowed in this work. DFT calculation was used to further prove our point of view.
Experimental
Preparation and characterization
5 g of melamine and 5 g of cyanuric acid were added into 150 mL of ethylene glycol (EG) at 60 °C under stirring. The white precipitate was obtained after cooling down. The obtained melamine–cyanuric acid–EG ternary complex was centrifuged, washed with ethanol, dried at 80 °C over night, and then transferred to an alumina crucible (25 mL). This crucible was put into a bigger alumina crucible and buried with the CuO powder. The sample was treated by microwave for 20 min in a normal microwave oven under Ar atmosphere, and denoted as CM-GCN. When ethanol was used to replace EG to synthesize CM-GCN, the obtained sample was denoted as M-GCN. In order to investigate the effect of microwave treatment on the photocatalytic performance, the melamine–cyanuric acid–EG ternary complex was annealed at 550 °C for 4 h under Ar atmosphere, the obtained sample was denoted as CA-GCN. For comparison, melamine was annealed at 550 °C for 4 h under Ar atmosphere, and denoted as GCN.The structure characteristic of the sample was identified by X-ray diffraction (XRD, Rigaku D/max-2400). UV-Vis spectroscopy (JASCO-V-550) and scanning electron microscope (SEM, JSM 5600LV) were used to determine the optical property and morphology. X-ray photoelectron spectroscopy (XPS) measurement was carried out on Thermo Escalab 250 XPS system. Nitrogen adsorption–desorption isotherm was obtained using a Micromeritics 2010 analyzer. Electrochemical impedance spectra (EIS) was performed via an EIS spectrometer (EC-Lab SP-150, BioLogic Science Instruments). Electron Spin Resonance (ESR) and photoluminescence (PL) spectra were measured by digital X-band spectrometer (EMX-220, Bruker, USA) and FP-6300 equipment, respectively.
Material Studio 5.5 program (Accelrys, USA) was used in all the calculations. The generalized gradient approximation (GGA) with RPBE functional was utilized to describe the exchange and correlation potential and the basis set was set as double numerical plus polarization. A thermal meaning of 0.003 Ha was adopted to accelerate the convergence. The convergence criteria for geometry optimization and energy calculation were set as 1.0 × 10⁻⁶ Ha, 1.0 × 10⁻⁵ Ha, 0.002 Ha Å−1 and 0.005 Å for the tolerance of self-consistent field, energy, maximum force and maximum displacement, respectively.
Photocatalytic reaction
The nitrogen photofixation reaction which performed in a double-walled quartz reactor was carried out according to previous work.21,22 0.2 g of catalyst was added to 500 mL deionized water under stirring. Ethanol (0.789 g L−1) was added as a hole scavenger. A 250 W high-pressure sodium lamp (400 < λ < 800 nm) was used as the light source. 5 mL of the suspension were collected at given time intervals, and immediately centrifuged to separate the liquid samples. The concentration of NH4+ was measured using the Nessler's reagent spectrophotometry method (JB7478-87).25,26Results and discussion
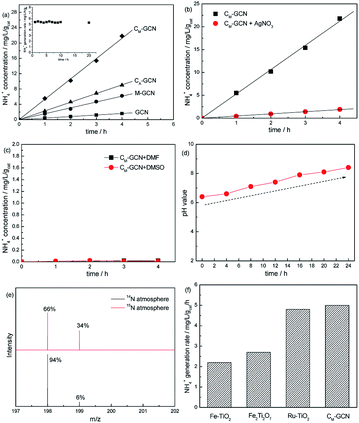
Fig. 1a shows the N2 photofixation ability over GCN, CA-GCN, M-GCN and CM-GCN. GCN shows very low NH4+ concentration, 0.48 mg L−1 gcat−1. For CA-GCN and M-GCN, the N2 photofixation abilities are obviously promoted to 2.3 and 1.5 mg L−1 gcat−1. CM-GCN displays the highest NH4+ concentration of 5.3 mg L−1 gcat−1, over 11 times higher than that of GCN, as well as the excellent photocatalytic stability. The N2 photofixation ability does not decrease after 20 h over CM-GCN (Fig. 1a inset). In Fig. 1b, when AgNO3 is added to trap the photogenerated electrons, the N2 photofixation ability of CM-GCN sharply decreases. This indicates that the photogenerated electrons are the main active species for the N2 photofixation. When DMF and DMSO are used as aprotic solvents to replace water, almost no NH4+ is formed (Fig. 1c). This hints water is necessary as the proton source in this reaction system. In Fig. 1d, before the N2 photofixation reaction, the pH value for the suspension is 6.4. This value gradually increases with the extension of the reaction time, and reaching 8.4 in 24 hours. This should be due to the consumption of H+ in this reaction system, as shown below:| N2 + 6H+ + 6e− ⇀ 2NH3 |
| NH3 + H2O ⇀ NH3·H2O ⇌ NH4+ + OH− |
Isotopic labeling experiments are carried out to confirm the nitrogen source of NH4+. The N2 photofixation ability of CM-GCN was investigated under 15N isotope-labeled N2 (purity > 98%). The formed 15N labeled indophenol was analyzed by LC-MS and shown in Fig. 1e. Two strong indophenol anion signals obviously present at 198 and 199 m/z in LC-MS. This signal intensity is higher than the 14N![[thin space (1/6-em)]](https://www.rsc.org/images/entities/char_2009.gif) :
:![[thin space (1/6-em)]](https://www.rsc.org/images/entities/char_2009.gif) 15N natural abundance ratio, which confirms that N2 is the nitrogen source in this reaction system. Fig. 1f compares the N2 photofixation ability of CM-GCN and other catalysts reported in previous work.26–28 Obviously, CM-GCN exhibits much higher N2 photofixation ability than that of Fe–TiO2 and Fe2Ti2O7. Ru–TiO2 shows the comparable photocatalytic N2 fixation ability to that of CM-GCN. Considering the high price of Ru, CM-GCN has the best price/performance ratio.
15N natural abundance ratio, which confirms that N2 is the nitrogen source in this reaction system. Fig. 1f compares the N2 photofixation ability of CM-GCN and other catalysts reported in previous work.26–28 Obviously, CM-GCN exhibits much higher N2 photofixation ability than that of Fe–TiO2 and Fe2Ti2O7. Ru–TiO2 shows the comparable photocatalytic N2 fixation ability to that of CM-GCN. Considering the high price of Ru, CM-GCN has the best price/performance ratio.
Fig. 2a and b shows the XRD patterns of GCN, CA-GCN, M-GCN and CM-GCN. A strong peak and a weak peak are observed for all the catalysts, which are assigned to the (002) and (100) crystal planes of g-C3N4.29 All the samples display the similar peak intensity, whereas CA-GCN and CM-GCN show a 0.2° shift toward higher 2θ value compared with GCN and M-GCN, as shown in magnified view (Fig. 2b). This should be due to the crystal lattice distortion after carbon doping, which is proved by previous work.23,24
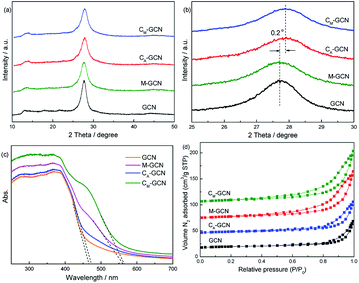 | ||
| Fig. 2 XRD patterns (a and b), UV-Vis spectra (c), and N2 adsorption–desorption isotherms (d) of as-prepared catalysts. | ||
UV-Vis spectra present the direct evidence for the n–π* electronic transition (Fig. 2c). GCN shows the absorption edge of ∼465 nm. For CA-GCN, the wavelength of absorption edge slight shifts to higher value, as well as the light absorption capacity from 450 to 600 nm a little increases. The band gap for the catalyst is calculated according to the following equation:30
| Eg = 1240/λ, |
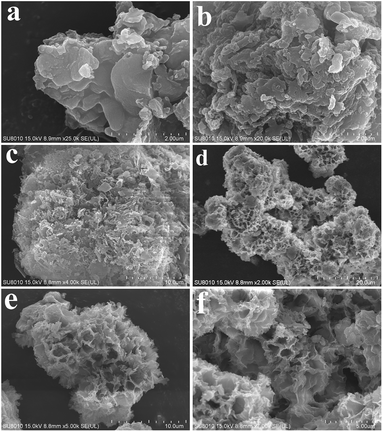
The morphologies of GCN, CA-GCN, M-GCN and CM-GCN were tested by SEM and given in Fig. 3. It is shown that GCN has a graphite-like sheet structure (Fig. 3a). Those g-C3N4 nanosheets are stacked together to form a block structure. For CA-GCN, the sheet size significantly reduces compared with that of GCN (Fig. 3b). It can be seen in Fig. 3c that many irregular pores are formed in M-GCN. These g-C3N4 nanosheets are no longer superposed on each other flatly. In the case of CM-GCN (Fig. 3d–f), the three-dimensional honeycomb structure is clearly shown. Although the formation mechanism of such special morphology is still unclear, it can be concluded that both introducing dopant16,31 and microwave treatment32,33 have great effects on the catalyst morphology.
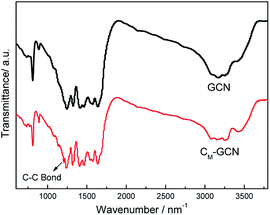
The FT-IR spectra of GCN and CM-GCN are shown in Fig. 4. For GCN, a series of peaks in the range from 1200 to 1600 cm−1 are attributed to the typical stretching modes of CN heterocycles, while the sharp peak located at 810 cm−1 is assigned to the bending vibration of heptazine rings, which indicating the synthesized g-C3N4 is composed of heptazine units. The broad absorption band around 3200 cm−1 is originated from the stretching vibration of N–H bond, associated with uncondensed amino groups. In the case of CM-GCN, all the characteristic vibrational peaks of g-C3N4 are observed, suggesting that the structure of g-C3N4 is not changed. In addition, an obvious absorption peak appears at 1210 cm−1, which should be attributed to the C–C bond. This confirms that carbon doped into g-C3N4 lattice.
The XPS spectra of GCN, CA-GCN, M-GCN and CM-GCN in the region of C 1s and N 1s regions are shown in Fig. 5. In C 1s region, the peak at 284.6 eV is the adventitious carbon. The peak around 286.2 and 288.6 eV are attributed to the terminal C–NHx and sp2 hybridized C atom in the ring (N–C![[double bond, length as m-dash]](https://www.rsc.org/images/entities/char_e001.gif) N), respectively.34 No obvious difference among four catalysts is shown in C 1s region. However, the element analysis result shown in Table 1 indicates that the C/N ratio for GCN and M-GCN is 0.669. This value for CA-GCN and CM-GCN increases to 0.681 and 0.688, respectively. This result hints that carbon atoms have doped into the lattice of catalyst and the carbon source is ethylene glycol. In Fig. 5b, the N 1s spectra for all the samples can be divided into three peaks. The binding energies of 398.2 eV, 399.2 eV and 400.1 eV are assigned to the C–N
N), respectively.34 No obvious difference among four catalysts is shown in C 1s region. However, the element analysis result shown in Table 1 indicates that the C/N ratio for GCN and M-GCN is 0.669. This value for CA-GCN and CM-GCN increases to 0.681 and 0.688, respectively. This result hints that carbon atoms have doped into the lattice of catalyst and the carbon source is ethylene glycol. In Fig. 5b, the N 1s spectra for all the samples can be divided into three peaks. The binding energies of 398.2 eV, 399.2 eV and 400.1 eV are assigned to the C–N![[double bond, length as m-dash]](https://www.rsc.org/images/entities/char_e001.gif) C (N2C), amino groups carrying hydrogen ((C)2–N–H) in connection with structural defects and incomplete condensation, and N–(C)3 (N3C) bond in g-C3N4, respectively.34 The binding energies for all the samples are the same, whereas the peak intensities vary greatly. The peak area ratio of N2C/N3C, calculated by the XPS data, is 3.68 for GCN. For M-GCN, microwave processing can distort the lattice of g-C3N4, leading to the higher N2C/N3C ratio (4.15).32,33 The N2C/N3C ratio for CA-GCN is 4.22, higher than GCN, which should be due to that the bridging N atoms are replaced by the doped carbon atoms,35 as shown in Fig. 5c. In the case of CM-GCN, the N2C/N3C ratio further increases to 6.82. This clearly reveals that microwave treatment and carbon doping synergistically can cause the heptazine motifs to be further distorted. In addition, no binding energy in Cu 2p region is observed in XPS spectra. The ICP result also shows that no Cu is detected. Thus, the possibility of Cu doping is ruled out.
C (N2C), amino groups carrying hydrogen ((C)2–N–H) in connection with structural defects and incomplete condensation, and N–(C)3 (N3C) bond in g-C3N4, respectively.34 The binding energies for all the samples are the same, whereas the peak intensities vary greatly. The peak area ratio of N2C/N3C, calculated by the XPS data, is 3.68 for GCN. For M-GCN, microwave processing can distort the lattice of g-C3N4, leading to the higher N2C/N3C ratio (4.15).32,33 The N2C/N3C ratio for CA-GCN is 4.22, higher than GCN, which should be due to that the bridging N atoms are replaced by the doped carbon atoms,35 as shown in Fig. 5c. In the case of CM-GCN, the N2C/N3C ratio further increases to 6.82. This clearly reveals that microwave treatment and carbon doping synergistically can cause the heptazine motifs to be further distorted. In addition, no binding energy in Cu 2p region is observed in XPS spectra. The ICP result also shows that no Cu is detected. Thus, the possibility of Cu doping is ruled out.
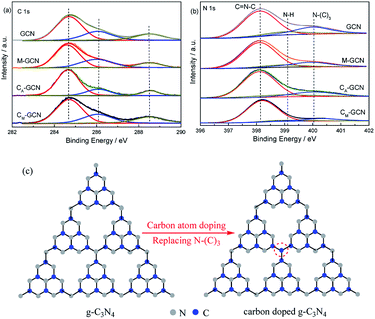 | ||
| Fig. 5 XPS spectra of GCN, CA-GCN, M-GCN and CM-GCN in the region of C 1s (a), N 1s (b) and the diagram of possible structure of g-C3N4 and carbon doped g-C3N4 (c). | ||
| Sample | N (wt%) | C (wt%) | H (wt%) | C/N ratio |
|---|---|---|---|---|
| GCN | 58.94 | 39.51 | 1.55 | 0.669 |
| M-GCN | 58.93 | 39.49 | 1.58 | 0.669 |
| CA-GCN | 58.39 | 39.77 | 1.84 | 0.681 |
| CM-GCN | 58.10 | 39.98 | 1.92 | 0.688 |
Fig. 6a shows the optimized structure of GCN and CM-GCN. Obviously, GCN displays the symmetrical planar structure. For CM-GCN, since the carbon atom is substituted for the nitrogen atom, a C–H bond is formed in order to achieve coordination saturation. The elemental composition shown in Table 1 indicates that the hydrogen content of CM-GCN obviously promote compared with GCN, which confirm the formation of C–H bond. A combination of carbon doping and additional C–H bond changes the g-C3N4 catalyst from a symmetrical planar structure to an asymmetrical non-planar structure, as shown in Fig. 6a. Thus, the n–π* transition becomes allowed for CM-GCN. This result theoretically supports the feasibility of the n–π* electronic transition shown in Fig. 2c. The electrical band structures of GCN and CM-GCN were also calculated using DFT. Fig. 6b displays the density of states and partial density of states of GCN and CM-GCN. It is obvious that the valence band maximum and the conduction band minimum of the catalysts are composed of C 2p and N 2p orbitals. CM-GCN shows much narrower band gap energy than that of GCN, which should be assigned to the n–π* electronic transition. This is consistent with the UV-Vis result.
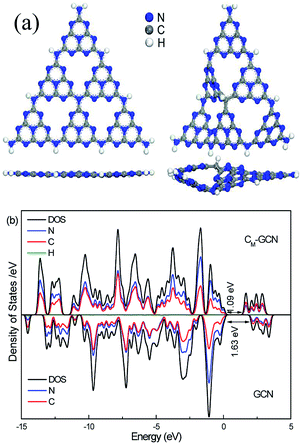 | ||
| Fig. 6 Optimized structure (a), density of states and partial density of states (b) of GCN and CM-GCN. | ||
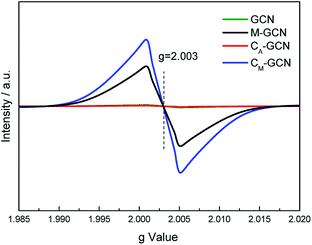
The EPR was carried out to further prove the n–π* electronic transition. As shown in Fig. 7, GCN and CA-GCN display no peak, hinting that almost no lone pair electrons exist in their g-C3N4 structure.36,37 M-GCN and CM-GCN show the distinct resonance signal at g = 2.003. This indicates that lots of localized lone pair electrons present in M-GCN and CM-GCN. These lone pair electrons can be excited through n–π* electronic transition.
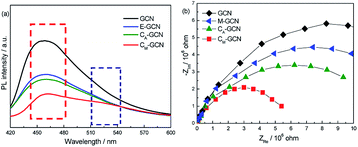
The PL and EIS spectra of as-prepared catalysts are shown in Fig. 8. All the samples display the broad PL band around 460 nm (Fig. 7a), which can be attributed to the π–π* transition.38,39 GCN displays the most intense PL signal among all samples. M-GCN shows the decreased PL intensity compared with GCN, indicating that microwave treatment can promote the separation rate of electron–hole pairs. This is consistent with previous work.32,33 The PL intensity of CA-GCN is also lower than GCN. This should be due to that, when the bridging N atoms are substituted by the carbon atoms, the delocalized π bonds are formed between the hexatomic rings and the doping carbon atom. Such structure can enhance the electrical conductivity of g-C3N4 catalyst.35 In the case of CM-GCN, because of the synergy effect of doping and microwave treatment, its PL intensity is much lower than other samples, hinting its best separation efficiency. It is noted that, besides the PL band at 460 nm, a new peak around 520 nm is clearly shown for CM-GCN. This result confirms that the n–π* electronic transition occur in CM-GCN. Fig. 8b exhibits the EIS spectra of as-prepared catalysts. In general, the arc radius in the EIS spectra reflects the separation efficiency of electrons and holes.40,41 The smaller the arc radius, the higher the separation efficiency. The arc radius decreases in the order: GCN > M-GCN > CA-GCN > CM-GCN. This is consistent with the PL result that the most efficient electron–hole separation is CM-GCN.
It is shown that the surface area and separation efficiency of electron–hole pairs are promoted by the synergy effect of doping and microwave treatment. In order to determine the effect of light absorption capacity of catalyst on N2 photofixation performance, the wavelength dependence of the NH4+ generation rate over GCN and CM-GCN was tested by using filters of different wavelengths (Fig. 9a). Interestingly, the N2 photofixation performance of GCN and CM-GCN is coincident with their optical absorption which is shown in UV-Vis spectra. CM-GCN displays the NH4+ generation rate of 0.5 mg L−1 gcat−1 h−1 even if the light with the wavelength below 550 nm is filtered out. However, the NH4+ generation rate of GCN becomes very low when the filter with 480 nm wavelength is used. This result clearly indicates that the main driving force for this N2 photofixation process is the ability to harvest the photons. After the n–π* transition, these photogenerated-electrons are transferred immediately from the catalyst to the adsorbed N2. Because the bonding orbitals of N2 molecule are occupied by four electrons, this photogenerated-electron has to occupy the anti-bonding orbitals, leading to the nitrogen activation (Fig. 9b). Thus, the nitrogen fixation performance is promoted.
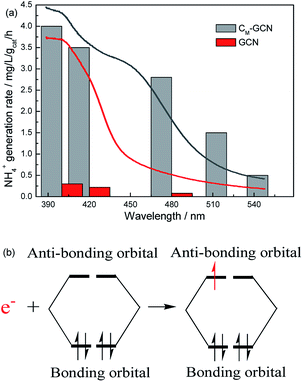 | ||
| Fig. 9 The N2 photofixation ability of GCN and CM-GCN under different wavelength (a) and the possible electron transfer process (b). | ||
Fig. 10a shows the photocatalytic stability of CM-GCN. The NH4+ generation rate does not decrease after five cycles, confirming its good catalytic stability. The SEM image of reused CM-GCN is shown in Fig. 10b. The three-dimensional honeycomb structure is observed, hinting its excellent structural stability. Fig. 10c and d compares the UV-Vis and PL spectra of fresh and reused CM-GCN. No significant difference in UV-Vis and PL spectra between fresh and reused catalyst is observed. This indicates that the optical and electronic properties of CM-GCN does not change after five cycles.
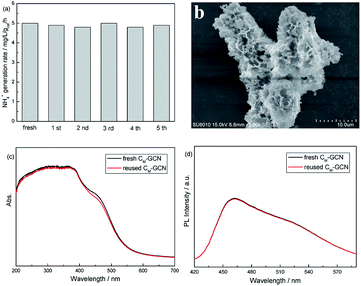 | ||
| Fig. 10 The photocatalytic stability of CM-GCN (a), the SEM image of reused CM-GCN (b), the UV-Vis spectra of fresh and reused CM-GCN (c), and the PL spectra of fresh and reused CM-GCN (d). | ||
Conclusions
In this work, carbon self-doped honeycomb-like g-C3N4 with outstanding N2 photofixation ability was prepared via microwave treatment using supramolecular aggregates consisting of cyanuric acid, ethylene glycol and melamine as the polycondensation precursors. Ethylene glycol is not only used as a solvent to build supramolecular aggregates, but also simultaneously serves as a source for carbon doping. Microwave treatment can distort the structural unit of the catalyst. A combination of carbon doping and additional C–H bond further changes the g-C3N4 catalyst from a symmetrical planar structure to an asymmetrical non-planar structure, leading to the allowed n–π* transition for CM-GCN. The remarkable red shift of absorption edge from 465 nm to near 600 nm was observed, which cause the obviously promoted visible light absorption. The CM-GCN displays the highest NH4+ concentration of 5.3 mg L−1 gcat−1, over 11 times higher than that of neat g-C3N4, as well as the excellent catalytic and structural stability. The N2 photofixation ability of as-prepared catalysts under different wavelength indicates that the main driving force for this reaction is the ability to harvest the photons.Conflicts of interest
There are no conflicts to declare.Acknowledgements
The DFT calculations are supported by Supercomputing Center of Dalian University of Technology.Notes and references
- Z. Q. Liang, Y. C. Guo, Y. J. Xue, H. Z. Cui and J. Tian, Mater. Chem. Front., 2019, 3, 2032–2040 RSC.
- H. Y. Tian, X. Liu, Z. Q. Liang, P. Y. Qiu, X. Qian, H. Z. Cui and J. Tian, J. Colloid Interface Sci., 2019, 557, 700–708 CrossRef CAS PubMed.
- F. J. Liu, X. Z. Wang, X. Y. Chen, X. J. Song, J. Tian and H. Z. Cui, ACS Appl. Mater. Interfaces, 2019, 11, 24757–24763 CrossRef CAS PubMed.
- Y. J. Xue, Y. C. Guo, Z. Q. Liang, H. Z. Cui and J. Tian, J. Colloid Interface Sci., 2019, 556, 206–213 CrossRef CAS PubMed.
- S. Z. Hu, X. Y. Qu, P. Li, F. Wang, Q. Li, L. J. Song, Y. F. Zhao and X. X. Kang, Chem. Eng. J., 2018, 334, 410–418 CrossRef CAS.
- H. H. Liu, D. L. Chen, Z. Q. Wang, H. J. Jing and R. Zhang, Appl. Catal., B, 2017, 203, 300–313 CrossRef CAS.
- X. Wang, K. Maeda, A. Thomas, K. Takanabe, G. Xin, J. M. Carlsson, K. Domen and M. Antonietti, Nat. Mater., 2009, 8, 76–80 CrossRef CAS PubMed.
- J. S. Zhang, M. W. Zhang, S. Lin, X. Z. Fu and X. C. Wang, J. Catal., 2014, 310, 24–30 CrossRef CAS.
- X. F. Chen, J. S. Zhang, X. Z. Fu, M. Antonietti and X. C. Wang, J. Am. Chem. Soc., 2009, 131, 11658–11659 CrossRef CAS PubMed.
- Y. J. Zhang, T. Mori, J. H. Ye and M. Antonietti, J. Am. Chem. Soc., 2010, 132, 6294–6295 CrossRef CAS PubMed.
- G. G. Zhang, M. W. Zhang, X. X. Ye, X. Q. Qiu, S. Lin and X. C. Wang, Adv. Mater., 2014, 26, 805–809 CrossRef CAS PubMed.
- J. Wen, J. Xie, X. Chen and X. Li, Appl. Surf. Sci., 2017, 391, 72–123 CrossRef CAS.
- L. Zhou, H. Zhang, H. Sun, S. Liu, M. O. Tade, S. Wang and W. Jin, Catal. Sci. Technol., 2016, 6, 7002–7023 RSC.
- G. Zhang, G. Li, Z. A. Lan, L. Lin, A. Savateev, T. Heil, S. Zafeiratos, X. Wang and M. Antonietti, Angew. Chem., Int. Ed., 2017, 129, 13630–13634 CrossRef.
- G. Zhang, A. Savateev, Y. Zhao, L. Li and M. Antonietti, J. Mater. Chem. A, 2017, 5, 12723–12728 RSC.
- F. Y. Su, C. Q. Xu, Y. X. Yu and W. D. Zhang, ChemCatChem, 2016, 8, 3527–3535 CrossRef.
- M. Deifallah, P. F. McMillan and F. Corà, J. Phys. Chem. C, 2008, 112, 5447–5453 CrossRef CAS.
- A. B. Jorge, D. J. Martin, M. T. S. Dhanoa, A. S. Rahman, N. Makwana, J. Tang, A. Sella, F. Corà, S. Firth and J. A. Darr, J. Phys. Chem. C, 2013, 117, 7178–7185 CrossRef CAS.
- Y. Chen, B. Wang, S. Lin, Y. Zhang and X. Wang, J. Phys. Chem. C, 2014, 118, 29981–29989 CrossRef CAS.
- M. Shalom, S. Inal, C. Fettkenhauer, D. Neher and M. Antonietti, J. Am. Chem. Soc., 2013, 135, 7118–7121 CrossRef CAS PubMed.
- Y. S. Jun, J. Park, S. U. Lee, A. Thomas, W. H. Hong and G. D. Stucky, Angew. Chem., Int. Ed., 2013, 52, 11083–11087 CrossRef CAS PubMed.
- Y. Ishida, L. Chabanne, M. Antonietti and M. Shalom, Langmuir, 2014, 30, 447–451 CrossRef CAS PubMed.
- G. H. Dong and L. Z. Zhang, J. Mater. Chem., 2012, 22, 1160–1166 RSC.
- Z. W. Zhao, Y. J. Sun, F. Dong, Y. X. Zhang and H. Zhao, RSC Adv., 2015, 5, 39549–39556 RSC.
- H. Li, J. Shang, Z. H. Ai and L. Z. Zhang, J. Am. Chem. Soc., 2015, 137, 6393–6399 CrossRef CAS PubMed.
- S. Z. Hu, X. Chen, Q. Li, F. Y. Li, Z. P. Fan, H. Wang, Y. J. Wang, B. H. Zheng and G. Wu, Appl. Catal., B, 2017, 201, 58–69 CrossRef CAS.
- K. T. Ranjit, T. K. Varadarajan and B. Viswanathan, J. Photochem. Photobiol., A, 1996, 96, 181–185 CrossRef CAS.
- O. Rusina, O. Linnik, A. Eremenko and H. Kisch, Chem.–Eur. J., 2003, 9, 561–565 CrossRef CAS PubMed.
- Y. Wang, X. C. Wang and M. Antonietti, Angew. Chem., Int. Ed., 2012, 51, 68–89 CrossRef CAS PubMed.
- B. Oregan and M. Gratzel, Nature, 1991, 353, 737–740 CrossRef CAS.
- Y. P. Zhu, T. Z. Ren and Z. Y. Yuan, ACS Appl. Mater. Interfaces, 2015, 7, 16850–16856 CrossRef CAS PubMed.
- S. J. Li, X. Chen, S. Z. Hu, Q. Li, J. Bai and F. Wang, RSC Adv., 2016, 6, 45931–45937 RSC.
- H. Q. Ma, Z. Y. Shi, S. Li and N. Liu, Appl. Surf. Sci., 2016, 379, 309–315 CrossRef CAS.
- C. Li, S. Yu, H. Dong, Y. Wang, H. Wu, X. Zhang, G. Chen and C. Liu, J. Colloid Interface Sci., 2018, 531, 331–342 CrossRef CAS PubMed.
- G. H. Dong, K. Zhao and L. Z. Zhang, Chem. Commun., 2012, 48, 6178–6179 RSC.
- S. Z. Hu, Y. M. Li, F. Y. Li, Z. P. Fan, H. F. Ma, W. Li and X. X. Kang, ACS Sustainable Chem. Eng., 2016, 4, 2269–2278 CrossRef CAS.
- S. Z. Hu, X. Chen, Q. Li, Y. F. Zhao and W. Mao, Catal. Sci. Technol., 2016, 6, 5884–5890 RSC.
- L. Ge and C. Han, Appl. Catal., B, 2012, 117–118, 268–274 CrossRef CAS.
- G. H. Dong, D. L. Jacobs, L. Zang and C. Y. Wang, Appl. Catal., B, 2017, 218, 515–524 CrossRef CAS.
- Y. Xu, H. Xu, L. Wang, J. Yan, H. Li, Y. Song, L. Huang and G. Cai, Dalton Trans., 2013, 42, 7604–7613 RSC.
- X. Y. Qu, S. Z. Hu, J. Bai, P. Li, G. Lu and X. X. Kang, J. Mater. Sci. Technol., 2018, 34, 1932–1938 CrossRef.
| This journal is © The Royal Society of Chemistry 2020 |

