 Open Access Article
Tuning the fluorescence based on the combination of TICT and AIE emission of a tetraphenylethylene with D–π–A structure†
Mengxing Zhanga,
Jiale Lia,
Lirong Yua,
Xi Wang *a and
Ming Bai
 *ab
*ab
aMarine College, Shandong University, Weihai, Weihai 264209, People's Republic of China. E-mail: xi_wang@sdu.edu.cn; ming_bai@sdu.edu.cn
bSDU-ANU Joint Science College, Shandong University, Weihai, Weihai 264209, People's Republic of China
First published on 9th April 2020
Abstract
A simple D–π–A structured tetraphenylethylene with two electron-rich methyloxy groups and two electron withdrawing cyano groups, which features both twisted intramolecular charge-transfer (TICT) and aggregation-induced emission (AIE) properties, namely TPEOMeCN has been prepared. The emission of TPEOMeCN examined in various solvents is dependent on the polarities of solvents, which indicates the TICT character. The emission intensity of the compound also enhances with the increasing water fraction in H2O–DMSO mixtures, demonstrating the typical AIE property. Excitingly, the TICT and AIE emission could be observed separately or simultaneously by adjusting the water fraction or viscosity of the solvent. Encouragingly, the combined emission of the TPEOMeCN derived from this single molecule could be readily tuned via regulating the viscosity of the system, resulting in a broad emission peak which covers the visible spectrum (400–700 nm). This work provides a general strategy for designing molecules combining TICT emission and AIE for application as full-color emitters.
Introduction
Fluorescent molecular rotors1 have been developed and employed as microenvironment sensors for biological systems,2 membrane chemistry3 and materials science.4 In most cases, molecular rotors comprise donor–acceptor conjugated fluorophores that form twisted intramolecular charge-transfer (TICT) states upon photoexcitation.1 The fluorescence emission efficiency in such systems is dependent on the free rotation of the molecular rotor; if the rotation is restricted in the twisted conformation, the fluorescence is enhanced significantly. Tetraphenylethene (TPE) derivatives have been attracting increasing research interests in the past decade because of their intriguing aggregation-induced emission (AIE) properties.5 In good contrast to the fluorophores showing notorious aggregation-caused quenching (ACQ) characteristics, the restriction of intramolecular motion (RIM) can block the non-radiative relaxation channel and therefore open the radiative pathway for AIE molecular materials5 which renders TPE to become to emit efficiently in concentrated state, endowing TPE derivatives diverse potential applications in organic light-emitting, biosensing, fluorescent sensors, and biological probes.6 Extensively studies have also disclosed the important role of the propeller conformation of TPE as a prerequisite for their emission in addition to the RIM mechanism. The low cross-chromophore π-conjugation within the tetraphenylethene framework will reduce or switch off the emission of TPEs.7 Just considering the dihedral angle within the molecules, the TICT and AIE states are completely different. At TICT state, the luminogens are in high dihedral angle conformations, but the AIE of TPE adopts a small dihedral angle to fit the high cross-chromophore π-conjugation. For the same reason, the aggregation mechanism is well suited to manipulate rotations of TICT compounds. Based on this design, combining TICT and AIE properties in one molecule is an efficient technique to achieve changes in the emission spectra in the aggregated state.8Combining several emissions with different colors to cover the visible spectrum (400 to 700 nm) is very important to design the full -color emitters. In comparison with multicomponent emitters, full-color emission from a single molecule offers advantages including improved stability, excellent reproducibility, and a simple fabrication process.9 However, in donor–acceptor structures, TPE generally served as electron donor unit, the ON–OFF–ON type emission properties were discovered.10 If the shorter wavelength emission of TICT could be combined with the longer wavelength emission of AIE, which could result in a broad emission covered the visible region. Importantly, the white-light emitters could be developed via the further adjustment on the donor and acceptor moieties.
Herein, in order to obtain the TICT and AIE emission within the TPE framework, a simple D–π–A structure TPE (TPEOMeCN) was prepared. Two electron-rich methyloxy phenyl groups and two electron acceptor cyanophenyl groups were composed of a network of alternative single and double bonds. We have found that the weak emissions of TPEOMeCN detected in the dilute solutions assigned to the TICT emission are dependent on the polarities of solvents. However, the compound behalves as a typical AIE luminogen when dissolved in the H2O–DMSO mixtures with high water fraction. Interestingly, the TICT and AIE emission could be in presence simultaneously in the H2O–DMSO mixtures (1![[thin space (1/6-em)]](https://www.rsc.org/images/entities/char_2009.gif) :
:![[thin space (1/6-em)]](https://www.rsc.org/images/entities/char_2009.gif) 1, v/v). More excitingly, the combined emission of the TPEOMeCN could be readily tuned via adjusting the viscosities of solvents.
1, v/v). More excitingly, the combined emission of the TPEOMeCN could be readily tuned via adjusting the viscosities of solvents.
Experimental
General remarks
Tetrahydrofuran (THF) was distilled from sodium wire and benzophenone under nitrogen. Dichloromethane (DCM) was distilled from CaH2. Column chromatography was carried out on a silica gel column (Qingdao Haiyang, 200–300 mesh) with the indicated eluents. All the other reagents such as 2,2′-dihydroxybenzophenone, pivaloyl chloride, triethylamine, carbon tetrabromide, triphenylphosphine, iodomethane, 4-cyanophenylboronic acid, tetrakis (triphenylphosphine)palladium were used as received. 1H NMR spectra were recorded on a Bruker DPX 400 spectrometer (1H: 400 MHz, 13C: 100 MHz) in CDCl3. Spectra were referenced internally using the residual solvent resonances (δ = 7.28 for 1H NMR) relative to SiMe4 (δ = 0 ppm). 13C NMR spectra were referenced internally by using the solvent resonances (δ = 77.00 ppm for CDCl3). Steady-state fluorescence spectra were recorded on a Hitachi F-7000 spectrophotometer. The emission spectra were corrected for the wavelength dependence of the sensitivity of the detection system. Fluorescence images were taken on a Nikon Eclipse Ti florescence microscope. ESI-MS spectrum was taken on a Thermo Fisher Q-Exactive mass spectrometer.Single-crystal X-ray diffraction analyses were performed on an Aglient Super Nova Atlas Dual diffractometer using CuKα radiation (λ = 1.54184 Å). Structure was solved by direct methods using SHELXTL and refined by full-matrix least-squares on F2 using SHELX-97. Non-hydrogen atoms were refined with anisotropic displacement parameters during the final cycles. Hydrogen atoms were placed in calculated positions with isotropic displacement parameters set to 1.2 × Ueq. of the attached atom. Crystallographic data for the structures reported in this paper have been deposited in the Cambridge Crystallographic Data Center with CCDC number: 1968258.
Synthesis of TPEOMeCN
Dibromodimethyloxylethene, (4-cyanophenyl)boronic acid, K2CO3 and tetrakis(tripenylphosphine) palladium were combined in dry toluene, ethanol and H2O. The mixture was refluxed for 12 h under nitrogen. The resulting solution was filtered and evaporated to afford the crude product. The crude product was purified by silica gel column chromatography using n-hexane/DCM (60/40, v/v) as eluent to give yellow-green solid in 70% yield (309.76 mg). The detailed experimental procedure was shown in ESI.† 1H NMR (400 MHz, CDCl3), (TMS, ppm): 7.43 (d, 2H, J = 8.0 Hz, ArH), 7.10 (d, 2H, J = 8.0 Hz, ArH), 6.91 (d, 2H, J = 8.0 Hz, ArH), 6.69 (d, 2H, J = 12 Hz, ArH), 3.79 (s, 3H, –OCH3). 13C NMR (100 MHz, CDCl3) σ: 158.84, 148.01, 144.90, 135.04, 134.09, 132.34, 131.69, 131.53, 118.52, 113.16, 109.76, 54.89. MALDI-TOF mass: found an isotopic cluster peaking at m/z [M − H]+ 441.167; calculated for C30H21N2O2, 441.168.Results and discussion
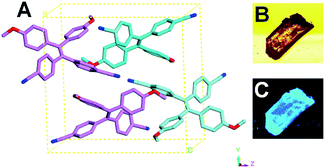
To construct the D–π–A system, two electron-rich methyloxy phenyl groups and two electron acceptor cyanophenyl groups were introduced to the tetraphenylethene. As shown in Scheme 1, the hydroxyl groups of dibromodimethyloxylethene was firstly prepared according to the previous report with some modification.11 Then the reaction between the dibromodimethyloxylethene and the (4-cyanophenyl)boronic acid was performed at 120 °C for 12 h in toluene, H2O and ethanol mixed solvent with Pd(PPh3)4 as catalyst, providing the target compound TPEOMeCN. The structure of TPEOMeCN was confirmed by the spectroscopic characterizations, including 1H NMR, 13C NMR, 2D COSY NMR and MALDI-TOF mass spectroscopies, Fig. S1–S4 (ESI†).The single crystal of TPEOMeCN was generated in mixed CH2Cl2 and n-hexane (9/1, v/v) via slow evaporation and its structure was further clearly determined according to the single crystal X-ray diffraction analysis. TPEOMeCN crystallizes in P21/n space group with a = 9.6368 (13) Å, b = 15.6248 (16) Å, c = 16.1815 (18) Å and β = 90.00°. The detailed crystallographic data (CCDC number 1968258) were summarized in Table S1 in ESI.† It contains two pairs of conformational enantiomers of TPEOMeCN molecules per unit cell shown in Fig. 1A. Notably, no π–π interactions exist between the neighboring TPEOMeCN moieties. No obvious luminescence of the single solid crystal was observed under bright field, but bright blue light was observed under UV irradiation (Fig. 1B and C and S5†).
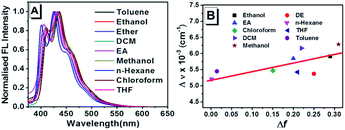
Combination of typical electron-donating methyloxy and electron-accepting cyano groups offers ready intramolecular charge transfer (ICT) process in TPEOMeCN. Since photophysics of the D–π–A structure conjugates in solutions are strongly dependent on the solvent polarity,12 the absorption and emission properties of TPEOMeCN were examined when it was dissolved in the following solvents with the concentration of 50 μM, including the toluene, ethanol, diethyl ether (DE), dichloromethane (DCM), ethyl acetate (EA), methanol, n-hexane, chloroform, tetrahydrofuran (THF), dimethylsulphoxide (DMSO), and N,N-dimethylformamide (DMF). As shown Fig. S6 and Table S2,† in the UV-vis spectra, the mainly strong absorption bands varied from 348 nm (n-hexane) to 341 nm (methanol) are observed, indicating that the excited state is sensitive to the solvent polarity. In most of the solvents, the emission spectra of TPEOMeCN display several multiple peaks with weak intensity (maxima at ca. 425 nm) (Fig. 2A). The location of emission peak also responds to the changes in polarity of solvent, which is consisted with the absorption spectra. The location of the emission peak show bathochromic shift comparing with the emission peak (425 nm) detected in n-hexane with the lowest polarity (Fig. 2A and Table S2†). In a nonpolar solvent (e.g. n-hexane), no charge separation of the molecule occurred, and the equilibrium between the excited luminogen and solvent molecules was formed. However, when the polar solvent was added, the luminogen was no longer in equilibrium with the surrounding solvent molecules. To build the new equilibrium, the intramolecular rotation began to bring the luminogen to the TICT state, the molecular conformation tended to a twisted molecule, and the charge between the D and A units separated. The resulting twisted molecular conformation is stabilized by the solvating effect of the polar solvent. Notably, not all the molecules have the same twisting angles in polarity solvents. Since each molecule has its own emission property, the collection of which induced a relative broad emission spectrum. In addition, in TICT state, the band gap between ground and excited states decreased due to the increased HOMO level, resulting in the red-shifting in the emission spectrum. Based on the above results, the dependence of the Stokes shift (Δν) on solvent polarity parameter (Δf) was investigated, suggesting that the TICT process could be achieved in TPEOMeCN (Fig. 2B). For the emission of compound TPEOMeCN depends on the conformations in solvent which not only determined by the polarity of the solvent but the aggregate state and viscosity, etc., the Δν in some solvents are not strictly dependent on the Δf. Notably, when the compound was detected in DMF and DMSO, the emission spectra exhibit single peaks located at ca. 410 nm, which could be assigned as the shortest wavelength emission band of the multiple peaks (Fig. S7†).
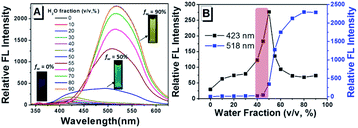
Towards further exploring the AIE properties, the emission behaviors of TPEOMeCN in H2O–DMSO mixed solution with different water fractions (fw, the volume percentage of H2O in the H2O–DMSO mixture) were also studied (Fig. 3). In pure DMSO solution, it gives a weak fluorescence with an emission peak appearing at 414 nm as mentioned above (Fig. S7†). When the fw is increased from 0 to 45%, enhancement of emission intensity along with the slight red shift in the emission band from 414 nm to 423 nm is observed. This can be attributed to an increase in the solvent polarity and TICT mechanism.13 When the fw gets over 50%, the fluorescence emission intensity is enhanced dramatically with an emission peak at 518 nm, indicating the typical AIE nature of this compound. In addition, the level-off tails in the visible region of the absorption spectrum clearly indicated the formation of aggregate when fw is high than 50% (Fig. S8†). Very important phenomenon was observed that when the fw is 50%, the range of emission band mainly covered from 400 nm to 800 nm, which is combined with TICT and AIE emission of TPEOMeCN. This result will provide a novel strategy to explore the TPE-based full-color materials, in which the large-wide emission can cover almost the entire visible region. Unfortunately, the emission was changed with the solution aging detected in DMSO (Fig. S9†), in which the intensity of the peak appearing at about 410 nm increased obviously. That means that the molecular conformation was variable over time, because water has high polarity and it can promote the charge separation between the D and A units of TPEOMeCN significantly during the aging time (2 h). For the emission of compound TPEOMeCN is highly dependent on the molecular conformation, as expected, the emission of TPEOMeCN particles in H2O–DMSO mixtures (fw = 50%) is not stable.
The influence of pH on the emission behaviors was also studied in the mixture of H2O containing different pH values and DMSO (Fig. S10†). In the above system, the water used is neutral water with a pH of 7.02. We used the NaOH and HCl to adjust the pH of water, in which the acidic water (pH = 2.20) and basic water (pH = 11.02) was obtained respectively. Comparing with the emission behaviours of TPEOMeCN in H2O (pH = 7.02)-DMSO, distinctly different emission spectra were observed. When the acidic water was used, the emission band exhibited slight red shift along with the almost unchanged intensity when fw increased from 0 to 60%, the spectrum showed an obviously redshift (518 nm) when fw achieved at 70%, and the intensity decreased slightly when fw increased to 90% (Fig. S10A and S10B†). The acidic water was not favourable for the aggregation of TPEOMeCN, leading to that the AIE behavior was obtained when the fw was higher (70%) compared with 50% in H2O (pH = 7.02)-DMSO system and the intensity only increased slightly. However, when the basic water was used (Fig. S10C and S10D†), the emission peak location also red-shifted to about 423 nm due to TICT mechanism, the intensity enhanced and then decreased when fw increased from 0 to 60%. The peak red-shifted to 518 nm when fw achieved at 70% similar as the phenomenon in acidic water, and the intensity decreased slightly when fw increased to 90%. From the variation of the emission intensity (314 nm) ascribed to TICT mechanism, it can be deduced that the polarity of system was more affected by basic water than acidic water. Similar as the acidic water, a red-shifted emission (518 nm) in the basic water containing system was obtained when fw achieved at a higher value (70%), but no significant enhancement of AIE intensity was observed when fw increased from 70% to 90%, indicating that basic water also plays an inhibitory effect on the process of aggregation. All in all, the acidic and basic water had significant impact on the emission of TPEOMeCN in H2O–DMSO, and they were not suitable solvents in this system.
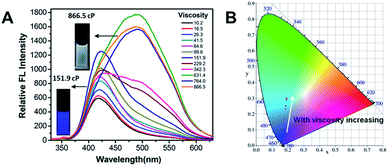
To further obtain a relative stable combined emission, the behaviors of the compound TPEOMeCN in environments with various viscosities were investigated (Fig. 4).1a,14 Three binary solvent systems were chosen, namely, DMSO/ethyl glycol (EG)/glycerol (Gly). The ethyl glycol (EG)/glycerol (Gly) was added into DMSO instead of water, which could help to keep the stability of the TPE derivative dissolved in such mixture. Unlike the H2O/DMSO system, the fluorescence detected in this system can keep unchanged after 2 h. When the viscosity was below 151.9 cP, the emission peak at 418 nm increased linearly with the increasing viscosity (Fig S11†). Since the separation of the charge between the D and A units was induced by the increased viscosity, the peaks appearing at about 418 nm assigned to TICT with increased emission intensity were obtained. However, when the viscosities increased and reached a certain extent, the free rotation of the TPE was restricted and AIE behavior began to emerge. That is, when the viscosity got over 151.9 cP, the higher viscosity restricted the free rotation of the TPE, the RIM emission increased. As a results, the combination of TICT and AIE was observed, in which the emission spectra displayed a broader peak covered from 400 nm to 700 nm. A tunable emission could be conveniently achieved through regulating the RIM efficiency in different viscosities, which is confirmed by the changes of the emission color shown in the CIE 1931 chromaticity diagram (Fig. 4B). Fig. 5 presents the possible mechanism of the different fluorescent responses by adding DMSO/EG/Gly mixtures with increasing viscosity.
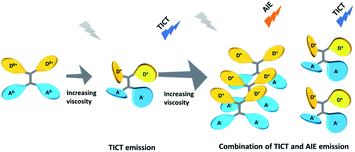 | ||
| Fig. 5 Possible mechanism of the different fluorescent responses by adding DMSO/EG/Gly mixtures with increasing viscosity. | ||
Conclusions
Briefly summarizing above, we have demonstrated a facial strategy obtained the combined emissions of a D–π–A structure TPE. Two electron-rich methyloxy groups and two electron acceptor cyano groups were composed within a TPE framework. We have found that the TICT and AIE emission could be observed separately or simultaneously by changing the water fraction or viscosity. More interestingly, the combined emission of the TPEOMeCN could be readily tuned by varying the viscosities. For the adjustment on the donor and acceptor moieties could tune the emission, the full-color emitters could be obtained further. This discovery will provide a feasible and promising route to design many more novel fine-tuned optical TPE-based molecules.Conflicts of interest
There are no conflicts to declare.Acknowledgements
This work is supported by the National Natural Science Foundation of China (No. 21601107) and the Shandong Province Natural Science Foundation (No. ZR2019MB055).Notes and references
- (a) H. Qian, M. E. Cousins, E. H. Horak, A. Wakefield, M. D. Liptak and I. Aprahamian, Nat. Chem., 2016, 9, 83 CrossRef PubMed; (b) M. A. Haidekker and E. A. Theodorakis, J. Biol. Eng., 2010, 4, 11 CrossRef PubMed; (c) M. K. Kuimova, Phys. Chem. Chem. Phys., 2012, 14, 12671 RSC.
- (a) S. G. Srivatsan, N. J. Greco and Y. Tor, Angew. Chem., Int. Ed., 2008, 47, 6661 CrossRef CAS PubMed; (b) M. K. Kuimova, S. W. Botchway, A. W. Parker, M. Balaz, H. A. Collins and H. L. Anderson, Nat. Chem., 2009, 1, 69 CrossRef CAS; (c) K. Cao, M. Farahi, M. Dakanali, W. M. Chang, C. J. Sigurdson, E. A. Theodorakis and J. Yang, J. Am. Chem. Soc., 2012, 134, 17338 CrossRef CAS PubMed; (d) L. Wang, Y. Xiao, W. Tian and L. Deng, J. Am. Chem. Soc., 2013, 135, 2903 CrossRef CAS PubMed; (e) M. Cui, M. Ono, H. Watanabe, H. Kimura, B. Liu and H. Saji, J. Am. Chem. Soc., 2014, 136, 3388 CrossRef CAS PubMed.
- (a) J. A. Levitt, M. K. Kuimova, G. Yahioglu, P.-H. Chung, K. Suhling and D. Phillips, J. Phys. Chem. C, 2009, 113, 11634 CrossRef CAS; (b) N. A. Hosny, G. Mohamedi, P. Rademeyer, J. Owen, Y. Wu and M. X. Tang, Proc. Natl. Acad. Sci., 2013, 110, 9225 CrossRef CAS.
- (a) Y. Shiraishi, T. Inoue and T. Hirai, Langmuir, 2010, 26, 17505 CrossRef CAS PubMed; (b) G. Vaccaro, A. Bianchi, M. Mauri, S. Bonetti, F. Meinardi and A. Sanguineti, Chem. Commun., 2013, 49, 8474 RSC.
- (a) A. Qin and B. Z. Tang, Aggregation-Induced Emission:Fundamentals, John Wiley and Sons, New York, 2013 CrossRef; (b) J. Mei, N. L. C. Leung, R. T. K. Kwok, J. W. Y. Lam and B. Z. Tang, Chem. Rev., 2015, 115, 11718 CrossRef CAS PubMed; (c) J. Mei, Y. Hong, J. W. Y. Lam, A. Qin, Y. Tang and B. Z. Tang, Adv. Mater., 2014, 26, 5429 CrossRef CAS; (d) Y. Hong, J. W. Y. Lam and B. Z. Tang, Chem. Soc. Rev., 2011, 40, 5361 RSC; (e) Y. Hong, J. W. Y. Lam and B. Z. Tang, Chem. Commun., 2009, 4332 RSC; (f) D. Ding, K. Li, B. Liu and B. Z. Tang, Acc. Chem. Res., 2013, 46, 2441 CrossRef CAS PubMed.
- A. Qin and B. Z. Tang, Aggregation-Induced Emission: Applications, John Wiley and Sons, New York, 2013 Search PubMed.
- (a) B. Han, X. Wang, Y. Gao and M. Bai, Chem. - Eur. J., 2016, 22, 16037 CrossRef CAS PubMed; (b) B. Han, L. Zhu, X. Wang, M. Bai and J. Jiang, Chem. Commun., 2018, 54, 837 RSC; (c) D. Lou, X. Lu, M. Zhang, M. Bai and J. Jiang, Chem. Commun., 2018, 54, 6987 RSC.
- (a) D. Liese and G. Haberhauer, Isr. J. Chem., 2018, 58, 813 CrossRef CAS; (b) X. Liu, A. Li, W. Xu, Z. Ma and X. Jia, Phys. Chem. Chem. Phys., 2018, 20, 13249 RSC; (c) S. Dineshkumar and I. R. Laskar, Polym. Chem., 2018, 9, 5123 RSC; (d) L. Wang, Y. Li, X. You, K. Xu, Q. Feng, J. Wang, Y. Liu, K. Li and H. Hou, J. Mater. Chem. C, 2017, 5, 65 RSC; (e) T. Jadhav, J. M. Choi, J. Shinde, J. Y. Lee and R. Misra, J. Mater. Chem. C, 2017, 5, 6014 RSC; (f) Q. Huang, T. Yu, Z. Xie, W. Li, L. Wang, S. Liu, Y. Zhang, Z. Chi, J. Xu and M. P. Aldred, J. Mater. Chem. C, 2017, 5, 11867 RSC; (g) A. Ekbote, T. Jadhav and R. Misra, New J. Chem., 2017, 41, 9346 RSC; (h) C. Ma, X. Zhang, Y. Yang, Z. Ma, L. Yang, Y. Wu, H. Liu, X. Jia and Y. Wei, J. Mater. Chem. C, 2016, 4, 4786 RSC; (i) R. Misra, T. Jadhav, B. Dhokale and S. M. Mobin, Chem. Commun., 2014, 50, 9076 RSC.
- D. Li, W. Hu, J. Wang, Q. Zhang, X.-M. Cao, X. Ma and H. Tian, Chem. Sci., 2018, 9, 5709 RSC.
- (a) Y. Zhao, S. He, J. Yang, H. Sun, X. Shen, X. Han and Z. Ni, Opt. Mater., 2018, 81, 102 CrossRef CAS; (b) Z. Zhao, H. Su, P. Zhang, Y. Cai, R. T. K. Kwok, Y. Chen, Z. He, X. Gu, X. He, H. H. Y. Sung, I. D. Willimas, J. W. Y. Lam, Z. Zhang and B. Z. Tang, J. Mater. Chem. B, 2017, 5, 1650 RSC; (c) G. F. Zhang, M. P. Aldred, W. L. Gong, C. Li and M. Q. Zhu, Chem. Commun., 2012, 48, 7711 RSC.
- Z.-Q. Chen, T. Chen, J.-X. Liu, G.-F. Zhang, C. Li, W.-L. Gong, Z.-J. Xiong, N.-H. Xie, B. Z. Tang and M.-Q. Zhu, Macromolecules, 2015, 48, 7823 CrossRef CAS.
- (a) J. R. Lakowicz, Principles of Fluorescence Spectroscopy, 3rd edn, Springer, New York, U.S.A., 2006, ch. 6, pp. 205–235 CrossRef; (b) G. Jones, W. R. Jackson, C. Y. Choi and W. R. Bergmark, J. Phys. Chem., 1985, 89, 294 CrossRef CAS; (c) E. M. Kosower, H. Dodiuk and H. Kanety, J. Am. Chem. Soc., 1978, 100, 4179 CrossRef CAS.
- G. F. Zhang, M. P. Aldred, W. L. Gong, C. Li and M. Q. Zhu, Chem. Commun., 2012, 48, 7711 RSC.
- M. A. Haidekker, T. P. Brady, D. Lichlyter and E. A. Theodorakis, Bioorg. Chem., 2005, 33, 415 CrossRef CAS PubMed.
Footnote |
| † Electronic supplementary information (ESI) available: The detailed experimental procedure and related spectroscopic data. CCDC 1968258. For ESI and crystallographic data in CIF or other electronic format see DOI: 10.1039/d0ra00107d |
| This journal is © The Royal Society of Chemistry 2020 |


