 Open Access Article
Comparative study of atrazine degradation by magnetic clay activated persulfate and H2O2
Shaoyan Zong,
Ximeng Xu,
Gang Ran and
Jian Liu *
*
Faculty of Geosciences and Environmental Engineering, Southwest Jiaotong University, Chengdu 611756, China. E-mail: jlau@swjtu.edu.cn
First published on 20th March 2020
Abstract
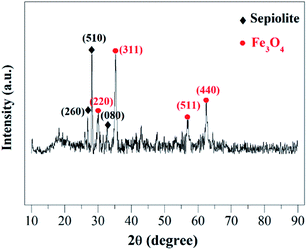
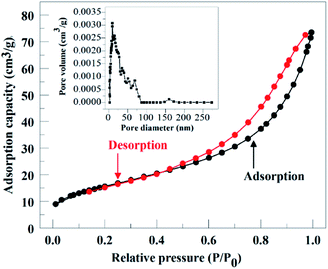
To effectively remove the endocrine disrupting chemicals (EDCs) in water, Fe3O4 was loaded on the surface of modified sepiolite clay by the method of co-precipitation to catalyze potassium persulfate (K2S2O8) and hydrogen peroxide (H2O2) respectively to generate SO4˙− and ·OH for atrazine (ATZ) removal. The magnetic clay catalyst was characterized by XRD, SEM, N2 adsorption–desorption and isoelectric point. The degradation efficiency of ATZ in the two systems was systematically compared in terms of initial pH, oxidant dosage and oxidant utilization rate. The results revealed that, after 90 minutes, systems with K2S2O8 and H2O2 can remove 65.7% and 57.8% of the ATZ under the given conditions (30 °C, catalyst load: 1 g L−1, initial pH: 5, [ATZ]0: 10 mg L−1, [H2O2]0: 46 mmol L−1, [PDS]0: 46 mmol L−1). The magnetic clay catalyst still maintained good catalytic activity and stability during the four consecutive runs. Based on the quenching experiments, it was demonstrated that the dominant radical species in the two systems were SO4˙−/·OH and ·OH, respectively. However, the degradation efficiency of the two systems presented different responses toward the condition variations; the system with K2S2O8 was relatively more sensitive to solution pH, the oxidant efficiency was generally higher than that of the H2O2 system (except 184 mmol L−1).
1. Introduction
Endocrine disrupting chemicals (EDCs), also known as environmental hormones, are contaminants that may cause endocrine disorders. The World Health Organization (WHO) defines it as an exogenous substance or mixture that alters function(s) of the endocrine system and consequently causes adverse health effects in an intact organism, or its progeny, or (sub) populations.1 Atrazine (ATZ) is a kind of triazine herbicide with toxic properties such as carcinogenicity and endocrine disruption, and has been classed as one of the worst endocrine disruptors. Since 1959, ATZ has been widely used as a chemical herbicide in the world.2 Because ATZ has toxic effects on human health, wildlife and the ecological environment, seven European countries including Germany, France and Sweden and the United States have banned the use of ATZ.3,4 However, due to its structural stability, high solubility, refractory and long-term extensive application, its residues have been detected globally in surface water, groundwater and atmospheric sediments.5 Moreover, conventional wastewater technologies, such as biodegradation, coagulation, nanofiltration and sedimentation, cannot remove ATZ effectively in a short time, which makes ATZ degradation more urgent and important.6Advanced oxidation process (AOPs) has been proved to be an effective water treatment technology, which has been widely used in the treatment of refractory organic contaminants in water.7,8 The traditional AOPs based on ·OH (hydroxyl radical) (HR-AOPs) and the new AOPs based on SO4˙− (sulfate radical) (SR-AOPs) can produce strong oxidation radicals by catalyzing H2O2 and persulfate (PDS), which are used to degrade organic pollutants in water.9 Due to the similarity of the structure of H2O2 and PDS, there are some general activation modes for them to produce free radicals, such as ultraviolet, ultrasonic, transition metal.10–13
Fe3O4 has an anti-spinel structure, and the electrons can move rapidly between Fe2+ and Fe3+in octahedron. At the same time, it is a semiconductor with a narrow gap, which is very important for electron transmission. These properties give Fe3O4 higher catalytic activity.14,15 Natural clay is a common catalyst carrier with high specific surface area, good thermal stability, ion-exchange performance and other advantages. When the active metal is supported on the natural clay, the microporous structure of the clay can be improved and the specific surface area can be increased to improve its adsorption and catalytic activity.16 Natural clay has been widely used in the field of catalysis. Jin et al. loaded Fe3O4 onto montmorillonite by co-precipitation, and the phenol (100 mg L−1) was completely removed within 35 min.17 Huang et al. modified the hydroxy Al–Fe intercalated montmorillonite (FeAl-MT) with CE and La respectively. The results showed that the introduction of CE and LA could form lattice defects and vacancies, which significantly enhanced the catalytic activity of degradation of reactive blue dye.18 Sepiolite, a kind of magnesium silicate clay mineral with fibrous morphology. It has a standard chemical formula of Mg8Si12O30(OH)4(OH2)4·8H2O.19 Magnetic Fe3O4 supported on sepiolite, which can be recovered by external magnetic field due to the magnetism of Fe3O4.20
The AOPs based on Fe3O4 activation peroxide has been proved to be able to effectively degrade ATZ in water. For example, An et al. used Fe3O4 as K2S2O8 activation reagent and UVA/Fe3O4/K2S2O8 system to degrade ATZ, the degradation rate of ATZ (100 μmol L−1) reached 90% within 6 h.21 Fang used nanometer Fe3O4 as catalyst to catalyze H2O2, and the degradation rate of ATZ (10 mg L−1) in 48 h was up to 47%.22 In this study, Fe3O4 was supported on modified sepiolite by co-precipitation method to prepare magnetic clay catalyst, and its surface properties were characterized. Based on the prepared catalyst, magnetic clay/PDS (PDS system) and magnetic clay/H2O2 (H2O2 system) were constructed to degrade ATZ in water. The two systems were compared in terms of initial pH, oxidant dosage and oxidant utilization rate.
2. Experimental materials and methods
2.1 Chemicals and instruments
ATZ (99.9%), FeNO3·9H2O, FeSO4·7H2O, ethanol (EtOH) and tert butyl alcohol (TBA) were purchased from Macklin (Shanghai Macklin Biochemical). Potassium persulfate (K2S2O8), NaOH and HNO3 were obtained from Sigma Aldrich (St. Louis, USA). Natural sepiolite was purchased from a sepiolite factory in Shijiazhuang. All the chemicals used in this experiment were analytical grade.Liulian magnetic stirrer (HJ-6, Changzhou Wuyou), pH meter (PHS-3D, Shanghai Leici), UV spectrophotometer (Alpha-1502, Shanghai Puyuan), ultra-performance liquid chromatography (UPLC, 1290 Infinity, Agilent), X-ray diffractometer (XRD, D/max 2550, Rikagu), nitrogen adsorption desorption instrument (SSA-6000, Biaode). Scanning electron microscope (SEM, 1550VP, Zeiss), zeta potentiometer (Zetasizer nano).
2.2 Preparation and characterization of the magnetic clay catalyst
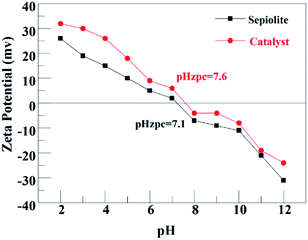
The natural sepiolite was first washed by ultrapure water and then soaked in an acid solution (pH = 2) with solid/water ratio of 1/20 for 2 h to remove the impurities. The solid was then filtered and dried at 80 °C and then heated at 300 °C for another 3 h (magnetic modified sepiolite). The magnetic clay catalyst was prepared by the co-precipitation method. 3.225 g FeNO3·9H2O, 1.11 g FeSO4·7H2O and 0.8 g modified sepiolite were mixed in the corresponding amount of ultrapure water (200 ml). The solution was stirred by 15 min while being heated in a 60 °C water bath, and then the NaOH (1 mol L−1) was added dropwise until the pH value of the solution reached 9. The obtained dark-brown solution was further heated and stirred for another 30 min, then removed from the water bath pot. After cooling to room temperature, the product was centrifuged and repeatedly rinsed with ultrapure water until the filtrate was neutral. Finally, the mixture was dried overnight at 80 °C to obtain the magnetic clay catalyst.The crystalline phase of the catalyst was analyzed by XRD (Cu kα radiation, scanning rate 2° min−1, scanning angle 10–90°). The specific surface area and pore size distribution of catalyst were measured by nitrogen adsorption–desorption instrument. The surface morphology of catalysts at different magnification was characterized by SEM. The isoelectric point of catalyst was obtained using zeta potential tester.
2.3 Activity test and quantitative analysis of the ATZ
In each experiment, after adjusting the solution pH with HNO3 or NaOH, certain amount the magnetic clay catalyst was added in a 100 ml solution of ATZ (10 mg L−1), and the mixture was magnetically stirred at fixed speed for a certain time (30 min) at first to establish adsorption–desorption equilibrium before adding the oxidants (PDS or H2O2). At predetermined time intervals, samples were taken by a syringe and immediately filtered by a 0.22 μm polyethersulfone membrane to remove the solid particles, and then be transferred to liquid chromatography injection bottle for testing.The concentration of ATZ in the solution was detected by UPLC equipped with a UV detector (226 nm for ATZ) using Spheri-5C18 (150 mm × 4.6 mm × 5 μm) column. The mobile phase was composed of 20% ultrapure water and 80% methanol, with a flow rate of 1.0 ml min−1 and an injection volume of 1.0 μL at column temperature of 30 °C.
2.4 PDS concentration analysis
The concentration of PDS was determined by iodimetry.23 Under neutral condition, PDS reacted with excessive iodine ions (I−) to form yellow triiodide, and then the absorbance of the solution was measured at 355 nm by UV-visible spectrophotometer. The PDS content in the solution was calculated according to the relationship between PDS concentration and absorbance.| S2O82− + 3I− → 2SO42− + I3− | (1) |
2.5 H2O2 concentration analysis
The concentration of H2O2 was determined by titanium oxide sulfate complexation colorimetry.24 In sulfuric acid solution, H2O2 reacted with titanium to form an orange complex, and then the absorbance of the solution was measured at 415 nm by UV-visible spectrophotometer. The H2O2 content in the solution was calculated according to the relationship between H2O2 concentration and absorbance.| TiO2+ + H2O2 → [TiO(H2O2)2+] + H2O2 | (2) |
3. Results and discussion
3.1 Characterization of catalyst
3.2 ATZ degradation in two systems
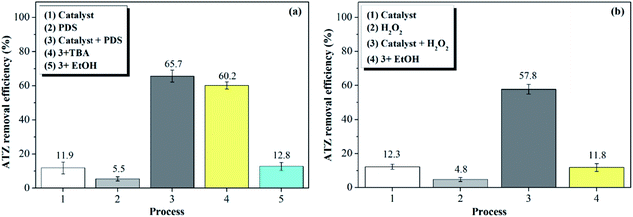 | ||
| Fig. 5 ATZ 90 min removal efficiency in different systems (%): (a) PDS system (b) H2O2 system. (catalyst dose: 1 g L−1, T: 30 °C, pH: 5 oxidant dose: 46 mmol L−1, TBA: 4.6 mol L−1, EtOH: 4.6 mol L−1)29 | ||
In the H2O2 system (b), 12.3% of ATZ was removed after 90 min when adding catalyst alone (1); only 4.8% of ATZ could be removed after adding only H2O2 (2), indicating that H2O2 could not generate radicals by itself. After adding catalyst and H2O2 (3), it can be seen that the degradation rate of ATZ was significantly promoted to 57.8% after 90 min, which demonstrating that ·OH is the primary radical that was responsible for the ATZ degradation in H2O2 system. System (4) also proved this conclusion, the ATZ decomposition was totally terminated by adding EtOH that can annihilate ·OH.
Generally speaking, ATZ could not be effectively degraded by catalyst or oxidant alone because of its refractory property. However, the addition of the magnetic clay catalyst significantly promoted the degradation of ATZ in the two systems, which proved that the catalytic activity of magnetic clay catalyst towards both PDS and H2O2 for radicals (SO4˙− and ·OH), which were responsible for the decomposition of ATZ.
 | (3) |
For PDS system (Fig. 6(a)), the corresponding kobs were 0.0044, 0.0045, 0.0027, 0.0032 and 0.0042 min−1 at solution pH of 3, 5, 7, 9 and 11 respectively. It was obvious that acidic pH is favorable for ATZ degradation. It was owing to two main reasons: (i) organic compounds exist in a neutral state at a pH lower than its pKa value. Beyond this pKa value, organic compounds will generate a negative charge.30 The pKa of ATZ is 1.68, indicating that ATZ was negatively charged in this experiment.31 Based on the pHzpc value of the magnetic clay catalyst (Fig. 4), which is 7.6, the catalyst was positively charged at pH < 7.6. Therefore, the electrostatic adsorption between the catalyst surface and ATZ might be enhanced at pH of 3, 5 and 7, and the effective collision efficiency between the catalyst surface active center and S2O82− could also be increased accordingly, so as to generate more radicals that can directly degrade the ATZ adsorbed on the catalyst surface. (ii) The catalyst was negatively charged at pH > 7.6. Thus, the existed electrostatic repulsive-force between catalyst and S2O82− decrease the generation of SO4˙−. Meanwhile, SO4˙− would also inevitably react with H2O or OH− to generate ·OH, which has a relatively lower reactivity toward ATZ in basic conditions.32,33
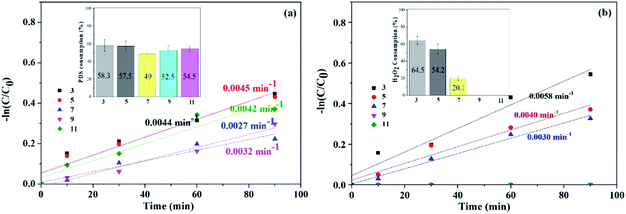 | ||
| Fig. 6 Effects of initial pH on ATZ degradation and oxidant consumption (inset): (a) PDS system (b) H2O2 system. (catalyst dose: 1 g L−1, T: 30 °C, oxidant dose: 46 mmol L−1). | ||
However, with pH further increased to 11, PDS might be activated by OH− instead of solid catalyst, generating SO4˙− and superoxide radicals (O2˙−) (eqn (4) and (5)), correspondingly, and ATZ degradation was again enhanced due to the contribution of O2˙−.34,35 It can be seen from the illustration that at the end of the reaction, PDS consumption rates corresponding to pH 3, 5, 7, 9 and 11 were 58.3%, 57.5%, 49%, 52.5% and 54.5%, respectively.
 | (4) |
| HO2− + S2O82− → SO4˙− + SO42− + H+ + O2˙− | (5) |
The response of H2O2 system to initial pH value was different from that of PDS system (Fig. 6(b)). With the increase of solution pH, the kobs decreased monotonously from 0.0058 min−1 at pH 3 to 0.003 min−1 at pH 7. However, the degradation rate of ATZ was 0 when the pH was 9 or 11. Firstly, in alkaline environment, H2O2 tends to generate H2O and O2, resulting in no corresponding ATZ degradation.36 Further, because the increase of solution pH inhibits the homolysis of H2O2 and then reduces the generation of ·OH, at the same time, the oxidation potential of already generated ·OH in the alkaline condition is far lower than that in the acid environment and is easier to be quenched.37 It can be seen from the illustration that at the end of the reaction, the corresponding H2O2 consumption rates at pH 3, 5, 7, 9 and 11 were 64.5%, 54.2%, 20.1, 0 and 0, respectively.
The effect of initial pH value on the two systems was totally different. The maximum ATZ degradation occurred at pH 5, 3 and the corresponding kobs were 0.045 and 0.0058 min−1 in PDS and H2O2 system, respectively. The buffering capacity of PDS system to pH value of solution was significantly higher than that of H2O2 system.
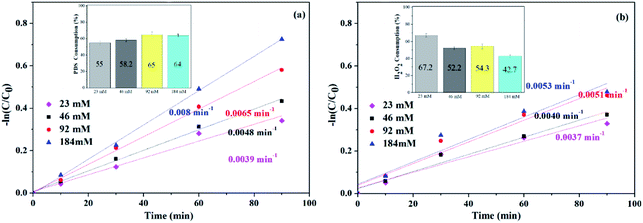 | ||
| Fig. 7 Effects of oxidant dose on ATZ degradation and oxidant consumption (inset): (a) PDS system (b) H2O2 system. (catalyst dose: 1 g L−1, T: 30 °C, pH: 5). | ||
Fig. 7(a) shows the kobs corresponding to different PDS dosage. As shown in the figure, increasing the PDS concentration from 23 to 184 mM caused an increase of the kobs by the end of the reaction (90 min) from 0.0039 min−1 to 0.008 min−1, and the corresponding PDS consumption rates were 55%, 58.2%, 65% and 64%, respectively. Suggesting that PDS is necessary to generate radicals and therefore is beneficial for ATZ degradation.
For H2O2 system (Fig. 7(b)), after 90 min, the kobs with H2O2 concentrations of 23, 46, 92 and 184 mM, reached the values of 0.0037, 0.040, 0.051 and 0.053 min−1, and the corresponding H2O2 consumption rates were 67.2%, 52.2%, 54.3% and 42.7%, respectively. The kobs increased with the increased of H2O2 concentration, indicating that H2O2 is the source of active radicals in the system, so it is beneficial to the degradation of ATZ.
Due to the formation rate of SO4˙− and ·OH was low at low oxidant concentration, resulting the decrease of ATZ degradation. While increasing the oxidant dose, the corresponding kobs increased owing to the production of SO4˙− and ·OH raised. However, excessive oxidants may also reversely inhibit ATZ degradation as it can be used as the scavenger of SO4˙− and ·OH.38,39 This phenomenon was not observed in this study, because the amount of oxidant was lower than the inhibition point. The kobs in PDS system was higher than that in H2O2 system at the same oxidant dosage.
3.3 Utilization efficiency of oxidant
To evaluate the PDS and H2O2 utilization efficiency in two systems, an efficiency indicator (E) was defined by the following formula:
 | (6) |
As can be seen from the Tables 1 and 2 that in both systems, the initial pH of the solution and the oxidant dosage affected the utilization efficiency. The PDS system was relatively more sensitive to solution pH. In the alkaline solution, for PDS system, the utilization efficiency didn't change much at pH of 9, and even increased again at pH of 11, which proved the base-activation of PDS. However, values of E in H2O2 system decreased sharply, which can be explained by the non-radical decomposition of H2O2 under alkaline condition. At pH 7, the high use rate of oxidant in H2O2 system might be due to the lower kobs, more ATZ remaining at the end of the reaction, and the lower consumption rate of oxidant, which ultimately led to the high oxidant utilization. When the dosage of oxidants in the two systems was changed, the oxidant utilization rate in PDS system was generally higher than that in H2O2 system (except 184 mM). This may be that the electronegativity of S2O82− produced by PDS dissolving in water can be stronger when the pH value of solution was 5, and the interaction between S2O82−, catalyst surface active center and ATZ molecule might be enhanced, so that the generation rate of radicals and corresponding ATZ degradation rate were higher.
| pH | 3 | 5 | 7 | 9 | 11 |
| PDS system | 0.617 | 0.609 | 0.408 | 0.490 | 0.569 |
| H2O2 system | 0.651 | 0.572 | 1.493 | — | — |
| Oxidant dose (mmol L−1) | 23 | 46 | 92 | 184 |
| PDS system | 0.526 | 0.604 | 0.678 | 0.806 |
| H2O2 system | 0.417 | 0.594 | 0.681 | 0.890 |
3.4 Reusability and stability of the catalyst
The reusability and stability of the catalyst in two systems were evaluated in terms of ATZ removal by consecutive four batch experiments under the optimal conditions (catalyst dose: 1 g L−1, T: 30 °C, pH: 5, oxidant dose: 46 mmol L−1, t: 90 min). After each reaction, the solid catalyst was separated by external magnetic field from the solution, washed repeatedly by ultrapure water and dried until the next run. As can be seen from Fig. 8, the ATZ removal decreased from 65.7% to 63.3% (fell off by 2.4%) in PDS system, and 57.8% to 53.7% (fell off by 4.1%) in H2O2 system, with reaction time of 90 min. The results indicate that although ATZ removal decreased slightly, the recycled magnetic clay catalyst remained reasonable activity during the recycle process.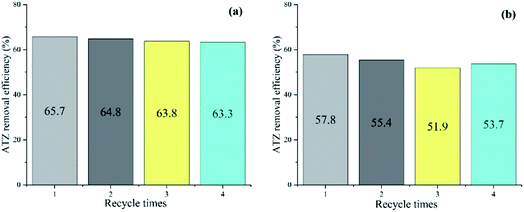 | ||
| Fig. 8 ATZ degradation during the recycle runs. (a) PDS system (b) H2O2 system. (catalyst dose: 1 g L−1, T: 30 °C, pH: 5, oxidant dose: 46 mmol L−1, t: 90 min). | ||
4. Conclusions
(1) The magnetic clay catalyst was successfully prepared by a co-precipitation method and verified to be an effective heterogeneous catalyst, which can catalyze K2S2O8 and H2O2 respectively to generate SO4˙− and ·OH in the degradation of ATZ. It still maintained good catalytic activity and stability during the four consecutive runs.(2) SO4˙−/·OHand ·OH were the dominant radicals in PDS system and H2O2 system according to the quenching experiments.
(3) The buffer capacity of PDS system was relatively more sensitive to solution pH. The reason might be that on the one hand, PDS hydrolysis produced H+, which can buffer the change of pH in solution, and the abundant activation mode for PDS on the other hand. However, in PDS system, the degradation effect of ATZ was best in acidic conditions, and the utilization rate of oxidant was higher than that in alkaline environment, it is possible that the oxidation potential energy of SO4˙− that played a major role in the acidic environment, is higher than that of O2˙−, which was the primary radical in the alkaline condition.
(4) Both systems were affected by the oxidant dosage, and kobs increased with increasing oxidant dosage. At the same oxidant concentration, the kobs value of the PDS system was greater than that of the H2O2 system, and the usage rate of the oxidant in the PDS system was generally higher than that of the H2O2 system (except 184 mM), indicating that the degradation effect of PDS system on ATZ was obviously better than that of H2O2 system. It might be due to the SO4˙− produced by PDS dissolved in water became electronegative. The effective collision efficiency between the catalyst surface active center and S2O82− was correspondingly increased at pH 5, resulting in more multiple radicals can directly degrade ATZ adsorbed on the catalyst surface, making the ATZ degradation rate higher.
Conflicts of interest
There are no conflicts to declare.Acknowledgements
This research was funded by the major subject of science and technology of Sichuan province, grant number [No. 2019YFS0509].References
- T. Damstra, S. Barlow, A. Bergman, R. Kavlock and G. V. D. Kraak, Global assessment of the state-of-the-science of endocrine disruptors, WHO, 2002, vol. 35, pp. 333–343 Search PubMed.
- W. J. Ren, M. Wang and Q. X. Zhou, Soil Sci. Soc. Am. J., 2011, 75, 1394–1401 CrossRef CAS.
- G. W. Luo, J. Ma, J. Jiang, Y. Z. Liu, Y. Song, Y. Yang, Y. H. Guan and D. J. Wu, Water Res., 2015, 80, 99–108 CrossRef PubMed.
- H. Jiang and C. Adams, Water Res., 2006, 40, 1657–1667 CrossRef CAS PubMed.
- A. A. Basfar, K. A. Mohamed, A. J. Al-Abduly and A. A. Al-Shahrani, Ecotoxicol. Environ. Saf., 2009, 72, 948–953 CrossRef CAS PubMed.
- X. M. Xu, W. M. Chen, S. Y. Zong, X. Ren and D. Liu, J. Hazard. Mater., 2019, 377, 62–69 CrossRef CAS PubMed.
- J. Baloyi, T. Ntho and J. Moma, RSC Adv., 2018, 8, 5197–5211 RSC.
- J. Li, Y. J. Li, Z. K. Xiong, G. Yao and B. Lai, Chin. Chem. Lett., 2019, 30, 2139–2146 CrossRef CAS.
- H. Zhang, Q. Q. Ji, L. D. Lai, G. Yao and B. Lai, Chin. Chem. Lett., 2019, 30, 1129–1132 CrossRef CAS.
- M. Golshan, B. Kakavandi, M. Ahmadi and M. Azizi, J. Hazard. Mater., 2018, 359, 325–337 CrossRef CAS PubMed.
- S. Jorfi, B. Kakavandi, H. R. Motlagh, M. Ahmadi and N. Jaafarzadeh, Appl. Catal., B, 2017, 219, 216–230 CrossRef CAS.
- A. Takdastan, B. Kakavandi, M. Azizi and M. Golshan, Chem. Eng. J., 2017, 331, 729–743 CrossRef.
- X. M. Xu, S. Y. Zong, W. M. Chen and D. Liu, Chem. Eng. J., 2019, 369, 1363–1370 CrossRef.
- M. Munoz, Z. M. De Pedro, J. A. Casas and J. J. Rodriguez, Appl. Catal., B, 2015, 176–177, 249–265 CrossRef CAS.
- Z. H. Diao, J. J. Liu, Y. X. Hu, L. J. Kong, D. Jiang and X. R. Xu, Sep. Purif. Technol., 2017, 184, 374–383 CrossRef CAS.
- F. Liao and M. C Long, Chem. Ind. Eng. Prog., 2018, 37, 3401–3409 Search PubMed.
- M. G. Jin, M. C. Long, H. R. Su, Y. Pan, Q. Z. Zhang, J. Wang, B. X. Zhou and Y. W. Zhang, Environ. Sci. Pollut. Res., 2017, 24, 1926–1937 CrossRef CAS PubMed.
- Z. J. Huang, P. X. Wu, H. L. Li, W. Li, Y. J. Zhu and N. W. Zhu, RSC Adv., 2014, 4, 6500–6507 RSC.
- S. K. Dental, J. Y. Bottero, K. Khatib, H. Demougeot, J. P. Duguet and C. Anselme, Water Res., 1995, 29, 1273–1280 CrossRef.
- M. Munoz, Z. M. De Pedro, J. A. Casas and J. J. Rodriguez, Appl. Catal., B, 2015, 176–177, 249–265 CrossRef CAS.
- J. B. An, C. Q. Xia, H. Y. Chen and D. P. Hu, Res. J. Environ. Sci., 2018, 31, 130–135 Search PubMed.
- G. D. Fang, The study on degradation of 2,4-D and atrazine by Fe3O4 nanoparticles, Anhui Agricultural University, 2010 Search PubMed.
- H. Lee, H. J. Lee, J. Jeong, J. Lee, N. B. Park and C. Lee, Chem. Eng. J., 2015, 266, 28–33 CrossRef CAS.
- I. R. Cohen, T. C. Purcell and A. P. Altshuller, Environ. Sci. Technol., 1967, 1, 247–252 CrossRef CAS.
- D. Angın, T. E. Köse and U. Selengil, Appl. Surf. Sci., 2013, 280, 705–710 CrossRef.
- M. Alkan, O. Demirbas and M. Dogan, J. Colloid Interface Sci., 2005, 281, 240–248 CrossRef CAS PubMed.
- J. Park and J. R. Regalbuto, J. Colloid Interface Sci., 1995, 175, 239–252 CrossRef CAS.
- G. V. Buxton, C. L. Greenstock, W. P. Helman and A. B. Ross, J. Phys. Chem. Ref. Data, 1988, 17, 513 CrossRef CAS.
- X. M. Xu, W. M. Chen, S. Y. Zong, X. Ren and D. Liu, Chem. Eng. J., 2019, 373, 140–149 CrossRef CAS.
- S. Ahmed, M. G. Rasul, R. Brown and M. A. Hashib, J. Environ. Manage., 2011, 92, 311–330 CrossRef CAS PubMed.
- S. Salvestrini, P. Sagliano, P. Iovino, S. Capasso and C. Colella, Appl. Clay Sci., 2010, 49, 330–335 CrossRef CAS.
- J. Li, J. F. Yan, G. Yao, Y. H. Zhang, X. Li and B. Lai, Chem. Eng. J., 2019, 361, 1317–1332 CrossRef CAS.
- C. D. Qi, X. T. Liu, J. Ma, C. Y. Lin, W. X. W. Li and H. J. Zhang, Chemosphere, 2016, 151, 280–288 CrossRef CAS PubMed.
- O. S. Furman, A. L. Teel and R. J. Watts, Environ. Sci. Technol., 2010, 44, 6423–6428 CrossRef CAS PubMed.
- X. M. Xu, S. Y. Zong, W. M. Chen and D. Liu, Chem. Eng. J., 2019, 369, 470–479 CrossRef CAS.
- F. Haber and J. Weiss, Proc. Roy. Soc. Lond. Math. Phys. Sci., 1934, 147, 332–351 CAS.
- Y. Fan, Y. F. Ji, G. Y. Zheng, J. H. Lu, D. Y. Kong, X. M. Yin and Q. S. Zhou, Chem. Eng. J., 2017, 330, 831–839 CrossRef CAS.
- Y. H. Guan, J. Ma, X. C. Li, J. Y. Fang and L. W. Chen, Environ. Sci. Technol., 2011, 45, 9308–9314 CrossRef CAS PubMed.
- N. Daneshvar, M. A. Behnajady, M. K. Ali Mohammadi and M. S. Seyed Dorraji, Desalination, 2008, 230, 16–26 CrossRef CAS.
| This journal is © The Royal Society of Chemistry 2020 |


