 Open Access Article
One-step synthesis of Ni(OH)2/MWCNT nanocomposites for constructing a nonenzymatic hydroquinone/O2 fuel cell
Yuan Wuab,
Xiaonan Yang†
ab,
Shuhui Liuab,
Yonglei Xingab,
Juan Peng ab,
Yage Pengab,
Gang Ni
 ab and
Xiaoyong Jin
 *ab
*ab
aState Key Laboratory of High-efficiency Utilization of Coal and Green Chemical Engineering, Ningxia University, Yinchuan 750021, China. E-mail: jin_xy@nxu.edu.cn
bNational Demonstration Center for Experimental Chemistry Education, School of Chemistry and Chemical Engineering, Ningxia University, Yinchuan 750021, China
First published on 28th October 2020
Abstract
In this work, a H-type hydroquinone/O2 fuel cell was assembled and shows high energy density in neutral phosphate buffer solution at moderate temperature. The anodic material, Ni(OH)2/MWCNTs, was synthesized by a one-step hydrothermal synthesis method to oxidize hydroquinone. The cathode material, Pt/MWCNTs, was obtained by an electrodeposition method, and shows great oxygen reduction reaction (ORR) activity. The properties and the morphology of Ni(OH)2/MWCNT nanocomposites were characterized by TEM, XPS, EDS-mapping and electrochemical methods, like cyclic voltammetry (CV) and electrochemical impedance spectroscopy (EIS). The results show that Ni(OH)2/MWCNTs can effectively oxidize hydroquinone and play a dominant role in enhancing the fuel cell performance. The nonenzymatic fuel cell possesses a high power density of 0.24 mW cm−2 at a cell potential of 0.49 V.
1. Introduction
Environmental pollution problems, such as air, soil and water pollution caused by the consumption of fossil energy are becoming more and more serious. Therefore, it is imperative to develop some efficient and green energies to substitute for fossil fuels. In recent years, biofuel cells (BFC), which can directly convert chemical energy to electric power by utilizing biocatalysts, have shown some unique advantages compared to other electric power facilities, such as low cost, excellent stability and high power output.1–3 It has been reported that ethanol and glucose have been catalyzed and oxidized as feedstock for conventional biofuel cells.4,5 In modern industrial production, phenol organic compounds are considered as important pollutants in medicines, foods and the fine chemical industry. Hydroquinone (HQ, 1,4-dihydroxybenzene), as one of the phenolic compounds, plays an important role in cosmetics, pesticides, food antioxidants and other fields.6 However, HQ is also a serious environmental pollutant due to its toxicity to humans and difficulty in degradation, which can cause fatigue, headache and tachycardia in humans, and even lead to acute myeloid leukemia at high levels.7–9 Therefore, it is very important to develop some green and effective methods for disposing HQ.As one of transition metal hydroxides, Ni(OH)2 has the advantages of high stability, low toxicity and inexpensive,10 and is widely used in the fields of supercapacitors, sensors and lithium ion batteries.11,12 Generally, Ni(OH)2 exists in two forms of α-Ni(OH)2 and β-Ni(OH)2. The β-Ni(OH)2 possesses a hexagonal arrangement of brucite-type layers ordered along the axis C, correspondingly, the other structure is randomly stacked along the C axis.13 It has been reported that there were many successful methods for the synthesis of Ni(OH)2, including solvent heat,14 ultrasonic,15 hydrothermal,16 co-precipitation17 and so on. In recent years, multi-walled carbon nanotubes (MWCNTs) are very popular and widely used in biosensors,17 supercapacitors,18 biofuel cells19 and other fields because of their small size, large specific surface area, high conductivity and chemical stability. Mostly, MWCNTs are often combined with transition metal oxides for enhancing the features in application.20–22 For example, MWCNTs and ZnO–Co3O4 are serve as electrode materials to construct the non-enzyme electrochemical sensors for high-sensitivity detection of tanshinol.23 And SnS2/MWCNTs composite was used as the modified material to prepare a chemically modified electrode (CME), which was used for the rapid detection of H2O2 and produce a strong current response.24 Although the preparation of Ni(OH)2/MWCNTs has been reported in some works, like supercapacitors,25 and sensors,26 the application of Ni(OH)2 or Ni(OH)2/MWCNTs nanomaterials in hydroquinone biofuel cells is still a new question worth exploring, which might also catalyze and degrade HQ in solution.
Hence, Ni(OH)2/MWCNTs nanocomposites were synthesized by one-step hydrothermal method. The electrochemical properties and the morphology of nanocomposites were characterized by TEM, EDS-mapping and other electrochemical methods, like cyclic voltammetry and electrochemical impedance spectroscopy. The effects of HQ concentrations and scanning rates on peak current were also investigated. As a result, the nanocomposite exhibits higher electrochemistry properties than single Ni(OH)2 or MWCNTs prepared in this work, an H-type hydroquinone/O2 fuel cell was assembled and shows high energy density (0.24 mW cm−2). Which demonstrated that Ni(OH)2/MWCNTs nanocomposites possess great application prospect as a potential anode material in HQ biofuel cell.
2. Experimental
2.1 Materials
Multiwall carbon nanotubes (MWCNTs) were purchased by Shenzhen Nanotech Port Co. Ltd., NiCl2·6H2O, NaOH, hydroquinone, K3[Fe(CN)6], K4[Fe(CN)6] were purchased from Shanghai reagents factory (China). All reagents were analysis reagent (A.R.), and used as received without further purification. Phosphate buffered saline (PBS) solution were made of standard storage solution of 0.10 mol L−1 Na2HPO4 and 0.10 mol L−1 NaH2PO4. All solutions were prepared using deionized water.2.2 Characterization
Electrochemical measurements were tested on CHI760E Electrochemical Workstation (Shanghai Chenhua Instrument Co., Ltd., China) and with rotating disk electrode (RDE) (PINE AFMSRCE, USA) at room temperature. A conventional three-electrode cell was used, containing a glassy carbon electrode (GCE, 3.0 mm in diameter) as the working electrode, platinum wire as the counter electrode and the standard calomel electrode (SCE) as reference electrode. Transmission electron microscopy (TEM) were tested on JEM-2100 with an accelerating voltage of 200 kV. X-ray diffraction (XRD) was performed on a Bruker D8 advance A25 at 40 kV and 40 mA for Cu kα with a step size of 0.01° in 2θ. X-ray photoelectron spectroscopy (XPS) analysis was measured on a PHI5000V Versaprobe system using monochromatic Al kα radiation, and all bindings energies were calibrated by the C 1s peak at 284.7 eV.2.3 Synthesis of Ni(OH)2 and Ni(OH)2/MWCNTs nanocomposites
Typically, 2 g of MWCNTs was added in a 150 mL round bottle flask with a concentrated sulfuric acid (98%, 112.5 mL) and nitric acid (68%, 37.5 mL) under ultrasonic processing. The resulting black powder was collected by centrifugation and washed by deionized water until the pH of the filtrate was approximately neutral. Then, MWCNTs were dried in a vacuum oven for 24 h at 80 °C.The Ni(OH)2/MWCNTs nanocomposites were synthesized by hydrothermal method. The specific steps were as follows: 5 mg of MWCNTs was dispersed in 15 mL deionized water and treated under ultrasonication for 30 min. Then, 100 μL of NiCl2·6H2O aqueous solution (0.1 M) was injected in the suspension. The solution pH was then adjusted to 12 by adding NaOH solution (0.5 M). After stirring vigorously for 1 h, the solution was transferred into a 25 mL steel autoclave, sealed and maintained at 180 °C for 24 h. The obtained products were centrifuged, washed with ethanol and deionized water respectively, finally dried at 80 °C for 10 h. For the sake of comparison, pure Ni(OH)2 was also synthesized by the same process without the addition of MWCNTs.
2.4 Preparation of modified electrodes
The working electrode was modified by MWCNTs, Ni(OH)2, or Ni(OH)2/MWCNTs nanocomposites. Typically the GCE (φ = 3.0 mm) was polished with 1.0, 0.3, 0.05 μm of alumina slurry, washed with deionized water and absolute ethanol, and finally dried in air. An amount of MWCNTs, Ni(OH)2 and Ni(OH)2/MWCNTs powder was dispersed in 1 mL of water/ethanol solution (1/1 v/v), respectively, followed by ultrasonication for 30 min. Furthermore, GCEs were conducted by 5 μL of ultrasonicated mixture and 2 μL 0.05% Nafion solution, and finally dried in air at room temperature to obtain the MWCNTs/GCE, Ni(OH)2/GCE, Ni(OH)2/MWCNTs/GCE. To the Pt/MWCNTs/GCE, 5 μL of MWCNTs mixture was deposited on GCE, and the Pt film was carried out by CVs in 0.5 mol L−1 H2SO4 solution containing 1.8 × 10⁻³ mol L−1 H2PtCl6 with a potential scanning from 0.40 to −0.30 V at 100 mV s−1 for 30 cycles. The obtained electrode is recorded as Pt/MWCNTs/GCE.2.5 Electrochemical measurements
Electron transfer properties of the composites modified electrodes were assessed by cyclic voltammetry and electrochemical impedance spectroscopy in 0.1 mol L−1 KCl solution, which contains 5.0 mmol L−1 [Fe(CN)6]3−/4− redox pair. EIS measurements were tested in the frequency range from 0.10 Hz to 100 kHz at an open circuit potential (Eocp) with 10 mV as the amplitude potential.2.6 Non-enzymatic biofuel cells design
The H-type dual chambered fuel cell was constructed with Ni(OH)2/MWCNTs/GCE as anode and Pt/MWCNTs/GCE as cathode, respectively. And the Nafion membrane was used to separate the anode and cathode compartments, which was injected into 0.1 mol L−1 PBS (pH 7.4) containing 4 mmol L−1 HQ as anode solution and 0.1 mol L−1 PBS (pH 7.4) saturated with O2 as cathode solution. Linear sweep voltammetry (LSV) is subsequently used for obtaining the polarization curves of the fuel cell.3. Results and discussion
3.1 Characterization of the synthesized nanocomposites
The synthesis of Ni(OH)2/MWCNTs was prepared via a one-step method without assistance of surfactants in aqueous phase. First, carbon nanotube is used as a upholder to anchor the Ni(OH)2. According to the literature,27 Ni(OH)2 is usually positively charged, which is electrophilic with carbon nanotube. It can be supposed that the interaction between Ni(OH)2 and nanotube is electrostatic interactions.Transmission electron microscopy was performed to investigate the morphology of the pure MWCNTs, Ni(OH)2 and Ni(OH)2/MWCNTs nanomaterials. TEM image (Fig. 1(A)) shows that the surface of bare MWCNTs is relatively smooth with an average diameter of approximately 40 nm. As observed in Fig. 1(B), the size of near hexagonal Ni(OH)2 nanoplates is about 10–30 nm with the thickness of 1.5–3.0 nm from the vertically aligned nanoplates. A typical TEM image (Fig. 1(C)) clearly demonstrates the successful growth of Ni(OH)2 nanoplates on MWCNTs. The XRD patterns in Fig. 1(D) are indexed to the hexagonal phase of typical-Ni(OH)2 (JCPDS-14-0117) and the crystalline MWCNTs, respectively. The sharp diffraction peaks at 2θ = 19.258, 33.064, 38.541, 39.098, 52.100, 59.052, 60.240, 62.276, 69.346, 70.478, 72.737, 73.129 and 82.608 correspond to (001), (100), (101), (002), (102), (110), (003), (111), (200), (103), (201), (112) and (202) crystal planes, respectively. No peaks referring to the other impurities can be observed in XRD patterns, which indicates the formation of pure Ni(OH)2 phase. For the further analysis, the elemental dispersive X-ray (EDX) spectroscopy of Ni(OH)2/MWCNTs composites were also measured. TEM combined with element mapping based on EDX further confirmed the presence of Ni, O and C elements in the Ni(OH)2/MWCNTs. Fig. 1(E–H) shows that TEM-EDS concentration profiles of C, Ni, and O measured in the Ni(OH)2 also indicated the uniform coating of Ni(OH)2 on MWCNTs. In addition, it can be clearly seen from Fig. 1(I) that mass fractions of Ni, O and C elements are 15.93%, 11.89% and 72.18%, respectively.
XPS measurements (Fig. 2(A)) were also employed to analyze the chemical states of all elements except H in the Ni(OH)2/MWCNTs nanomaterials, confirming the presence of Ni, O, and C in the composite. The high-resolution spectrum of Ni 2p in Fig. 2(B) showed two main peaks at 855.8 eV and 873.4 eV with a spin-energy separation of 17.60 eV, corresponding to Ni 2p3/2 and Ni 2p1/2, respectively, which is typical characteristics of Ni(OH)2 phase.28 Ni2+ introduced in the reaction was not converted into other substances. For oxygen element, the O 1s core level in Fig. 2(C) can be deconvoluted into two contributions at 531.1 eV and 532.9 eV, corresponding to O2− and O–H in Ni(OH)2, respectively. In Fig. 2(D), binding energies observed at 284.74 eV, 284.84 eV, 287.6 eV and 289.25 eV correspond to C![[double bond, length as m-dash]](https://www.rsc.org/images/entities/char_e001.gif) C, C–C, C
C, C–C, C![[double bond, length as m-dash]](https://www.rsc.org/images/entities/char_e001.gif) O and O
O and O![[double bond, length as m-dash]](https://www.rsc.org/images/entities/char_e001.gif) C–O, respectively, which correspond to graphite like sp2 carbon atoms C
C–O, respectively, which correspond to graphite like sp2 carbon atoms C![[double bond, length as m-dash]](https://www.rsc.org/images/entities/char_e001.gif) C, C–C and carbon in carboxyl or ester groups (O
C, C–C and carbon in carboxyl or ester groups (O![[double bond, length as m-dash]](https://www.rsc.org/images/entities/char_e001.gif) C–O) in the pretreated MWCNTs. All the above results indicated that β-Ni(OH)2 nanoplates have been successfully coated on MWCNTs.
C–O) in the pretreated MWCNTs. All the above results indicated that β-Ni(OH)2 nanoplates have been successfully coated on MWCNTs.
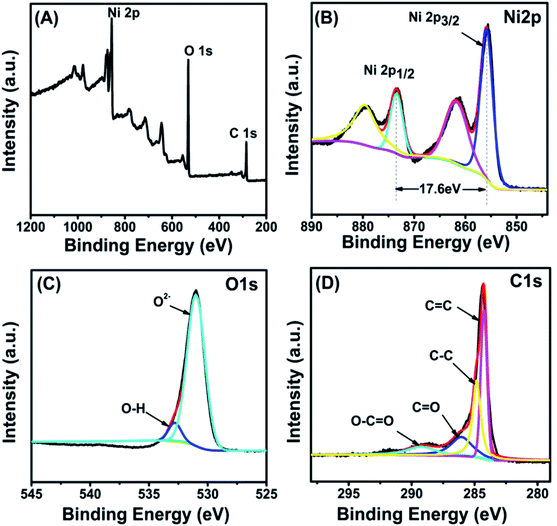 | ||
| Fig. 2 XPS spectra of nanocomposite: survey spectrum (A), curve fitting spectrum of Ni 2p (B), O 1s (C), C 1s (D). | ||
3.2 Electrochemical characterization
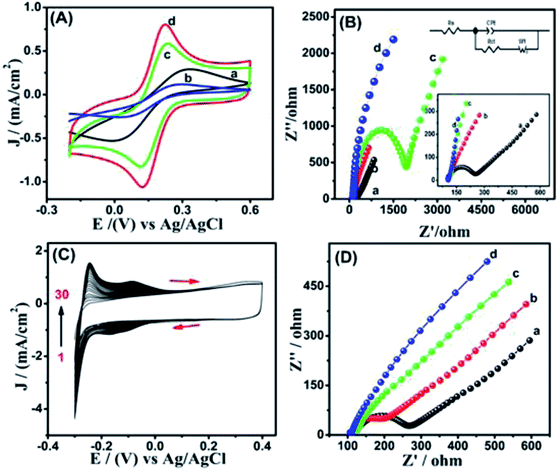
Cyclic voltammetry and electrochemical impedance spectroscopy are two kinds of convenient methods to study the electrochemical properties of various modified electrodes. Fig. 3(A) shows the CVs of different modified electrodes, from which the oxidation and reduction peaks of [Fe(CN)6]3−/4− can be clearly observed at bare GCE (curve a). When Ni(OH)2 is fixed on the surface of the electrode (curve b), the peak current decreases because of the poor conductivity of Ni(OH)2. As for MWCNTs/GCE (curve c), the peak current increases sharply due to its large specific surface area and excellent electrocatalytic performance. In conclusion, Ni(OH)2/MWCNTs/GCE (curve d) electrode showed higher peak current than those of other electrodes, which can be attributed to the synergistic effects of Ni(OH)2 nanoparticles and MWCNTs. Several studies have shown that the presence of oxygen species on carbon materials' surface, such as carboxyl and hydroxyl groups, can enhance the dispersion of the metal oxide, thus increasing the performance of the resulting composite materials.29 Generally, the EIS consists of a semicircle in the high-frequency region and a straight line in the low-frequency region, corresponding to the charge transfer resistance and ion diffusion resistance in the electrode, respectively.30 In Fig. 3(B), it is worth mentioning that the Nyquist plot for the MWCNTs electrode did not exhibit a semicircle in the high-frequency region, due to its low charge transfer resistance (curve c). The Ni(OH)2 electrode displays a much larger radius of semicircle in the high-frequency region compared to that of the bare electrode (curve b), indicating its higher faradaic charge transfer resistance. Besides, the Ni(OH)2/MWCNTs electrode exhibits a more vertical line than that of the Ni(OH)2 electrode and MWCNTs electrode in the low-frequency region (curve d), illustrating its better abilities to transfer electrons and lower diffusion resistance for ions. In conclusion, the carbon material can significantly enhance the electrical conductivity of the Ni(OH)2, thus leading to significant improvement of the electrochemical performance.Fig. 3(C) shows the CVs of the electrodeposition process of Pt film on MWCNTs/GCE. With the increase of cycle number from 1 to 30, all the redox peak current show positive deviation or negative deviation correspondingly, indicating that platinum has been successfully deposited on MWCNTs/GCE. Fig. 3(D) shows the EIS results on bare GCE (a), Pt/GCE (b), MWCNTs/GCE (c), and Pt/MWCNTs/GCE (d). Clearly, the diameter of the semicircle (curve d) is smaller and the slope of the straight line is higher than those of other electrodes, indicating that the surface of the electrode forms a layer of Pt, which can be used as an electron transfer medium to enhance the electron transfer.
3.3 Electrochemical behavior of HQ on modified electrodes
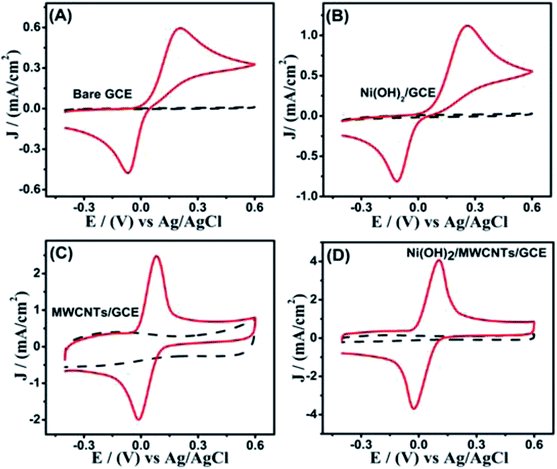
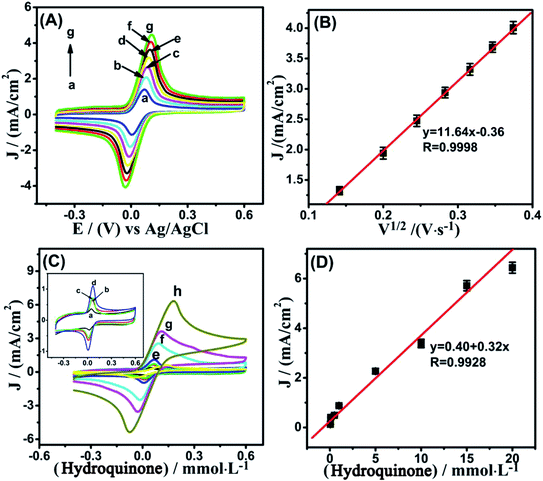
To analyze electrocatalytic redox phenomena of different electrodes to HQ oxidation, a comparative study was conducted by CV in 0.1 mol L−1 PBS with range from −0.4–0.6 V with a scanning rate of 50 mV s−1. There are no distinct redox peaks on bare GCE, Ni(OH)2/GCE, MWCNTs/GCE, and Ni(OH)2/MWCNTs/GCE in 0.1 mol L−1 PBS without addition of HQ (black dash line) in Fig. 4(A–D). However, it can be seen from Fig. 4 that all of the electrodes show huge change in the redox current density upon addition of HQ, indicating the better electrocatalytic properties of the nanomaterials for HQ oxidation. It can be concluded that the electrochemical response of Ni(OH)2/MWCNTs/GCE electrode is intensively higher than those of bare GCE, Ni(OH)2/GCE, and MWCNTs/GCE electrodes.Fig. 5(A) shows the relationship of scan rate to the peak currents, a gradual shift of the peak potential in CV curves (positive shift for anodic and negative shift for cathodic peak) is detected in the range of 20–140 mV s−1 and the scan rate is linear to 1/2 of the peak current in Fig. 5(B). It is also indicated that the whole electrochemical reaction is a kinetic limitation. In Fig. 5(C), with the increasing HQ concentration, the same phenomenon of anodic and cathodic peak current in CVs also occur, and these high current densities were linear with both flow rate and HQ concentration in the range from 0.05 to 20 mmol L−1 in Fig. 5(D). It is obvious that Ni(OH)2/MWCNTs nanocomposite owning more outstanding catalytic performance.
3.4 Electrocatalytic behavior of Pt/MWCNTs as cathode material
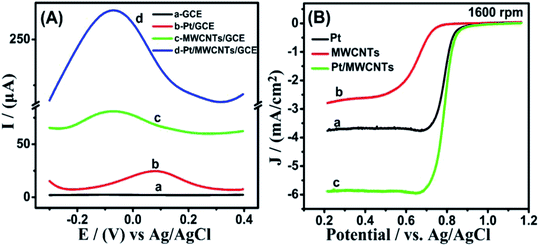
Square wave voltammetry (SWV) and linear sweep voltammetry (LSV) was carried out to study the oxygen reduction reaction (ORR) activity. It can be seen from Fig. 6(A) that Pt/MWCNTs/GCE (d) electrode shows a higher oxygen reduction peak than those of bare GCE (a), Pt/GCE (b) and MWCNTs/GCE (c) electrodes, which indicate that Pt/MWCNTs is an excellent catalyst and can be used to further study the ORR activity. LSV measurements at 1600 rpm in Fig. 6(B), which can further prove that the ORR activity of Pt/MWCNTs is best with highest half-wave potential and diffusion limiting current density. The diffusion limiting current density of the Pt/GCE, MWCNTs/GCE and Pt/MWCNTs/GCE is 3.76, 2.79 and 5.88 mA cm−2, respectively. And the half-wave potential is 0.788, 0.651 and 0.809 V, respectively.In fact, platinum itself has a good catalytic effect on the reduction reaction of oxygen. However, in the presence of carbon tubes, the composites exhibited better catalytic properties. As mentioned above, the synergistic effect of MWCNTs composite with various nanomaterials often can significantly improve the catalytic performance of materials.
3.5 Performance of the fuel cell
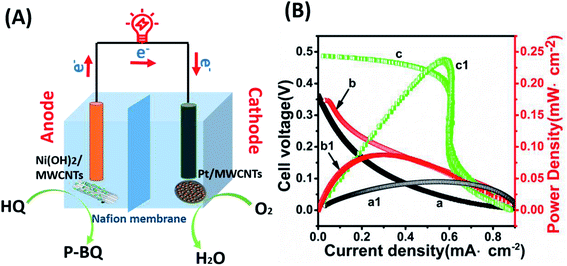
The fuel cell test results suggest that the Ni(OH)2/MWCNTs nanomaterials have excellent catalytic activity to HQ, while Pt/MWCNTs have ORR activity when worked as an cathode. Hence, an H-type electronical device was constructed with Ni(OH)2/MWCNTs and Pt/MWCNTs as anode and cathode materials, respectively.The detailed mechanisms of whole reactions, illustrated in Fig. 7(A), indicate that after the electrons and protons are produced from HQ, the electrons transfer to the cathode connected with external circuit, and the protons transferred through Nafion membrane. On the anode, HQ is correspondingly oxidized into P-benzoquinone (P-BQ), whereas oxygen is reduced on the cathode, thus completing the redox reaction for BFC operation. The overall reaction mechanisms in HQ fuel cell are represented as follows:
| Anode: C6H4(OH)2 → C6H4O2 + 2H+ + 2e− E = 0.794 V |
| Cathode: 1/2O2 + 2H+ + 2e− → H2O E = 1.229 V |
| All: C6H4(OH)2 + 1/2O2 → C6H4O2 + H2O E = 0.435 V |
The polarization and power density curves of HQ fuel cell are shown in Fig. 7(B). It is obvious that the performance of the fuel cell constructed by the composite material (curve c and c1) is significantly better than that of the single Ni(OH)2 (curve a and a1), or MWCNTs (curve b and b1). As can be read, a peak power density of 0.24 mW cm−2 at an open circuit voltage (Voc) of around 0.49 V was obtained (curve c and c1). Most strikingly, the value of Pmax of the Ni(OH)2/MWCNTs based biofuel cell is distinctly higher than the previously reported enzyme-based BFCs31,32 or precious metal-based BFCs.33,34 Furthermore, the electrocatalytic performance of Ni(OH)2/MWCNTs is better than single Ni(OH)2 or MWCNTs catalysts, which indicates that the prepared composites is more suitable as an anode catalyst for biofuel cells.
4. Conclusion
A non-enzyme MWCNTs-based hydroquinone fuel cell has been assembled and shows high power density in neutral solution. Ni(OH)2/MWCNTs was successfully prepared by hydrothermal method for the anodic material and could effectively oxidize hydroquinone in neutral PBS. It is apparent that the Ni(OH)2/MWCNTs anodic catalyst played a dominant role in enhancing the catalytic activity and performance of HQ fuel cell. Accordingly, a biofuel cell was constructed with Ni(OH)2/MWCNTs and Pt/MWCNTs as anode and cathode materials, respectively. As a result, it showed a high power density of 0.24 mW cm−2 at cell potential of 0.49 V, which can provide an experimental basis for the degradation of phenolic pollutants and simultaneously produce electric energy in real life in the future.Conflicts of interest
There are no conflicts of interest to declare.Acknowledgements
This work was supported by the NSFC (21765017, 21765016 and 21567021). It was also supported by Ningxia Science and Technology Innovation Leading Talents Training (KJT2018002).References
- M. Nishizawa, J. Power Sources, 2019, 408, 1–6 Search PubMed.
- K. Herkendell, A. Stemmer and R. Tel-Vered, Nano Res., 2019, 12, 767–775 CrossRef CAS.
- V. B. Oliveira, J. P. Pereira and A. M. F. R. Pinto, Energy, 2017, 133, 652–665 CrossRef CAS.
- X. Wang, J. H. Kim and Y. B. Choi, Korean J. Chem. Eng., 2019, 36, 1172–1183 CrossRef CAS.
- J. H. Franco, K. J. Klunder and V. Russell, Electrochim. Acta, 2020, 331, 135254 CrossRef CAS.
- C. Ma, N. He and Y. Zhao, Appl. Biochem. Biotechnol., 2019, 189, 1291–1303 CrossRef CAS.
- S. L. Allen and F. P. Zamborini, Langmuir, 2019, 35, 2137–2145 CrossRef CAS.
- R. Cabrera-Alonso, E. Guevara and M. Ramírez-Elías, Skin. Res. Technol., 2019, 25, 20–24 CrossRef CAS.
- G. Ma, H. Xu and M. Wu, Microchim. Acta, 2019, 186, 689 CrossRef.
- J. J. William, I. M. Babu and G. Muralidharan, Mater. Chem. Phys., 2019, 224, 357–368 CrossRef CAS.
- Z. Liu, Y. Zhang and J. Feng, Sens. Actuators, B, 2019, 287, 551–556 CrossRef CAS.
- Y. Liu, C. Yan and G. Wang, ACS Appl. Mater. Interfaces, 2019, 11, 9984–9993 CrossRef CAS.
- X. Wang, P. Sebastian and A. C. Millan, J. New Mater. Electrochem. Syst., 2005, 8, 101–108 CAS.
- Z. Zhai, Q. Liu and Y. Zhu, J. Alloys Compd., 2019, 775, 1316–1323 CrossRef CAS.
- V. Boychuk, V. Kotsyubynsky and B. Rachiy, Mater. Today: Proc., 2019, 6, 106–115 CAS.
- S. Kettaf, O. Guellati and A. Harat, SN Appl. Sci., 2019, 1, 34 CrossRef.
- L. A. Saghatforoush, M. Hasanzadeh and S. Sanati, Bull. Korean Chem. Soc., 2012, 33, 2613–2618 CrossRef CAS.
- J. Acharya, B. G. S. Raj and T. H. Ko, Int. J. Hydrogen Energy, 2020, 45, 3073–3085 CrossRef CAS.
- J. Ji, J. Woo and Y. Chung, Chem. Eng. J., 2020, 381, 122679 CrossRef CAS.
- M. A. Ashraf, Z. Liu and D. Zheng, Phys. E, 2020, 116, 113723 CrossRef CAS.
- K. Zhao, S. Li and M. Huang, Chem. Eng. J., 2019, 358, 924–935 CrossRef CAS.
- Y. Prabhu, B. Sreedhar and U. Pal, Mater. Today: Proc., 2019, 8, 419–426 CAS.
- C. Zhang, J. Ren and Y. Xing, Mater. Sci. Eng., C, 2020, 108, 110214 CrossRef CAS.
- Z. Duan, C. Huang and X. Yang, Anal. Bioanal. Chem., 2020, 9, 1–10 Search PubMed.
- M. Shi, Y. Li and H. Cui, Micro Nano Lett., 2019, 14, 1151–1156 CrossRef CAS.
- K. Khoshnevisan, H. Maleki and E. Honarvarfard, Microchim. Acta, 2019, 186, 49 CrossRef.
- D. Zhu, C. Xia, Z. Yang, T. Yang, Q. Li and R. Liu, Electrochim. Acta, 2020, 334, 135591 CrossRef CAS.
- B. Zhang, J. Liu and J. Wang, Nano Energy, 2017, 37, 74–80 CrossRef CAS.
- M. J. Sampaio and R. R. Bacsa, J. Catal., 2015, 331, 172–180 CrossRef CAS.
- S. Yang, G. Li and D. Wang, Sens. Actuators, B, 2017, 238, 588–595 CrossRef CAS.
- H. Sakamoto, A. Koto and E. I. Takamura, J. Nanosci. Nanotechnol., 2019, 19, 3551–3557 CrossRef CAS.
- K. Kuroishi, T. Doi and K. Hoshi, IEICE Trans. Electron., 2019, 102, 159–163 CrossRef.
- G. Slaughter and T. Kulkarni, Microelectron. Eng., 2016, 149, 92–96 CrossRef CAS.
- L. Yang, Y. Zhang and M. Chu, Biosens. Bioelectron., 2014, 52, 105–110 CrossRef CAS.
Footnote |
| † The author and the first author contributed equally to this paper. |
| This journal is © The Royal Society of Chemistry 2020 |


