 Open Access Article
Creative Commons Attribution 3.0 Unported Licence
Surfactant concentration modulates the motion and placement of microparticles in an inhomogeneous electric field†
Marcos K. Masukawa a,
Masayuki Hayakawa
 bc and
Masahiro Takinoue
 *ab
*ab
aDepartment of Computer Science, Tokyo Institute of Technology, 4259 Nagatsuta-cho, Midori-ku, Yokohama, Kanagawa 226-8502, Japan
bDepartment of Computational Intelligence and Systems Science, School of Computing, Tokyo Institute of Technology, 4259 Nagatsuta-cho, Midori-ku, Yokohama, Kanagawa 226-8502, Japan. E-mail: takinoue@c.titech.ac.jp
cRIKEN Center for Biosystems Dynamics Research, Kobe, Hyogo 650-0047, Japan
First published on 2nd March 2020
Abstract
This study examined the effects of surfactants on the motion and positioning of microparticles in an inhomogeneous electric field. The microparticles were suspended in oil with a surfactant and the electric field was generated using sawtooth-patterned electrodes. The microparticles were trapped, oscillating, or attached to the electrodes. The proportion of microparticles in each state was defined by the concentration of surfactant and the voltage applied to the electrodes. Based on the trajectory of the microparticles in the electric field, we developed a new physical model in which the surfactant adsorbed on the microparticles allowed the microparticles to be charged by contact with the electrodes, with either positive or negative charges, while the non-adsorbed surfactant micellizing in the oil contributed to charge relaxation. A simulation based on this model showed that the charging and charge relaxation, as modulated by the surfactant concentration, can explain the trajectories and proportion of the trapped, oscillating, and attached microparticles. These results will be useful for the development of novel self-assembly and transport technologies and colloids sensitive to electricity.
Introduction
Techniques for manipulating microparticles are important in physical, chemical, and biological research.1 Fundamentally, the ability to control small particles in small volumes can help elucidate the mechanisms that operate at the μm scale. From a practical point of view, these mechanisms can be explored to build sensors and actuators—thereby extending the capabilities of microfluidic devices and display technologies and bridging the macro- and nanoscale.2Researchers have used optical tweezers,3 surface acoustic waves,4 chemical gradients,5 and magnetic6 and electric fields,7–14 among other non-contact methods, to manipulate microparticles. Electric fields represent an attractive method for controlling microparticles in particular. For instance, electrodes can be designed to produce specific electric fields that can be quickly modulated via changes in the frequency and amplitude of the applied voltage.15 Microparticle movement in an electric field is often referred to as electrokinetics, and distinct mechanisms govern the interactions of microparticles with electric fields for displacement in a controlled manner.16,17 Examples include dielectrophoresis via the application of an inhomogeneous electric field11,15,18,19 and contact charge electrophoresis, when the particle charge is modified by contact with a charged object.9,10,20
To control a particle using an electric field, easily modified electric and dielectric properties of the particle and surrounding medium are desirable. Surfactants can modify the medium conductivity21–24 and charge microparticles suspended in apolar liquids.24–32 Although not fully understood, the modification of electrical properties of apolar colloids by surfactant addition is of great importance in industry as it is used to control the electrical properties of ink in printing processes.21 This is also used to prepare electrophoretic ink displays to control the position of the pigment microparticles8 and to set their position in an organized manner to form colloidal crystals,33 which can be used as photonic materials. Therefore, significant interest has been generated in the chemical synthesis of novel surfactants suitable for particle control,27 to clarify the role of surfactants in electrokinetics and extend its applications. However, the effect of surfactant concentration on the electrokinetics of microparticles remains unclear due to the challenges of producing a model that considers the surfactant concentration effect on both contact charge electrophoresis and charge relaxation. Such a model would be useful to predict the ideal surfactant concentration for the manipulation of microparticles by electric fields.
Herein, the effect of concentration of a neutral surfactant on microparticles suspended in an apolar liquid subject to an inhomogeneous electric field was studied. Based on the experimental observations, a model of particle charging and charge relaxation modulated by the surfactant for definition of displacement and position of the microparticles was developed and investigated.
Materials and methods
Sample preparation of microparticle suspension in oil with a surfactant
Liquid paraffin (Wako, 128-04375) was used as an oil phase, Sorbitan Monooleate (Span 80) (TCI chemicals, S0060) as a neutral surfactant, and polystyrene microbeads 20 μm in diameter (Micromod, 01-00-204) as microparticles. A stock solution was prepared by vortexing liquid paraffin and 0.0001% (w/w) Span 80, sonicating the mixture at 45 °C for 1 h and adding microparticles. A low concentration of microparticles, 0.01% (w/w), was used to minimize the interaction between microparticles. The stock was vortexed and sonicated again at 45 °C for 1 h. Afterwards, microparticle suspensions with different concentrations of surfactant were prepared by adding Span 80 to the stock solution, vortexing, sonicating at 45 °C for 1 h, and leaving the mixture to equilibrate for 1 h. Suspensions of microparticles were prepared in liquid paraffin with Span 80 concentrations ranging from 0.0001 to 5% (w/w).Sample preparation of the fluorescent reverse micelles
Reverse micelles of Span 80 aggregates containing fluorescein were prepared following the protocol described by Anton et al. (2011).34 First, a saturating amount of fluorescein (Sigma-Aldrich, F6377-100G) was added to liquid paraffin containing 0.1% (w/w) Span 80. The dispersion was then vortexed and sonicated at 45 °C. To remove fluorescein crystals, the dispersion was centrifuged for 10 min at 2000 × g and the supernatant was collected, with the process being repeated three times. Afterwards, the fluorescent dispersion of Span 80 was diluted to 0.005% (w/w) and the microparticles were added. The samples were subsequently vortexed and sonicated at 45 °C for 1 h. To prepare the fluorescent samples with different surfactant concentrations, Span 80 was added without fluorescein to the desired concentration. Fluorescent samples in concentrations of 0.005% (w/w) (no additional surfactant), 0.05% (w/w), 0.5% (w/w), and 5% (w/w) were prepared.Microelectrode fabrication
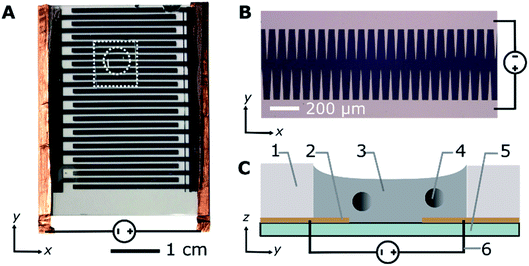
Interdigitated microelectrodes with sawtooth edges and a 70 μm gap between the teeth (Fig. 1A and B) were prepared using the lift-off method.35 Briefly, a S1818G photoresist (Microchem) was spin coated onto a micro cover glass No. 5 (Matsunami) treated with plasma oxidation (90 s on an ion bombarder, Vacuum Device Co., Ltd) and silylated with hexamethyldisilazane (HMDS, Wako AWK3814) via vapour phase deposition.36 The photoresist was spin coated at a maximum spin frequency of 3000 rpm for 30 s (Opticoat SpinCoater, Mikasa). Subsequently, the slide was pre-baked for 1 min at 115 °C, cooled to room temperature, and exposed using a maskless pattern generator with resolution of 3 μm (μPG 101, Heidelberg Instruments; laser wavelength, 375 nm). Afterwards, the photoresist was developed with tetramethylammonium hydroxide solution 2.38% (OFPR-NMD-3, Tokyo Ohka Kogyo Co., Ltd.) and cleaned with isopropyl alcohol (IPA, Kanto Chemical Co. Inc. JIS K8839). The developed slide was then coated sequentially with chromium and gold using a metal evaporator (VE2012 TMP vacuum evaporator, Vacuum Device Co., Ltd). Finally, the undeveloped photoresist was removed with acetone (Wako, DSG4138), revealing a sawtooth pattern. ESI Method 1† contains additional details regarding the sample preparation.Microscopic measurements
To track the microparticle position, 12 μL samples were placed directly on top of the microelectrodes and placed in a polydimethylsiloxane (PDMS) gasket with a 5 mm diameter (Fig. 1A and C). Direct current (DC) voltages of 100, 200, and 300 V were sequentially applied to the electrodes using a DC power supply (GWInstek, GPR30H10D). The measurements were performed in triplicate for all voltages and surfactant concentrations and, on average, the trajectory of 51 ± 21 microparticles per surfactant concentration per voltage were analysed for each experiment. The position of the microparticles was recorded using a phase contrast microscope (Olympus, CKX41) and digital camera (Canon, EOS60D). From the recorded videos, the positions of the individual microparticles were tracked using custom image analysis software and the Python package Trackpy37 and the motion patterns of the beads were classified (ESI Method 2†). Fluorescent samples were used to observe the location of the Span 80 aggregates and measure the ratio of the dispersed to adsorbed surfactant on the microparticles (ESI Method 3†). A fluorescence microscope (Olympus, IX71) equipped with a sCMOS camera (Andor, Zyla) was used to observe the fluorescent samples. The microscope was equipped with a mercury lamp source, mirror unit with 470–490 nm band-pass excitation filter, 505 nm dichroic mirror, and 510–550 nm band-pass emission filter (Olympus, NIBA).Numerical simulations
The finite element software COMSOL Multiphysics (COMSOL Inc., v4.3), was used to calculate the electric and dielectric fields generated by the saw tooth electrodes at 200 V. Using the fields, the trajectory of 500 microparticles with random initial conditions under 12 different surfactant concentrations were monitored, totalling 6000 simulated trajectories. For the simulation, a custom Python script with the Runge–Kutta 4th order was used for numerical integration. After simulation, the robustness of the obtained results was determined by comparing 10 random subsets of trajectories. The theory for the simulation is discussed in the Results and ESI Discussions 1 and 2,† while the choice of parameters is discussed in the ESI Note 1.†Results and discussion
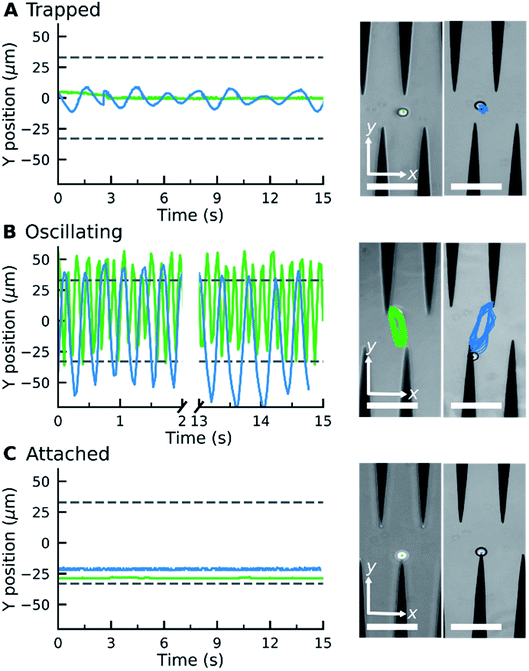
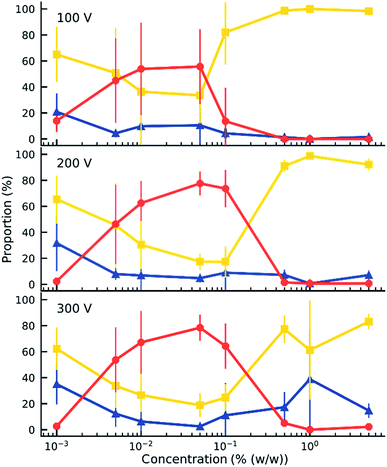
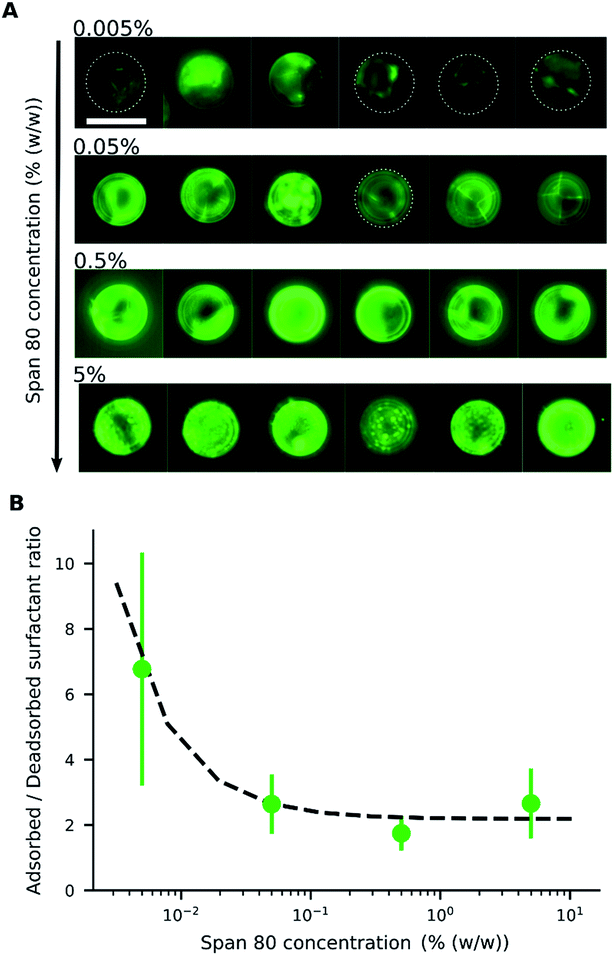
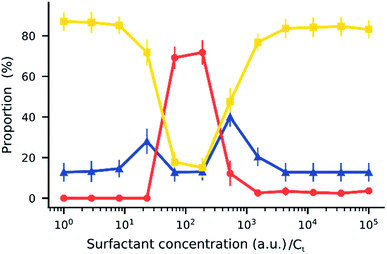
When an electric field was applied to the dispersed microparticles in oil with surfactant using sawtooth electrodes, the microparticles exhibited one of three motion patterns regarding their position and displacement as follows: ‘trapped’, when the microparticle remained between the electrodes without touching them Fig. 2A; ‘oscillating’, when the microparticles moved periodically between the electrodes Fig. 2B; and ‘attached’, when the microparticles remained in close contact with one of the electrodes Fig. 2C. The microparticles in the same sample did not all exist in the same state and, on occasion, a microparticle would switch from one state to another. However, the proportion of microparticles in a certain state within a sample remained approximately constant depending on the surfactant concentration and applied voltage (Fig. 3). The oscillating microparticles were most abundant when the surfactant concentration was approximately 0.05% (w/w), while most microparticles were in the attached state when the surfactant concentration was <0.005% (w/w) or >0.5% (w/w).To investigate the role of the surfactant in the mechanism of motion, reverse micelles of Span 80 with a loaded fluorescent dye were used to observe the location of the surfactant within the dispersion. The surfactant reverse micelles with fluorescein were initially dispersed homogeneously, but they subsequently adsorbed on the microparticle surfaces (Fig. 4A). The adsorption was not homogeneous among the microparticles and varied depending on the final concentration of surfactant (Fig. 4A). Fluorescein sodium is a salt and does not dissolve in oil or adsorb directly on the surface of the polystyrene microparticles; therefore, the average fluorescence intensity of the beads and the background was assumed to be proportional to the local concentration of surfactant. We assumed for simplicity that the adsorption of reverse micelles loaded with fluorescein on the microparticle surface does not significantly enhance the self-quenching of fluorescein, which could occur when fluorescein concentration increases,38 causing an underestimation of adsorption at higher surfactant concentrations.
By measuring the fluorescence ratio between the microparticles and oil, the ratio of the surfactant on the microparticle surface to that in the oil was determined (Fig. 4B). At low surfactant concentrations, the ratio of adsorbed surfactant on the desorbed surfactant was high, but the surface of the microparticles became saturated with a constant ratio as the surfactant concentration increased. The ratio of absorbed to desorbed surfactant, derived from the Langmuir adsorption model,39 is given by eqn (1):
 | (1) |
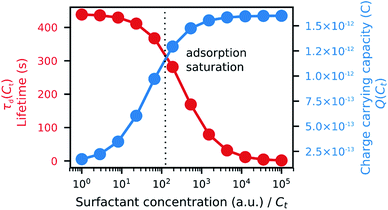
As the reverse micelles can stabilize charges in apolar media,22,25,30,40,41 two properties of the suspension depend on surfactant concentration: the microparticle charge and medium conductivity. These properties depend mainly on the local surfactant concentration; that is, the microparticle charge is limited by the amount of surfactant adsorbed, Cad, while the medium conductivity, σ, is limited by the amount of surfactant in the medium, Cd. The charge ceiling of the microparticle was defined as the charge carrying capacity Q(Ct), as in eqn (2) below:
 | (2) |
The conductivity of a medium is proportional to the surfactant concentration in it (observed for Span 80 in hexane28 and isopar-L41), which can be defined in terms of the charge relaxation law: if a charged particle is suspended in a fluid with uniform conductivity, σ, and dielectric constant, εm, its charge decays with a time constant τd = εm/σ.42 Therefore, considering the surfactant effects on the medium conductivity, eqn (3) can be obtained:
 | (3) |
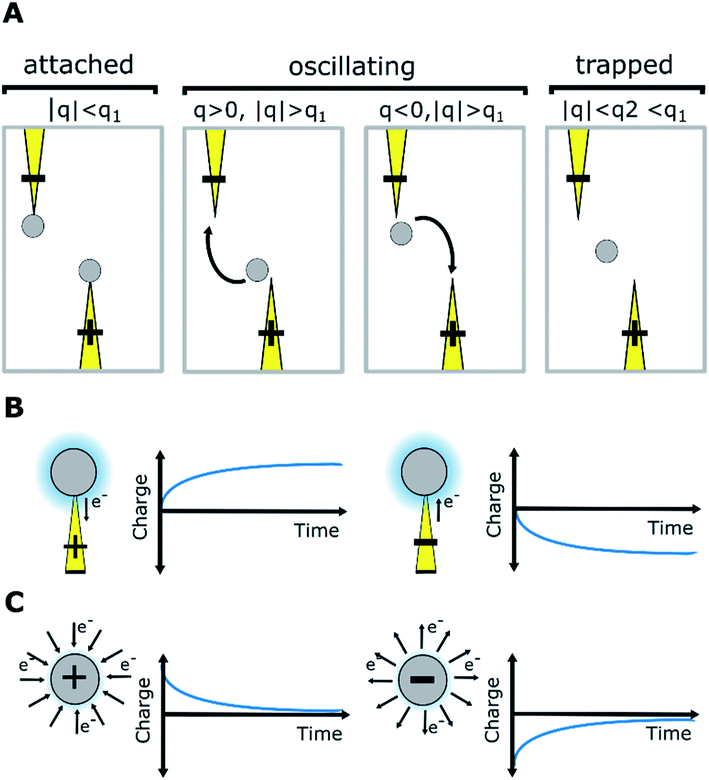
From the experimental trajectories of the microparticles, as those shown in Fig. 2, it is possible to guess the sign and magnitude of the microparticle charge (Fig. 6A). For example, a microparticle attaches to the electrodes when its instant charge q is smaller than a charge threshold q1, q1 such that the electric force is smaller than the dielectric and viscous forces. If the charge is above this threshold, the particles migrate to the electrodes of opposite charge. However, when the particle is migrating, it can eventually be trapped between the electrodes, where the dielectric force is null, if the electric force is smaller than the viscous force, that is, if the microparticle instant charge is smaller than q2, q2 being smaller than q1. The oscillating microparticles show the microparticle can exchange charge when they touch the electrodes, while trapped microparticles show they can lose charge when they are not touching the electrode, as defined by the charge relaxation law (Fig. 6B). Eqn (4) was used to describe the change in charge after a microparticle touches an electrode, which is derived from the charging of a sphere by a unipolar current42–46 (see ESI Discussion 2†):
 | (4) |
| q(t′′) = qde−t′′/τd | (5) |
In our model, Q and τd are functions of the surfactant concentration (eqn (2) and (3)). In that sense, the surfactant in an apolar medium promotes opposing mechanisms of particle charging and charge relaxation, both of which depend on concentration.
Using eqn (2)–(5) and parameters estimated from the literature (see ESI Note 1†), the trajectories of 500 microparticles were simulated while varying the charge carrying capacity and charge relaxation lifetime, while emulating increasing surfactant concentrations (Fig. 7). To simulate the particle trajectory, the electric and dielectric fields were simulated using finite elements software. The electric force  ,
,
 | (6) |
 is the microparticle position. The dielectric force
  , which originates from the interaction of the inhomogeneous electric field and particle dipole, can be given as follows:
 | (7) |
It is proportional to R3, where R is the particle radius and depends on εm and εp, the dielectric constants of the medium and particle, respectively. In our system, εm > εp, which means the dielectric force attracts the microparticles towards the electrode tips, where the electric field is more divergent. Thereafter, the overdamped equation of motion can be constructed as follows:
 | (8) |
During the simulation, small variations in the initial conditions—such as initial position, velocity, and charge—yielded different trajectories (see ESI Note 2†). To account for this observation, the simulations were performed using 500 initial conditions that were later randomly split into 10 sets; the results are shown in Fig. 7. The simulation suggests that the trajectory of a microparticle depends on its initial conditions, although the proportion of each motion pattern is approximately constant and defined by surfactant concentration.
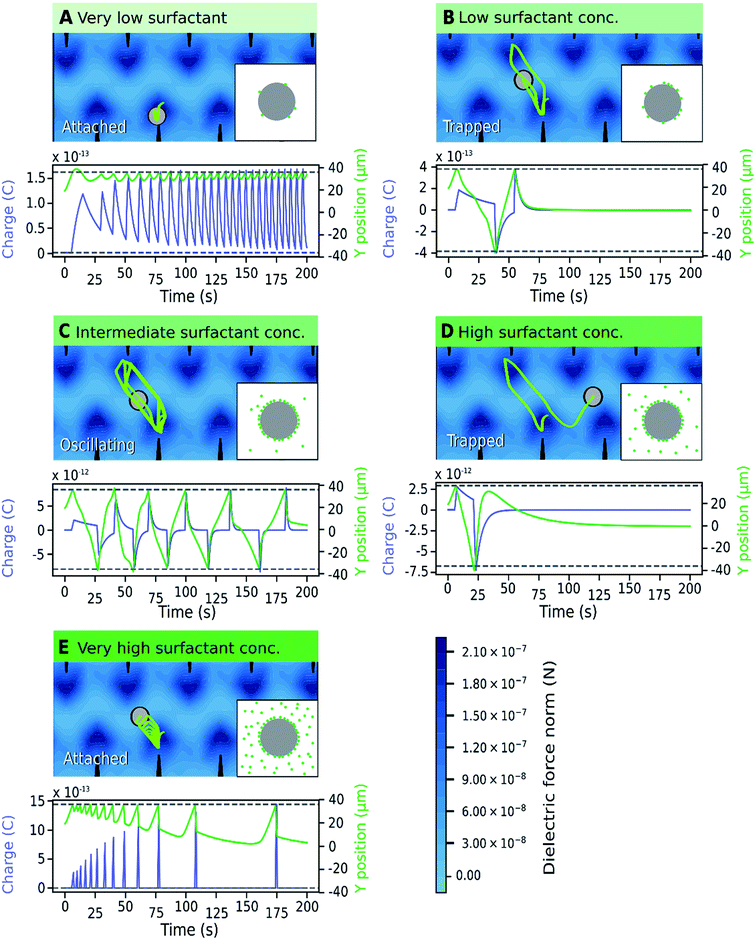
The relationship between particle trajectory and charge was examined to better understand the origin of the different motion patterns. A representative simulation of a particle trajectory is shown in Fig. 8, with the model of local concentration of surfactant aggregates in the insets. The surfactant concentration changes the microparticle charge carrying capacity and relaxation lifetime, which changes the balance between the dielectric force (field shown in Fig. 8) and electric force. The dielectric force pushes the particle towards the electrode tips whereas the electric force depends on the position and particle charge, which changes dynamically due to charging and charge relaxation mechanisms enabled by the surfactant. When a microparticle is charged, it migrates towards the electrode with the opposite charge. Generally, attached microparticles were observed when the dielectric force was dominant and forced them close to the electrode tips. This occurred at very low and very high surfactant concentrations. At very low concentrations, the surfactant concentration is low both on the microparticle and in the medium and the microparticle charge is low. At very high surfactant concentrations, charge relaxation is rapid due to the increased amount of surfactant in the medium and microparticles have a low average charge. At marginally low and marginally high surfactant concentrations, trapped microparticles were more common. Trapped microparticles were observed when the charge decayed while the microparticles were close to the stable point between the electrodes, where the dielectric force is null. Oscillating microparticles were most common at intermediate surfactant concentrations, when the charge carrying capacity and charge relaxation lifetime were high. At this concentration range, the microparticle has sufficient charge to reach the opposite electrode without becoming trapped at the stable point. When the particle reaches the opposite electrode, it is charged with the opposite charge and thus the cycle is restarted.
A comparison of Fig. 7 and 3 demonstrates the newly developed model succeeds in explaining the enhanced oscillation or trapping at certain surfactant concentration and the concentration thresholds. It should be cautioned that the model is two-dimensional, estimating forces on the microparticles that are not equivalent to what would be expected in actual experiments. For instance, in Fig. 8 the oscillating frequencies are significantly lower than those observed experimentally (Fig. 2). Furthermore, changes in other parameters of the system were not considered, but are expected upon increasing surfactant addition, such as the dielectric constant47 and viscosity.48
Conclusions
Surfactants change the electrokinetics of microparticles by enabling their charging and discharging in an electric field. Varying surfactant concentration changes the ratio of surfactant adsorbed on the microparticle to that in the medium, which charges the microparticles when in contact with electrodes and discharges the microparticle in the medium. The change in charge modifies the balance between the electric, dielectric, and viscous forces, creating a dynamic system wherein the microparticles display different motion patterns depending on surfactant concentration. This indicates that a static, inhomogeneous electric field is a versatile tool for particle control and surfactants can act as a mediator to integrate micromachines and digital devices. The further understating of microparticle charging mediated by surfactants may allow for the improved self-assembly of microstructures,49 motion of microrobots,50 and individual microparticle control51 by designing novel electrode geometries. The newly developed model can also provide a rationale for the syntheses of novel surfactants for use in electric sensitive colloids52 by tuning surfactant adsorption and charged aggregate formation.Conflicts of interest
There are no conflicts to declare.Acknowledgements
This research was supported by JSPS KAKENHI grants to M. T. (No. JP17H01813, JP18K19834), Research Encouragement Grants from The Asahi Glass Foundation to M. T., Support for Tokyo Tech Advanced Researchers (STAR) to M. T., and Japanese Government (MEXT) Scholarship for foreign students to M. K. M.Notes and references
- X. Peng, L. Lin, E. H. Hill, P. Kunal, S. M. Humphrey and Y. Zheng, J. Phys. Chem. C, 2018, 122, 24226–24234 CrossRef PubMed.
- S. B. Smith, L. Finzi and C. Bustamante, Sci. 80, 1992, 258, 1122–1126 CrossRef PubMed.
- J. Liesener, M. Reicherter, T. Haist and H. J. Tiziani, Opt. Commun., 2000, 185, 77–82 CrossRef.
- Z. Wang and J. Zhe, Lab Chip, 2011, 11, 1280–1285 RSC.
- D. C. Prieve, J. L. Anderson, J. P. Ebel and M. E. Lowell, J. Fluid Mech., 1984, 148, 247–269 CrossRef.
- S. S. Shevkoplyas, A. C. Siegel, R. M. Westervelt, M. G. Prentiss and G. M. Whitesides, Lab Chip, 2007, 7, 1294–1302 RSC.
- F. Strubbe, F. Beunis, M. Marescaux, B. Verboven and K. Neyts, Appl. Phys. Lett., 2008, 93, 254106 CrossRef.
- B. Comiskey, J. D. Albert, H. Yoshizawa and J. Jacobson, Nature, 1998, 394, 253 CrossRef.
- M. Takinoue, Y. Atsumi and K. Yoshikawa, Appl. Phys. Lett., 2010, 96, 104105 CrossRef.
- A. M. Drews, C. A. Cartier and K. J. M. Bishop, Langmuir, 2015, 31, 3808–3814 CrossRef PubMed.
- T. D. Edwards and M. A. Bevan, Langmuir, 2014, 30, 10793–10803 CrossRef PubMed.
- D. Yamamoto, R. Yamamoto, T. Kozaki, A. Shioi, S. Fujii and K. Yoshikawa, Chem. Lett., 2017, 46, 1470–1472 CrossRef.
- T. Kurimura, S. Mori, M. Miki and K. Yoshikawa, J. Chem. Phys., 2016, 145, 34902 CrossRef PubMed.
- M. Hayakawa, Y. Kishino and M. Takinoue, arXiv:1912.04659 [cond-mat.soft].
- Y. Huang and R. Pethig, Meas. Sci. Technol., 1991, 2, 1142 CrossRef.
- O. D. Velev, S. Gangwal and D. N. Petsev, Annual Reports Section “C” (Physical Chemistry), 2009, 105, 213–246 RSC.
- M. Z. Bazant, M. S. Kilic, B. D. Storey and A. Ajdari, Adv. Colloid Interface Sci., 2009, 152, 48–88 CrossRef PubMed.
- T. B. Jones, IEEE Eng. Med. Biol. Mag., 2003, 22, 33–42 Search PubMed.
- W. Choi, S.-H. Kim, J. Jang and J.-K. Park, Microfluid. Nanofluid., 2007, 3, 217–225 CrossRef.
- M. Hase, S. N. Watanabe and K. Yoshikawa, Phys. Rev. E, 2006, 74, 046301 CrossRef.
- I. D. Morrison, Colloids Surf., A, 1993, 71, 1–37 CrossRef.
- E. L. Michor, B. S. Ponto and J. C. Berg, Langmuir, 2016, 32, 10328–10333 CrossRef.
- Q. Guo, V. Singh and S. H. Behrens, Langmuir, 2009, 26, 3203–3207 CrossRef PubMed.
- M. F. Hsu, E. R. Dufresne and D. A. Weitz, Langmuir, 2005, 21, 4881–4887 CrossRef PubMed.
- C. Schreuer, S. Vandewiele, T. Brans, F. Strubbe, K. Neyts and F. Beunis, J. Appl. Phys., 2018, 123, 15105 CrossRef.
- H. Cao, N. Lu, B. Ding and M. Qi, Phys. Chem. Chem. Phys., 2013, 15, 12227–12234 RSC.
- G. N. Smith and J. Eastoe, Phys. Chem. Chem. Phys., 2013, 15, 424–439 RSC.
- C. E. Espinosa, Q. Guo, V. Singh and S. H. Behrens, Langmuir, 2010, 26, 16941–16948 CrossRef.
- J. Lee, Z.-L. Zhou, G. Alas and S. H. Behrens, Langmuir, 2015, 31, 11989–11999 CrossRef.
- G. S. Roberts, R. Sanchez, R. Kemp, T. Wood and P. Bartlett, Langmuir, 2008, 24, 6530–6541 CrossRef.
- M. M. Gacek and J. C. Berg, Adv. Colloid Interface Sci., 2015, 220, 108–123 CrossRef.
- Q. Guo, J. Lee, V. Singh and S. H. Behrens, J. Colloid Interface Sci., 2013, 392, 83–89 CrossRef.
- L. Ramos, T. C. Lubensky, N. Dan, P. Nelson and D. A. Weitz, Sci. 80, 1999, 286, 2325–2328 CrossRef.
- N. Anton, H. Mojzisova, E. Porcher, J.-P. Benoit and P. Saulnier, Int. J. Pharm., 2010, 398, 204–209 CrossRef.
- G. M. Whitesides, E. Ostuni, S. Takayama, X. Jiang and D. E. Ingber, Annu. Rev. Biomed. Eng., 2001, 3, 335–373 CrossRef PubMed.
- F. Deyhimi and J.-L. Munoz, J. Appl. Electrochem., 1984, 14, 803–806 CrossRef.
- D. B. Allan, T. A. Caswell and N. C. Keim, github.com/soft-matter/trackpy.
- A. Hennig, H. Borcherding, C. Jaeger, S. Hatami, C. Würth, A. Hoffmann, K. Hoffmann, T. Thiele, U. Schedler and U. Resch-Genger, J. Am. Chem. Soc., 2012, 134(19), 8268–8276 CrossRef PubMed.
- I. Langmuir, J. Am. Chem. Soc., 1932, 54, 2798–2832 CrossRef.
- A. Dukhin and S. Parlia, Curr. Opin. Colloid Interface Sci., 2013, 18, 93–115 CrossRef.
- E. L. Michor and J. C. Berg, Langmuir, 2015, 31, 9602–9607 CrossRef PubMed.
- H. A. Haus and J. R. Melcher, Electromagnetic fields and energy, Prentice Hall, 1989 Search PubMed.
- W. B. Smith and J. R. McDonald, J. air Pollut. Control Assoc., 1975, 25, 168–172 CrossRef.
- M. Pauthenier and M. Moreau-Hanot, J. Phys. Radium, 1932, 3, 590–613 CrossRef.
- H. J. White, in Industrial electrostatic precipitation, Addison-Wesley, 1963 Search PubMed.
- L. Dascalescu, D. Rafiroiu, A. Samuila and R. Tobazeon, in Industry Applications Conference, 1995, Thirtieth IAS Annual Meeting, IAS'95, Conference Record of the 1995 IEEE, 1995, vol. 2, pp. 1229–1234 Search PubMed.
- W. G. Gorman and G. D. Hall, J. Pharm. Sci., 1963, 52, 442–446 CrossRef PubMed.
- T. Kinugasa, A. Kondo, S. Nishimura, Y. Miyauchi, Y. Nishii, K. Watanabe and H. Takeuchi, Colloids Surf., A, 2002, 204, 193–199 CrossRef.
- M. Hagiya, A. Konagaya, S. Kobayashi, H. Saito and S. Murata, Acc. Chem. Res., 2014, 47, 1681–1690 CrossRef CAS PubMed.
- E. B. Steager, M. S. Sakar, D. H. Kim, V. Kumar, G. J. Pappas and M. J. Kim, J. Micromech. Microeng., 2011, 21, 035001 CrossRef.
- P. Y. Chiou, A. T. Ohta and M. C. Wu, Nature, 2005, 436, 370–372 CrossRef CAS.
- N. L. Abbott, J. P. Folkers, G. M. Whitesides, B. Michel, H. Biebuyck, R. R. Shah and N. L. Abbott, Sci. 80, 1992, 257, 1380–1382 CrossRef CAS.
Footnote |
| † Electronic supplementary information (ESI) available. See DOI: 10.1039/d0ra00703j |
| This journal is © The Royal Society of Chemistry 2020 |

