 Open Access Article
Phonon thermal conductivity reduction in silicene nanotubes with isotope substitution†
Xiaodong Yu,
Haipeng Li * and
Jiasheng Zhou
School of Materials and Physics, China University of Mining and Technology, Xuzhou 221116, P. R. China. E-mail: haipli@cumt.edu.cn
First published on 13th March 2020
Abstract
We used molecular dynamics simulations to study the isotopic doping effects on phonon thermal conductivity in armchair silicene nanotubes (SNTs). The phonon thermal conductivity of armchair SNTs can be effectively tuned with isotope substitution. Randomly and superlattice-structured isotopic doping can significantly reduce thermal conductivity. By analyzing the phonon vibrational spectrum, we reveal the underlying physical insights into the relationship between randomly isotopic doping concentration and thermal conductivity. Given the same doping concentration, the superlattice-structured doping method can reduce thermal conductivity more significantly than the disordered doping. For the isotopic superlattice doping method, the completion between the phonon interfacial scattering and phonon tunneling may cause minimum thermal conductivity at the critical period length. This study provides a possible means to effectively reduce the thermal conductivity of thermoelectric SNTs through isotopic doping engineering.
1. Introduction
The emergence of graphene has given rise to the exploration of other two-dimensional (2D) nanomaterials. Silicene, which is the scaling of a silicon atomic sheet in a buckled honeycomb lattice similar to graphene,1 exhibits numerous superior physical properties,2–4 thereby attracting great attention in the community of 2D materials. Since its theoretical prediction,5 the growth of silicene on metal substrates has been experimentally reported.6–9 A high buckled silicene sheet was recently fabricated on a semiconducting MoS2 substrate, thereby obtaining an isolated silicene sheet while avoiding the influence of metal substrate on the electronic structure.10 Given the compatibility of silicon with silicon-based nanotechnology, this material has developed potential for the next generation of nano-electronic devices, in which thermal transport properties also play a key role. Hence, the study of thermal conductivity of silicon-based nanomaterials has received increasing attention in recent years. In addition, thermoelectric (TE) materials are a type of functional materials that can directly convert heat energy into electrical energy. The performance of TE materials is measured by the figure of merit,11 ZT = S2σT/κ, where S, σ, T, and κ are the Seebeck coefficient, electrical conductivity, absolute temperature, and thermal conductivity, respectively. So it is interesting to find an efficient mechanism for enhancing the thermoelectricity by blocking phonon transport in 2D materials. Given that free-standing silicene is difficult to obtain experimentally, no experiment has yet to be performed to measure the thermal conductivity of this material. Many theoretical studies have shown that the room-temperature thermal conductivity of free-standing silicene (approximately 20–65 W mK−1 (ref. 12–17) with various theoretical methods) is considerably lower than that of graphene (2000–5000 W mK−1 in experiment18) and bulk silicon (150–200 W mK−1 in experiment19). This result indicates that silicene nanomaterials possess immense potential in TE applications. The effects of strain, interface, defect, surface functionalization, and size on the thermal conductivity of silicene nanoribbons have attracted considerable attention in the last decade.20–23Despite extensive studies on the electronic and thermal features of silicene nanoribbons, minimal research has been devoted to date to the thermal (phonon) transport of silicene nanotubes (SNTs).24 Previous studies have shown that isotope impurities provide a powerful technique to modulate the phonon-related properties of carbon nanotubes (CNTs),25 graphene,26 and silicon nanowires.27 Isotope doping easily introduces phonon-defect scattering in nanostructures without damaging the electronic quality, thereby attracting intensive interest among researchers. Many experimental and theoretical studies have been conducted on the isotopic effects on the thermal conductivity of bulk Si and silicon nanowires. However, the influence of isotope doping, including doping concentration, doping pattern, and doping type on the thermal conductivity of SNT, remains unclear. The current study introduces 30Si to dope 28Si SNTs and investigates the effects of isotope doping on the phonon thermal conductivity of 28Si SNTs. Phonon thermal conductivity is calculated using non-equilibrium molecular dynamics (NEMD) simulations. The effects of size and isotope doping on thermal conductivity are discussed. Phonon density of states (PDOS) analysis is also conducted to explain the mechanism. Accordingly, our study can guide the isotopic doping engineering of the TE properties of SNTs.
2. Computational methods
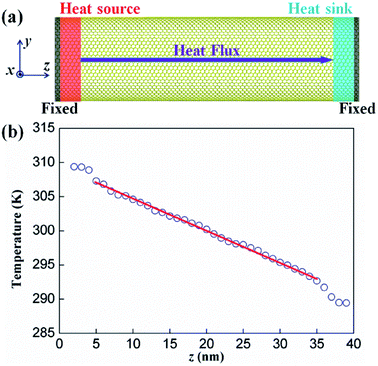
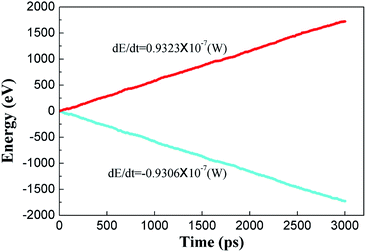
In semiconductors, such as silicene, phonons contribute the most to thermal conductivity at room temperature. On the basis of the LAMMPS software package,28 we used the classic NEMD method to simulate phonon transport in SNTs placed within a simulation box. In this method (see Fig. 1a), a temperature gradient across the system is built in the heat flux direction by using two heat reservoirs at the two ends of the system at different temperatures. Thereafter, the resultant heat flux running through the system in the non-equilibrium steady state is calculated. This approach is analogous to real experimental measurement and is also known as the direction method. The NEMD simulation is often performed with sufficient time to allow the system to reach a non-equilibrium steady state. That is, the temperature gradient is well established and the heat flux going through the system is time independent.In the molecular dynamics (MD) simulation, Newton's equations of motion are integrated by using the velocity verlet algorithm. A time step of 1 fs was considered for the integration of the atomic equations of motion. Tersoff potential29 was used to describe the Si–Si bonding interaction in the simulation systems, and successfully utilized in the simulation of the structural and phonon properties of SNT.16,24 The structural optimization was performed using the Polak–Ribière version of the conjugated gradient algorithm. Fig. S1 (ESI†) shows the radial distribution function of optimized SNT. We found that the average nearest-neighbor distance is about 0.229 nm, which is close to the nearest-neighbor distance of 0.228 nm in silicene.17 Then the simulation is carried out according to the standard process described in the literature.24,30,31 Initially, 1 ns Nose–Hoover thermo bath coupling32 (coupling constant 0.1 ps) with a background temperature of 300 K were conducted to achieve equilibrated structures. After the equilibrium state was achieved, the microcanonical ensemble is adopted and NEMD simulations are performed to investigate the thermal transport behavior. Along the direction of heat flow, the simulation system is divided into N slabs, in which two slabs on the left and right ends are fixed to prevent the rotation of the system during the simulation time. Adjacent to these fix regions are hot and cold slabs. These slabs are coupled with the Nose–Hoover thermostat employing the canonical ensemble for 4 ns at T + ΔT/2 (310 K) and T − ΔT/2 (290 K), respectively, where T is the mean temperature of the nanotube and ΔT is the temperature difference between the hot and the cold segments of the system. Furthermore, the microcanonical ensemble is applied to integrate the equation of motion of atoms in all the other slabs.
After the system finds the steady-state condition, the temperature of each slab is obtained using the energy equalization theorem,
 | (1) |
For the one-dimensional nanotube, thermal conductivity is calculated according to Fourier's law of heat conduction in the z-direction:
 | (2) |
PDOS can reflect the change of the internal vibration mode of a system under the influence of external factors. PDOS can be obtained through the Fourier transform of velocity autocorrelation function in the MD simulations,33
 | (3) |
3. Results and discussion
Fig. 3a shows the effect of sample length (L) on the calculated phonon thermal conductivity (κ) in SNTs. We observed the considerable sensitivity of the nanotube length thermal conductivity caused by phonon scattering. κ values monotonically increase with the system length. For example, when the length of SNT was increased from 30 nm to 120 nm, the calculated κ increased to approximately 1.6 times that of the original short SNT (i.e., 19.95 ± 0.49 W mK−1 for L = 30 nm). Given an increasing simulation-domain length, additional long-wavelength modes are included. Thus, the calculated κ increases and approximates its true value. However, it is computationally prohibitive for many materials in practice to obtain sample size-independent κ predictions using the direct NEMD simulation. To predict the κ value of an infinite length SNT (κ∞), a linear-fitting approach is usually applied to the finite κ results based on,34
 | (4) |
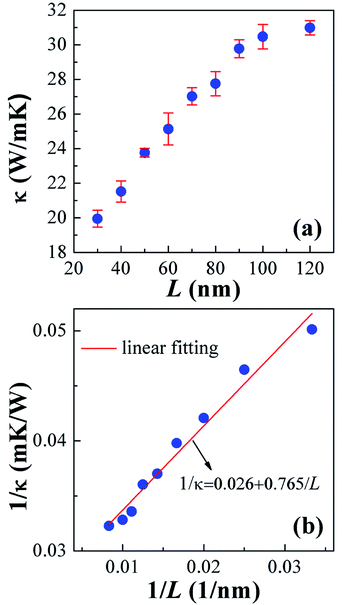 | ||
| Fig. 3 (a) Phonon thermal conductivity (κ) of 8 nm-diameter armchair SNTs with varying lengths (L) of 30–120 nm, (b) relationship of the reciprocals of length and phonon thermal conductivity. | ||
At room temperature, the phonon thermal conductivity may be attributed to both acoustic and optical phonons.17 When the size goes down to the nanoscale, the boundary scattering plays an important role in the phonon transport. The length-dependent thermal conductivities may be understood by the length-dependent PDOS. For instance, when the length of SNT decreases from 120 nm to 30 nm, phonons with long MFPs will be strongly scattered by the boundary, leading to the suppression of acoustic and optical phonon modes, as shown in Fig. S2 (ESI).† So the contribution of these phonons to κ will be limited. We also calculated the phonon thermal conductivity of armchair SNTs with the same length of 40 nm and diameter in the range of 6–14 nm, and the results are shown in Fig. 4. It is found that changing the diameter has little effect on the thermal conductivity of SNTs, which is in good agreement with the previous study.24
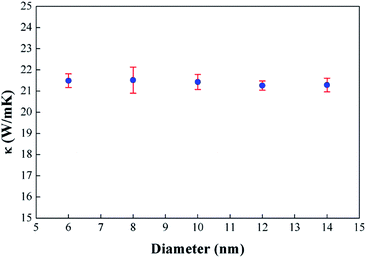 | ||
| Fig. 4 Effect of diameter on the phonon thermal conductivity of armchair SNTs with the same length of 40 nm at T = 300 K. | ||
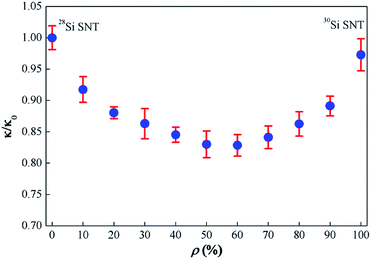
Fig. 5 shows the calculated phonon thermal conductivity of the randomly doped SNT with the different percentage of doped 30Si. The phonon thermal conductivity of the studied SNTs decreases initially to a minimum and increases thereafter as the doping concentration (ρ) changes from 0% to 100%. At low isotopic percentage, the small ratio of impurity atoms can induce large reduction on conductivity. For example, the thermal conductivity is decreased by about 27% at ρ = 50% compared to the case of ρ = 0. The calculated thermal conductivity of pure 30Si SNT (ρ = 100%) is found to be approximately 3% smaller than that of pure 28Si SNT (ρ = 0, κ0 = 21.5 ± 0.4 W mK−1) because 30Si atoms have large mass, thereby giving low phonon frequency. This U-shaped change of thermal conductivity is also found in isotope-doped graphene,25,36 CNT,37 and silicon nanowires.26,38 The isotopic-doping-induced reduction of thermal conductivity is due to a point defect induced by a mass difference in a crystal lattice that causes phonon scattering; this finding is controlled by the masses and concentrations of the individual isotopes that contribute to the disorder.39
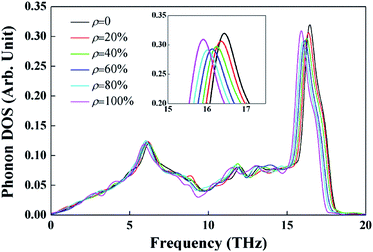
PDOS is calculated to understand the mechanism of the thermal conductivity reduction induced by random isotopic doping. We examined the phonon spectra for ρ = 0, 20%, 40%, 60%, 80% and 100% (see Fig. 6). It is observed that the highest frequency of the phonon modes decreases with increasing ρ from 0 to 100%, indicating the softening of the system. In addition, when ρ increases from 0 to 40% or decreases from 100% to 60%, the mass disorder increases, thereby lowering the intensity of the optical phonon mode (near 16.5 THz). Similar results are also found in isotope doped CNT37 and silicene nanoribbon.16,39 Hence, isotope substitution induces mass disorder in the lattice, thereby resulting in increased phonon scattering at defective sites because of the difference in the characteristic frequencies of phonons. These impurities cause the local localization of phonon modes, thereby reducing thermal conductivity.
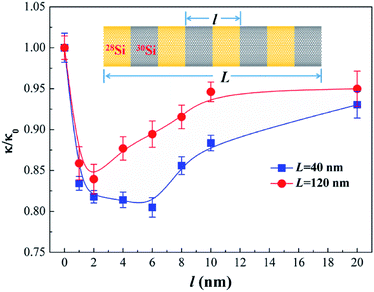
In nanostructures, the surface and interface also play key roles in the physical properties, including phonon transport.40 Superlattice structures provide an efficient means to obtain ultralow thermal conductivity owing to the strong phonon-interface scattering.16 Among various superlattice structures, the isotopic-superlattice (IS) is a particularly good structure to reduce the thermal conductivity without destroying the stability.27 We study the phonon transport in SNT superlattice, which consists of alternating 28Si/30Si layers along the longitudinal direction. Fig. 7 shows the phonon thermal conductivity of the IS-structured SNTs (L = 40 nm and 120 nm, respectively) as a function of the superlattice period length l for doping concentration ρ = 50% (i.e., 28Si0.5/30Si0.5–SNT superlattice). As l decreases from 20 nm to about 6 nm (2 nm) for L = 40 nm (L = 120 nm) SNT, the phonon thermal conductivity decreases remarkably. Evidently, increasing the number of interface for fixed length (L = 40 nm or 120 nm) will enhance the phonon-interface scattering, thereby resulting in the reduction of phonon thermal conductivity. However, an increase in phonon thermal conductivity is found as the value of l decreases further. This anomalous increase in phonon thermal conductivity at short superlattice period length can be understood qualitatively from the wave characteristics of phonons. When period length decreases to below the critical period length, particularly smaller than the dominant phonon wavelength, phonon tunneling contributes to phonon transmission,41 thereby resulting in the increase of phonon thermal conductivity. Thus the completion between the interfacial scattering and phonon tunneling may cause minimum thermal conductivity at the critical period length. These behaviors have also been found in other superlattice systems.25,27,41 From Fig. 5 and 7, we also found that, at the same 30Si doping concentration of 50%, superlattice-structured doping (for l = 6 nm in L = 40 nm SNT) can reduce thermal conductivity more largely than randomly doping does.
4. Conclusions
In conclusion, phonon thermal transport in armchair SNTs was investigated by using NEMD simulations. Our theoretical study found that the phonon thermal conductivity of SNT is approximately one order of magnitude lower than that of bulk silicon crystal, thereby showing good potential in TE applications. Moreover, we obtained thermal conductivity reduction in SNTs with two types of isotopic doping. Evidently, the introduction of heavy isotope substitution can better reduce thermal conductivity compared with the light isotope atoms. Randomly and superlattice-structured isotopic doping can significantly reduce thermal conductivity. At the same doping concentration, superlattice-structured doping method can particularly reduce thermal conductivity better than disordered doping. As the superlattice period length of 28Si0.5/30Si0.5–SNT decreases, thermal conductivity decreases initially but increases anomalously when the superlattice period length is below a critical value. The reason is that the completion between the phonon interfacial scattering and phonon tunneling may cause minimum thermal conductivity at the critical period length. The remarkable isotopic effect observed in this research provides an efficient approach to decrease phonon thermal conductivity without affecting electronic transport. This study guides the isotopic doping engineering of the thermal transport properties in silicene materials, and has crucial implications for SNT application in nanoscale thermoelectric materials.Conflicts of interest
There are no conflicts to declare.Acknowledgements
The work is supported by the Fundamental Research Funds for the Central Universities of China (Grant No. 2019ZDPY16) and the Postgraduate Research & Practice Program of Education & Teaching Reform of CUMT. We are also grateful to the Advanced Analysis and Computation Center of CUMT for the award of CPU hours to accomplish this work.Notes and references
- J. J. Zhao, H. S. Liu, Z. M. Yu, R. G. Quhe, S. Zhou, Y. Y. Wang, C. C. Liu, H. X. Zhong, N. N. Han, J. Lu, Y. G. Yao and K. H. Wu, Prog. Mater. Sci., 2016, 83, 124–151 CrossRef.
- N. D. Drummond, V. Zolyomi and V. I. Fal'ko, Phys. Rev. B: Condens. Matter Mater. Phys., 2012, 85, 075423 CrossRef.
- Y. Qian, H. P. Wu, E. J. Kan, R. F. Lu and K. M. Deng, J. Appl. Phys., 2016, 120, 234303 CrossRef.
- C. C. Liu, W. X. Feng and Y. G. Yao, Phys. Rev. Lett., 2011, 107, 076802 CrossRef PubMed.
- K. Takeda and K. Shiraishi, Phys. Rev. B: Condens. Matter Mater. Phys., 1994, 50, 14916–14922 CrossRef CAS PubMed.
- B. J. Feng, Z. J. Ding, S. Meng, Y. G. Yao, X. Y. He, P. Cheng, L. Chen and K. H. Wu, Nano Lett., 2012, 12, 3507–3511 CrossRef CAS PubMed.
- P. Vogt, P. De Padova, C. Quaresima, J. Avila, E. Frantzeskakis, M. C. Asensio, A. Resta, B. Ealet and G. Le Lay, Phys. Rev. Lett., 2012, 108, 155501 CrossRef PubMed.
- A. Stepniak-Dybala and M. Krawiec, J. Phys. Chem. C, 2019, 123, 17019–17025 CrossRef CAS.
- L. Meng, Y. L. Wang, L. Z. Zhang, S. X. Du, R. T. Wu, L. F. Li, Y. Zhang, H. T. Li, G. Zhou, W. A. Hofer and H. J. Gao, Nano Lett., 2013, 13, 685–690 CrossRef CAS PubMed.
- D. Chiappe, E. Scalise, E. Cinquanta, C. Grazianetti, B. Van Den Broek, M. Fanciulli, M. Houssa and A. Molle, Adv. Mater., 2014, 26, 2096–2101 CrossRef CAS PubMed.
- M. Zebarjadi, K. Esfarjani, M. S. Dresselhaus, Z. F. Ren and G. Chen, Energy Environ. Sci., 2012, 5, 5147–5162 RSC.
- H. P. Li and R. Q. Zhang, Europhys. Lett., 2012, 99, 36001 CrossRef.
- H. Xie, M. Hu and H. Bao, Appl. Phys. Lett., 2014, 104, 131906 CrossRef.
- Q. X. Pei, Y. W. Zhang, Z. D. Sha and V. B. Shenoy, J. Appl. Phys., 2013, 114, 033526 CrossRef.
- T. Y. Ng, J. J. Yeo and Z. S. Liu, Int. J. Mech. Mater. Des., 2013, 9, 105–114 CrossRef CAS.
- B. Liu, C. D. Reddy, J. W. Jiang, H. W. Zhu, J. A. Baimova, S. V. Dmitriev and K. Zhou, J. Phys. D: Appl. Phys., 2014, 47, 165301 CrossRef.
- B. Peng, H. Zhang, H. Shao, Y. Xu, G. Ni, R. Zhang and H. Zhu, Phys. Rev. B, 2016, 94, 245420 CrossRef.
- A. A. Balandin, S. Ghosh, W. Z. Bao, I. Calizo, D. Teweldebrhan, F. Miao and C. N. Lau, Nano Lett., 2008, 8, 902–907 CrossRef CAS PubMed.
- R. K. Kremer, K. Graf, M. Cardona, G. G. Devyatykh, A. V. Gusev, A. M. Gibin, A. V. Inyushkin, A. N. Taldenkov and H. J. Pohl, Solid State Commun., 2004, 131, 499–503 CrossRef CAS.
- J. C. Zhang, Y. Hong, Z. Tong, Z. H. Xiao, H. Bao and Y. A. Yue, Phys. Chem. Chem. Phys., 2015, 17, 23704–23710 RSC.
- H. Sadeghi, S. Sangtarash and C. J. Lambert, Sci. Rep., 2015, 5, 9514 CrossRef CAS PubMed.
- Z. Y. Liu, X. F. Wu and T. F. Luo, 2D Mater., 2017, 4, 025002 CrossRef.
- B. Liu, J. A. Baimova, C. D. Reddy, A. W.-K. Law, S. V. Dmitriev, H. Wu and K. Zhou, ACS Appl. Mater. Interfaces, 2014, 6, 18180–18188 CrossRef CAS PubMed.
- M. Khalkhali, F. Khoeini and A. Rajabpour, Int. J. Heat Mass Transfer, 2019, 134, 503–510 CrossRef CAS.
- J. Shiomi and S. Maruyama, Phys. Rev. B: Condens. Matter Mater. Phys., 2006, 74, 155401 CrossRef.
- J. N. Hu, S. Schiffli, A. Vallabhaneni, X. L. Ruan and Y. P. Chen, Appl. Phys. Lett., 2010, 97, 133107 CrossRef.
- N. Yang, G. Zhang and B. Li, Nano Lett., 2008, 8, 276–280 CrossRef CAS PubMed.
- S. Plimpton, J. Comput. Phys., 1995, 117, 1–19 CrossRef CAS.
- J. Tersoff, Phys. Rev. B: Condens. Matter Mater. Phys., 1989, 39, 5566–5568 CrossRef PubMed.
- B. Liu, J. A. Baimova, C. D. Reddy, S. V. Dmitriev, W. K. Law, X. Q. Feng and K. Zhou, Carbon, 2014, 79, 236–244 CrossRef CAS.
- N. Wei, L. Xu, H. Q. Wang and J. C. Zheng, Nanotechnology, 2011, 22, 105705 CrossRef PubMed.
- S. Nosé, J. Chem. Phys., 1984, 81, 511–519 CrossRef.
- J. M Dickey and A. Paskin, Phys. Rev., 1969, 188, 1407–1418 CrossRef.
- Y. Hong, M. G. Ju, J. Zhang and X. C. Zeng, Nanoscale, 2015, 7, 6014–6022 RSC.
- X. Zhang, H. Bao and M. Hu, Nanoscale, 2015, 7, 6014–6022 RSC.
- S. Srinivasan, U. Ray and G. Balasubramanian, Chem. Phys. Lett., 2016, 650, 88–93 CrossRef CAS.
- G. Balasubramanian, I. K. Puri, M. C. Bohm and F. Leroy, Nanoscale, 2011, 3, 3714–3720 RSC.
- G. Zhang and Y. W. Zhang, Phys. Status Solidi RRL, 2013, 7, 754–766 CrossRef CAS.
- R. F. Xu, K. Han and H. P. Li, Chin. Phys. B, 2018, 27, 026801 CrossRef.
- H. P. Li and R. Q. Zhang, Chin. Phys. B, 2018, 27, 036801 CrossRef.
- Z. Xie, X. Chen, X. Yu, Y. Zhang, H. Wang and L. Zhang, Sci. China: Phys., Mech. Astron., 2017, 60, 107821 Search PubMed.
Footnote |
| † Electronic supplementary information (ESI) available. See DOI: 10.1039/d0ra00834f |
| This journal is © The Royal Society of Chemistry 2020 |

