 Open Access Article
A novel universal nano-luciferase-involved reporter system for long-term probing food-borne probiotics and pathogenic bacteria in mice by in situ bioluminescence imaging†
Ning Zhao‡
,
Jing-Min Liu‡ ,
Shuang Liu,
Xue-Meng Ji,
Huan Lv,
Yao-Zhong Hu,
Zhi-Hao Wang,
Shi-Wen Lv
 ,
Chun-Yang Li and
Shuo Wang*
Tianjin Key Laboratory of Food Science and Health, School of Medicine, Nankai University, Tianjin 300071, China. E-mail: wangshuo@nankai.edu.cn
First published on 31st March 2020
Abstract
Food-borne bacteria have received increasing attention due to their great impact on human health. Bioimaging makes it possible to monitor bacteria inside the living body in real time and in situ. Nano-luciferase (NLuc) as a new member of the luciferase family exhibits superior properties than the commonly used luciferases, including small size, high stability and improved luminescence. Herein, NLuc, CBRLuc and FLuc were well expressed in varied food-borne bacteria. Results showed that the signal intensity of E. coli-NLuc was about 41 times higher than E. coli-CBRLuc, L. plantarum-NLuc was nearly 227 times that of L. plantarum-FLuc in vitro. Moreover, NLuc was applied to trace L. plantarum and E. coli in vivo through the whole body and separated digestive tract imaging, as well as the feces bacterium counting and probing. The persistence of bioluminescent strains was predominantly localized in colon and cecum of mice after oral administration. The NLuc system showed its incomparable superiority, especially in the application of intestinal imaging and the universality for food-borne bacteria. We demonstrated that the NLuc system was a brilliant alternative for specific application of food-borne bacteria in vivo, aiming to collect more accurate and real-time information of food-borne bacteria from the living body for further investigation of their damage mechanism and nutrition effect.
1. Introduction
As the most important contributor to the personal composition of gut microbiota, food-borne bacteria can be categorized as food-borne probiotics and pathogens, which are involved in the internal reaction to the gut microenvironment. Certain probiotics and food-borne pathogens have been demonstrated to influence human health via different mechanisms, such as changing the gastrointestinal environment or altering the immune reaction.1–4 Conventionally, mice models have been utilized for in vivo analysis of food-borne bacteria in the gastrointestinal tract through sequencing of feces bacteria or counting after sacrifice. However, traditional strategies cannot show the specific location of the target bacteria in the intestinal tract and the authentic situation of target bacteria in the intestinal tract cannot be reflected, which provides an urgent necessity of the novel technique to monitor the real-time situation of target bacteria in the gastrointestinal tract.5,6Though different strategies can be applied for real-time visualization of food-borne bacteria in living body, imaging techniques exhibit advantages for the straightforward and sensitive detection. With the rapid development of interdisciplinary and multiple technologies in parallel, a set of imaging techniques have been established to facilitate the noninvasive visualization of biological features in vivo, such as bioluminescence, traditional fluorescence (fluorescent protein and fluorescent dye) and nanomaterials fluorescence.7–9 However, as the most commonly used labeling method, fluorescent protein has many disadvantages, such as low signal-to-noise ratio, sample heating and light source drift, which cannot fulfill the continuously increased requirement of sensitive detection.10–13 As a newly developed technology, nano-imaging based on nanomaterials has been applied for real-time tracing of food-borne bacteria in vivo. In our previous studies,14 nano-imaging had been well applied to trace probiotics in living mice by modifying the bacteria with persistent luminescence nanoparticles (PLNPs). However, nanomaterials labeling could not be utilized to monitor the growth of target bacteria in vivo and the stability of certain labeling methods is poor.6,15–17 Therefore, better imaging technologies need to be developed.
Bioluminescence is an optimal choice for real-time tracing bacteria through luciferase labeling and consequent detecting of the signal produced by luciferase-catalyzed reaction. Compared with imaging technologies mentioned above, the strategy of luciferase labeled bacteria can be used to monitor the viability and distribution of target bacteria in real time and in situ with higher signal-to-noise ratio. There are many enzymes in luciferases family, firefly luciferase from Photinus pyralis (FLuc, 61 kDa) and click beetle luciferase from Pyrophorus plagiophthalamus (CBRLuc, 64 kDa) are the typical luciferases. The reaction of FLuc and CBRLuc depend on ATP, magnesium and molecular oxygen and as a result of yellow-green light and green-orange light, respectively.18–22 However, some properties of molecule size, luminescence efficiency and stability in previously-used luciferases often limit their application. Nano-luciferase (NLuc) as a new member of luciferase family exhibits superior properties to the commonly used luciferases (FLuc and CBRLuc), including small size, high stability and improved luminescence. The very recent developed nano-luciferase is engineered from deep-sea shrimp Oplophorus gracilirostris with the size of 19 kDa and the property of the smallest size favor to study the characteristics of target compounds. When NLuc paired with a synthetic furimazine substrate, it emits extremely bright luminescence over 150-fold higher than FLuc and the reaction is ATP-independent. The small size, high stability, increased sensitivity and high signal-to-noise ratio of NLuc system have been widely used in mammalian cells, but not well applied in bacteria, especially in vivo imaging.23–28
In the present study, NLuc system was applied for the visualization of food-borne bacteria in the living body through the transformation of luciferase encoded genes to L. plantarum ATCC8014 and E. coli O157:H7 ATCC35150. It was proved the ultra-brightness, stability and better penetrating ability of NLuc through the comparison with FLuc and CBRLuc in vitro. Besides, NLuc constructs were structurally very stable in Lactobacillus casei, Lactobacillus reuteri and Cronobacter sakazakii, demonstrating the universality of NLuc system in food-borne bacteria. Moreover, the transit and persistence of L. plantarum-NLuc and E. coli-NLuc in the living body of mice were also confirmed after a single or multiple administrations through whole body and the separated digestive tracts imaging, as well as the feces bacterium counting and probing (Fig. 1). It was demonstrated that NLuc with small size, high stability, increased sensitivity and high signal-to-noise ratio was an outstanding alternative for researchers. The proposed method here could be widely used in food borne-bacteria and track the precise localization of food-borne bacteria in the gastrointestinal tract sensitively, which could benefit the sensitive and real-time detection of food-borne bacteria in the living body for further investigation of their nocuous effect and association with nutrient metabolism.
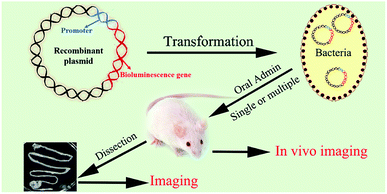 | ||
| Fig. 1 Schematic illustration of the preparation of bioluminescent bacteria and the experimental design of tracing of the foodborne bacteria in vivo. | ||
2. Experimental section
2.1 Strains, plasmids and culture conditions
E. coli O157:H7 ATCC35150 and C. sakazakii BAA894 were cultured in Luria–Bertani (LB) broth at 37 °C with vigorous shaking (200 rpm). L. plantarum ATCC8014, L. casei Zhang and L. reuteri ATCC23272 were cultured in De Man, Rogosa, and Sharpe (MRS) broth at 37 °C without shaking (Table 1). 200 µg mL−1 ampicillin (Sigma-Aldrich Co., St. Louis, MO, USA) was used for antibiotic selection of recombinant E. coli and C. sakazakii. 10 µg mL−1 chloramphenicol was used for L. plantarum, L. casei and L. reuteri.| Strain or plasmid | Description | Reference |
|---|---|---|
| Strains | ||
| E. coli MC1061 | Cloning host | Invitrogen |
| E. coli Top10 | Cloning host | Invitrogen |
| L. plantarum ATCC8014 | International reference strain | American type culture collection |
| L. reuteri ATCC23272 | International reference strain | American type culture collection |
| L. casei Zhang | Isolated from homemade koumiss | 29 |
| E. coli O157:H7 ATCC35150 | International reference strain | American type culture collection |
| C. sakazakii BAA894 | International reference strain | 30 |
![[thin space (1/6-em)]](https://www.rsc.org/images/entities/char_2009.gif) |
||
| Plasmids | ||
| pNZ8148 | Lactobacillus expression vector Cmr | 31 |
| pUC57 | Cloning vector, Apr | 32 |
| pNZNLuc1 | pNZ8148 carrying NLuc cDNA optimized for L. plantarum codon fused to the Pldh promoter | This study |
| pNZFLuc2 | pNZ8148 carrying FLuc cDNA optimized for L. plantarum codon fused to the Pldh promoter | This study |
| pNZCBRLuc8 | pNZ8148 carrying CBRLuc cDNA optimized for L. plantarum codon fused to the Pldh promoter | This study |
| pUCNLuc10 | pUC57 carrying NLuc cDNA optimized for E. coli codon fused to the PtatA promoter | This study |
| pUCCBRLuc16 | pUC57 carrying CBRLuc cDNA optimized for E. coli codon fused to the PtatA promoter | This study |
| pUCFLuc20 | pUC57 carrying FLuc cDNA optimized for E. coli codon fused to the PtatA promoter | This study |
NLuc, FLuc and CBRLuc were codon-optimized based on the codon preference of L. plantarum and synthesized by BGI-Beijing, Beijing, China. The synthesized target gene were then fused into pNZ8148 as BglII-PstI fragments under the constructive promoter Pldh. NLuc, FLuc and CBRLuc were also codon-optimized based on the codon preference of E. coli and cloned into pUC57 as NdeI-BamHI fragments under the control of PtatA. The codon-optimized nucleotide sequences of E. coli-NLuc, E. coli-FLuc, E. coli-CBRLuc, L. plantarum-NLuc, L. plantarum-FLuc and L. plantarum-CBRLuc were submitted to GenBank under assigned accession numbers MN834152, MN834154, MN834153, MN834155, MN834156, MN834157, respectively. The recombinant plasmids were then introduced into L. plantarum by electroporation![[thin space (1/6-em)]](https://www.rsc.org/images/entities/char_2009.gif) transformation (1 mm cuvettes, 1.3 kV, 25 µF and 200 Ω) or E. coli by heat shock referring to the previous studies and named Lp-NLuc, Lp-FLuc, Lp-CBRLuc, or E. coli-NLuc, E. coli-FLuc, E. coli-CBRLuc, respectively.33,34 The control group was transformed
transformation (1 mm cuvettes, 1.3 kV, 25 µF and 200 Ω) or E. coli by heat shock referring to the previous studies and named Lp-NLuc, Lp-FLuc, Lp-CBRLuc, or E. coli-NLuc, E. coli-FLuc, E. coli-CBRLuc, respectively.33,34 The control group was transformed![[thin space (1/6-em)]](https://www.rsc.org/images/entities/char_2009.gif) with empty vector pNZ8148 or pUC57. The same protocol was applied for the preparations of Lactobacillus casei-NLuc (Lc-NLuc), Lactobacillus reuteri-NLuc (Lr-NLuc) and Cronobacter sakazakii (Cs-NLuc).
with empty vector pNZ8148 or pUC57. The same protocol was applied for the preparations of Lactobacillus casei-NLuc (Lc-NLuc), Lactobacillus reuteri-NLuc (Lr-NLuc) and Cronobacter sakazakii (Cs-NLuc).
2.2 In vitro bioluminescence assay
Recombinant bacteria preculture were grown overnight in MRS or LB broth at 37 °C. Subsequently, the expansion was prepared from the preculture to grow to a specified optical density (OD600) of 2.0. Then, 50 µL of cultures was transferred to black 96-well plates to mix with 50 µL of D-luciferin (PerkinElmer) with the final concentration of 150 µg mL−1, which works as the substrate of FLuc and CBRLuc. Furimazine (1/200 dilution of Nano-Glo® Luciferase substrate, 100 µL gavage volume Promega) was the substrate of NLuc. Bioluminescence signals were recorded by plate reader (Spark Tecan, Switzerland), and bioluminescence emission spectra from bacterial strains were obtained in the 400–650 nm wavelength range.2.3 Plasmids stability in vitro
The stability of different plasmids in recombinant strains were tested via subculture in corresponding medium without antibiotics within 10 days (MRS or LB broth). The bacterial suspension was then serially diluted and plated onto antibiotic-free plates, 100 colonies of E. coli-NLuc and L. plantarum-NLuc were then cultured in selective medium for counting and bioluminescence test.2.4 Preparing bacteria for in vivo experiments
Each culture was activated twice before use, bacterial strains were cultured to stationary phase, harvested by centrifugation (10 min at 8000 × g), washed twice with sterile PBS, suspended in gavage buffer (0.2 M NaHCO3 buffer containing 1% glucose). Mice received 3 × 10¹⁰ CFU bacterial strains in 200 µL gavage buffer.2.5 Biodistribution study of E. coli and L. plantarum in the gastrointestinal tract of mice after a single oral administration
Eight-week-old female BALB/C mice were purchased from SPF (Biotechnology Co., Ltd, Beijing), weighing 18–20 g. Mice were kept in a controlled conditions with temperature 22–25 °C and a 12/12 light cycle and adapted to the environment with free access to water and food for at least one week before the experiments. Firstly, mice were divided into 7 groups (control, E. coli-NLuc, E. coli-FLuc, E. coli-CBRLuc, Lp-NLuc, Lp-FLuc, Lp-CBRLuc) to compare the bioluminescence intensity in the whole body of mice. Each group of mice were administered with different bacterial strains 3 × 10¹⁰ CFU by intragastric gavage. Control mice received recombinant strains containing empty vector. Then the mice were sacrificed by cervical dislocation and the gastrointestinal tracts (from stomach to colon) were separated to compare the signals of living mice whole-body and the intestinal signals after 0 min, 5 min and 10 min of dissection. Finally, three mice were sacrificed by cervical dislocation at 15 min, 60 min, 120 min and 240 min after the administration of bacteria to study the biodistribution of E. coli and L. plantarum in the gastrointestinal tract.2.6 Persistence of E. coli-Nluc and L. plantarum-Nluc after multiple oral administrations
To detect the persistence of E. coli-Nluc and L. plantarum-Nluc in mice, mice were taken E. coli-NLuc and L. plantarum-NLuc from day 1 to day 5 and the bioluminescence signals were acquired at the same time from day 1 to day 7 as described above. Three mice were dissected were sacrificed by cervical dislocation at day 6 and day 7, and the gastrointestinal tracts (from stomach to colon) were separated to study the persistence of E. coli-Nluc and L. plantarum-Nluc in the intestines.2.7 Real-time monitoring the bioluminescent strains in feces
The feces of mice with a single or multiple oral administration were collected at different time points, whereas, the feces of mice with multiple oral administration were daily collected at the fixed time every day. The feces were homogenized in MRS or LB medium to 100 mg of feces per mL, and then dilutions were plated on the corresponding resistance agar plates.2.8 Whole body imaging acquisition
All the animal-related procedures were performed strictly according to the guideline of Tianjin Committee of Use and Care of Laboratory Animals, and experimental protocols were approved by the Animal Ethics Committee of Nankai University. All animals were anesthetized with an intraperitoneal injection of pentobarbital sodium (40 mg kg−1) before imaging. Animals received substrates and bacteria by gastric inoculation before imaging, furimazine (1/20 dilution of Nano-Glo® Luciferase substrate, 200 µL gavage volume, Promega) is the substrate for NLuc system and D-luciferin (150 mg kg−1, PerkinElmer) is for FLuc and CBRLuc systems.35,36 Bioluminescence images were acquired at room temperature on a Berthold NightOWL LB 983 Imaging System (Berthold Technologies, Bad Wildbad, Germany). The images were acquired with open filter and exposure time ranges from 1 to 3 min according to the signal intensity, the luminescence counts acquired under different exposure time were all normalized as the average value (total counts/exposure time) to ensure the reasonable comparison, and the pseudo colour images represented the light intensity (from red for most intense to blue for least intense). All bioluminescent mice had a region of interest (ROI), corresponding to the location of bioluminescent strain, which is manually determined.3. Results and discussion
3.1 In vitro bioluminescence properties of recombinant bacteria
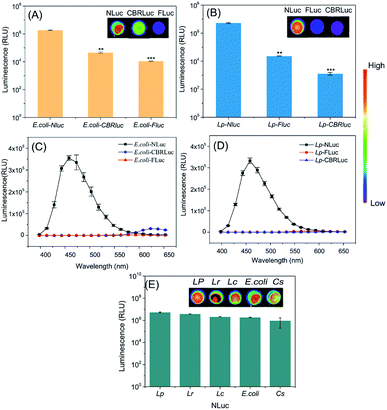
Promoters and plasmids are important factors in the stable expression of reporter genes, the constitutive promoters of Pldh and PtatA were fused to the high-copy number plasmids pNZ8148 and pUC57, respectively, which showed high NLuc gene expression in the bacteria mentioned above. The characteristics of bioluminescent bacteria were fully evaluated in vitro prior to in vivo imaging evaluation.Firstly, the bioluminescence intensity of different recombinant bacteria in vitro was compared. The background mean value of bioluminescent strains containing empty vector was 626 relative light units (RLU). Results in Fig. 2A and B showed that the luminescence signals produced by E. coli-NLuc and L. plantarum-NLuc were significantly higher than other recombinant bacteria. The signal intensity of E. coli-NLuc was about 41 times higher than E. coli-CBRLuc, L. plantarum-NLuc was nearly 227 times that of L. plantarum-FLuc. The lowest signal was obtained from E. coli-FLuc and L. plantarum-CBRLuc and the signal mean value of L. plantarum-CBRLuc was almost close to the background. The detection limits of bacterial quantities in the present work are as low as 3 × 10⁴ CFU mL−1 for L. plantarum-NLuc and 1 × 10⁵ CFU mL−1 for E. coli-NLuc, respectively, which are more sensitive than those of FLuc and CBRLuc-based systems. Altogether, the ultra-brightness of NLuc system for bio-application was proved through comparison with FLuc and CBRLuc in vitro.
The stability of plasmids in E. coli-NLuc and L. plantarum-NLuc were tested via subculture within 10 days for counting and bioluminescence, plasmids pNZNLuc1 and pUCNLuc10 were confirmed to be stable with 100% bioluminescent colonies after 10 days subculture.
The difference of growth behavior between E. coli-NLuc, L. plantarum-NLuc and wild types (WT) was evaluated by determining the optical density at 600 nm at certain time points. It was revealed that the growth rates of E. coli and L. plantarum were not affected by the production of nano-luciferase (ESI Fig. S1†), which was consistent with previously-reported results.36
The short wavelength of luciferase system may limit its application in vivo, due to the weak ability to penetrate host tissues compared with long emission systems.37 The emission maximum of NLuc was 460 nm, which was shorter than FLuc (560 nm) and CBRLuc (613 nm).38 However, the luminescence intensity of bacteria expressing NLuc kept higher for wavelength above 500 nm. The bioluminescence signal of E. coli-NLuc was 2 times higher than E. coli-CBRLuc at 580 nm, L. plantarum-NLuc was almost 3 times higher than L. plantarum-FLuc at 580 nm. Therefore, NLuc expressed in E. coli and L. plantarum had a better penetrating ability in vivo and could be used as a good bioluminescent tool to trace E. coli and L. plantarum in vivo (Fig. 2C and D).
In order to quantify the bacteria counts accurately by the bioluminescence, the correlation between bacterial density and bioluminescence were also measured. The results showed a positive correlation between the bioluminescence and colony-forming unit (CFU) of E. coli-NLuc (R2 = 0.99) and L. plantarum-NLuc (R2 = 0.97) (ESI Fig. S2†). Therefore, the exact bacterial numbers during growth could be successfully quantified based on the bioluminescence.
The constructs of traditional luciferase are often unstable or the luciferase expression is very low in some food-borne bacteria due to the big molecule size or other reasons, which may halt the application of luciferase. For example, the expression of CBRluc in L. plantarum was very low and the signal mean value of L. plantarum-CBRLuc was almost close to the background (Fig. 2B). To determine the universality of NLuc, it was also expressed in L. casei, L. reuteri and C. sakazakii, which was very stable in the bacteria mentioned above and produced strong luminescence signals (Fig. 2E).
3.2 Biodistribution study of E. coli and L. plantarum in mice after a single oral administration
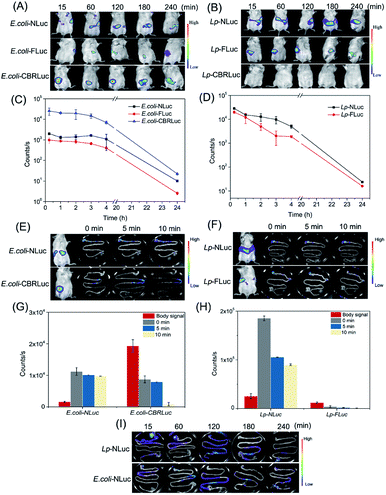
Then NLuc system was explored if the bioluminescence signal was strong enough to be detected in vivo and compared the bioluminescence signal with CBRLuc and FLuc in E. coli and L. plantarum. E. coli-NLuc and L. plantarum-NLuc did not produce the substrate, and the substrate needed to be added exogenously. Prior to trace the target bacteria in vivo, the appropriate administered approaches for furimazine needed to be determined. Three ways of intraperitoneal injection, intravenous injection and intragastric administration were compared in our study. Oral administration of furimazine before imaging resulted in a stronger signal in mice. Therefore, intragastric injection was applied in the subsequent experiments.39 D-Luciferin was administrated to animals by intragastric inoculation as described previous study.36We proceeded to compare the bioluminescence signals in vivo and the signals were recorded at 0.25, 1, 2, 3, 4 and 24 h after a single oral administration. No significant bioluminescence signal was detected before oral administration (the background signal was about 10 counts per seconds). As shown in Fig. 3A and B, NLuc-based bioluminescence imaging could be well applied both for in vivo tracing E. coli and L. plantarum, with remarkable luminescence signal observed and kept high level in vivo. Although CBRLuc gave higher signal for in vivo imaging of E. coli than NLuc, almost 10 times higher than NLuc (possibly due to the longer emission wavelength of CBRLuc), CBRLuc failed in imaging of L. plantarum with its luminescence hardly detected in vivo, indicating its unsuitability of CBRLuc for in vivo tracing of L. plantarum. The nonideal emission of E. coli-NLuc caused the signal in the living body below the E. coli-CBRLuc, but the limitation of wavelength did not restrict the application of E. coli-NLuc in vivo imaging. The signal of E. coli-NLuc could be detected in mice and the kinetic curves of the signals of E. coli-NLuc and E. coli-CBRLuc showed a similar trend. As for FLuc, both E. coli-FLuc and L. plantarum-FLuc gave detectable signal for in vivo luminescence imaging, but E. coli-FLuc was 2 times lower than E. coli-NLuc, L. plantarum-FLuc was 1.5 times lower than L. plantarum-NLuc, consistent with the in vitro results. Through the above comparison, NLuc-based bioluminescence imaging showed superior characteristics for in vivo tracing the target bacteria.
Moreover, the bioluminescence signals of mice fed with E. coli and L. plantarum all were very intense at first and decreased gradually as time goes on. The signal of L. plantarum declined faster than E. coli, it dropped to the half of the initial signal for the mice fed with L. plantarum after 2 h, but the signal kept steady for the mice fed with E. coli. After 24 h, no bioluminescence signal was detected for both of recombinant strains (Fig. 3C and D). The different dynamics of L. plantarum and E. coli demonstrated that L. plantarum might be eliminated more rapidly than E. coli after a single oral administration. Adhesin is an important factor of bacterial colonization in the intestine of mice, diverse adhesin of E. coli and L. plantarum might be the reason of the difference.40,41
Precise localization of food-borne bacteria in the gastrointestinal tract is also essential for further investigation of their damage mechanism and nutrition effect. We compared the living mice whole-body signals and intestinal signals after 0 min, 5 min and 10 min of dissection. It was interesting to find that the signals of E. coli-CBRLuc and L. plantarum-FLuc obtained ex vivo were 22 times and 12 times lower than the signals obtained from the living body, and the intensity of intestine declined fast within 10 min. Whereas, the signals of intestines with E. coli-NLuc and L. plantarum-NLuc were thoroughly higher than the signals obtained from the living body and the signal declined very slowly within 10 min. In the previous studies, the intestines were injected with air to enhance the bioluminescence ex vivo, but it will greatly reduce the experimental efficiency. NLuc system showed its incomparable superiority here. The signals of intestines with E. coli-NLuc and L. plantarum-NLuc were thoroughly higher than the signals obtained from the living body and the signal declined very slowly within 10 min (Fig. 3E, G and F, H). The results could be explained by the fact that the reaction of NLuc system is ATP-independent, but CBRLuc and FLuc rely on ATP to produce the luminescence and they are very sensitive to the changes of ATP.42
Finally, the exact localization of E. coli-NLuc and L. plantarum-NLuc in the gastrointestinal tract ex vivo was measured by intestines imaging. The results were showed in Fig. 3I, E. coli and L. plantarum took 2 h to get to the cecum, and the strains localized in the cecum and colon after oral administration 2 h later. After 24 h, the bioluminescence signal reached the level of background.
3.3 Real-time monitoring the bioluminescent strains in feces after a single oral administration
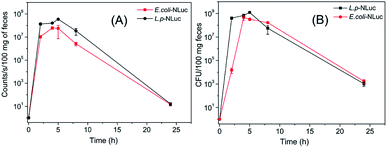
Different from traditional methods that analyzed the survival of bacteria in the gastrointestinal tract by sequencing, the present work visualized the target strains by detecting the bioluminescence, which could greatly improve the efficiency.L. plantarum and E. coli in feces of mice were herein measured, results showed that the number of bacteria reached to a maximum value with about 109 CFU per 100 mg feces for L. plantarum and 108 CFU per 100 mg feces for E. coli after approximately 5 h and 4 h respectively. The correspondent tendency for luminescence value was also detected after 5 h or 4 h. 24 h after oral administration, the bioluminescent signal declined to the background level (12 counts per seconds) and the colonies dropped to 103 CFU/100 mg (Fig. 4A and B). The number of colonies of feces of mice reconfirmed the result that L. plantarum was eliminated more rapidly than E. coli in mice.
3.4 Persistence of E. coli-Nluc and L. plantarum-Nluc in mice after multiple oral administrations
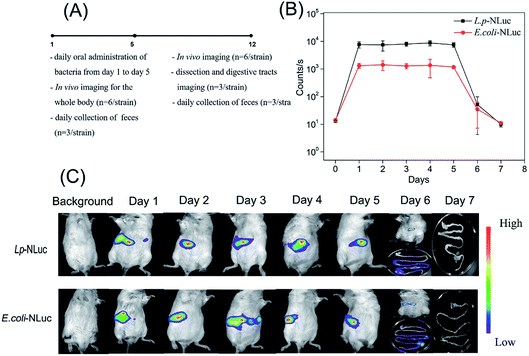
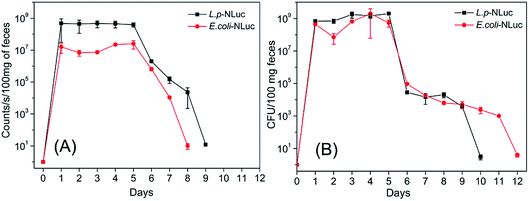
In order to explore the persistence of bioluminescent E. coli and L. plantarum in mice after multiple oral administrations, mice were fed with 3 × 10¹⁰ CFU of each strain for consecutive five days by intragastric gavage, the specific experimental design was showed in Fig. 5A. The signal maintained in a high level and kept steady from day 1 to day 5 for the group of E. coli and L. plantarum, which indicates the most bacteria of E. coli and L. plantarum were removed from the mice body and did not accumulate in the body or the accumulation was very little after 24 h administration. The bioluminescence signal of L. plantarum group was almost 6 times higher than E. coli from day 1 to day 5, and the signal began to decline from day 5, and reached to the background level at day 7 (the background signal of mice was about 10 counts per seconds). The signal was too weak to know the persistence of bioluminescent strains in mice at day 6 and day 7, so the anatomy assay was performed. Bioluminescent bacteria mainly gathered in colon nearby at day 6, while the signal of most digestive tracts dropped to the background level at day 7 (Fig. 5B and C). Furthermore, 3 days after oral administrations, the mice fed with E. coli were observed for the disease symptoms of dehydrating diarrhea and noticeable differences in hair luster compared with the control. It has rejection for exogenous bacteria in mice, the symptoms were gradually alleviated after finishing the multiple oral administrations.The target bacteria in feces after five-time oral administrations were also analyzed by detecting the bioluminescence and plating them on the selective plate for 12 days. As was described in Fig. 6A and B, the number of E. coli and L. plantarum in feces kept a high level with approximately 108 CFU per 100 mg of feces from day 1 to day 5, and then steadily declined until day 12 and day 10, respectively. The bioluminescence signal followed the same trend, but the bioluminescence of E. coli and L. plantarum group declined to the background level at day 8 and day 9 respectively. The result was reconfirmed that L. plantarum was eliminated more rapidly than E. coli in mice, which is probably due to the fact that the adhesin of E. coli were stronger than L. plantarum for the gastrointestinal tract of mice.40,41
4. Conclusions
As a conclusion, NLuc system showed its incomparable superiority in vitro and in vivo through the comparison with CBRLuc and FLuc in a nonbiased manner, especially in the application of intestinal imaging and the universality for food-borne bacteria, which demonstrated the advantages of NLuc as the ideal luciferase system for noninvasive imaging of food-borne bacteria. Moreover, the conjugation of NLuc with nanomaterials would combine both advantages of NLuc and nanomaterials, and result in the production of the imaging system with stronger penetrating ability and higher sensitivity for the real-time living body visualization. Further research on the NLuc-nanomaterials system could be performed to evaluate the accuracy and sensitivity in living body imaging, with the goal to acquire more accurate data and real-time information of food-borne bacteria for further investigation of the correlation with the systemic metabolism.Conflicts of interest
There are no conflicts to declare.Acknowledgements
This study was funded by National Key R&D Program of China (No. 2017YFC1600402), and National Natural Science Foundation of China (No. 21806083).Notes and references
- W. Cha, P. M. Fratamico, L. E. Ruth, A. S. Bowman, J. M. Nolting, S. D. Manning and J. A. Funk, Int. J. Food Microbiol., 2018, 264, 8–15 CrossRef CAS PubMed.
- N. Kamada, G. Y. Chen, N. Inohara and G. Nunez, Nat. Immunol., 2013, 14, 685–690 CrossRef CAS PubMed.
- N. Mao, A. Cubillos-Ruiz, D. E. Cameron and J. J. Collins, Sci. Transl. Med., 2018, 10, eaao2586 CrossRef PubMed.
- B. Sanchez, S. Delgado, A. Blanco-Miguez, A. Lourenco, M. Gueimonde and A. Margolles, Mol. Nutr. Food Res., 2017, 61, 1600246 CrossRef PubMed.
- M. Derrien and J. E. T. van Hylckama Vlieg, Trends Microbiol., 2015, 23, 354–366 CrossRef CAS PubMed.
- J. Liu, Z. Wang, H. Ma and S. Wang, J. Agric. Food Chem., 2018, 66, 1061–1066 CrossRef CAS PubMed.
- G. Chen, I. Roy, C. Yang and P. N. Prasad, Chem. Rev., 2016, 116, 2826–2885 CrossRef CAS PubMed.
- K. Nienhaus and G. U. Nienhaus, Chem. Soc. Rev., 2014, 43, 1088–1106 RSC.
- B. R. Smith and S. S. Gambhir, Chem. Rev., 2017, 117, 901–986 CrossRef CAS PubMed.
- A. Berlec, J. Zavrsnik, M. Butinar, B. Turk and B. Strukelj, Microb. Cell Fact., 2015, 14, 181 CrossRef PubMed.
- T. García-Cayuela, L. P. G. de Cadiñanos, M. L. Mohedano, P. F. de Palencia, D. Boden, J. Wells, C. Peláez, P. López and T. Requena, Appl. Microbiol. Biotechnol., 2012, 96, 171–181 CrossRef PubMed.
- J. M. Landete, M. Medina and J. L. Arques, World J. Microbiol. Biotechnol., 2016, 32, 119 CrossRef PubMed.
- W. F. van Zyl, S. M. Deane and L. M. T. Dicks, Appl. Environ. Microbiol., 2015, 81, 5993–6002 CrossRef CAS PubMed.
- Y. Liu, J. Liu, D. Zhang, K. Ge, P. Wang, H. Liu, G. Fang and S. Wang, J. Agric. Food Chem., 2017, 65, 8229–8240 CrossRef CAS PubMed.
- A. Abdukayum, J. Chen, Q. Zhao and X. Yan, J. Am. Chem. Soc., 2013, 135, 14125–14133 CrossRef CAS PubMed.
- A. Abdukayum, C. Yang, Q. Zhao, J. Chen, L. Dong and X. Yan, Anal. Chem., 2014, 86, 4096–4101 CrossRef CAS PubMed.
- J. Liu, Y. Liu, D. Zhang, G. Fang and S. Wang, ACS Appl. Mater. Interfaces, 2016, 8, 29939–29949 CrossRef CAS PubMed.
- N. Andreu, A. Zelmer and S. Wiles, FEMS Microbiol. Rev., 2011, 35, 360–394 CrossRef CAS PubMed.
- D. Close, T. Xu, A. Smartt, A. Rogers, R. Crossley, S. Price, S. Ripp and G. Sayler, Sensors, 2012, 12, 732–752 CrossRef CAS PubMed.
- S. Karimi, D. Ahl, E. Vågesjö, L. Holm, M. Phillipson, H. Jonsson and S. Roos, PLoS One, 2016, 11, e151969 Search PubMed.
- Z. M. Kaskova, A. S. Tsarkova and I. V. Yampolsky, Chem. Soc. Rev., 2016, 45, 6048–6077 RSC.
- Y. Nasu and R. E. Campbell, Science, 2018, 359, 868–869 CrossRef CAS PubMed.
- J. M. S. Loh and T. Proft, Biotechnol. Lett., 2014, 36, 829–834 CrossRef CAS PubMed.
- A. E. Masser, G. Kandasamy, J. M. Kaimal and C. Andréasson, Yeast, 2016, 33, 191–200 CrossRef CAS PubMed.
- F. X. Schaub, M. S. Reza, C. A. Flaveny, W. Li, A. M. Musicant, S. Hoxha, M. Guo, J. L. Cleveland and A. L. Amelio, Cancer Res., 2015, 75, 5023–5033 CrossRef CAS PubMed.
- A. Shakhmin, M. P. Hall, T. Machleidt, J. R. Walker, K. V. Wood and T. A. Kirkland, Org. Biomol. Chem., 2017, 15, 8559–8567 RSC.
- A. C. Stacer, S. Nyati, P. Moudgil, R. Iyengar, K. E. Luker, A. Rehemtulla and G. D. Luker, Mol. Imaging, 2013, 12, 2013–7290 CrossRef.
- H. Yeh, O. Karmach, A. Ji, D. Carter, M. M. Martins-Green and H. Ai, Nat. Methods, 2017, 14, 971–974 CrossRef CAS PubMed.
- J. Liu, N. Zhao, Z. Wang, S. Lv, C. Li and S. Wang, J. Agric. Food Chem., 2018, 67, 514–519 CrossRef PubMed.
- J. Wang, X. Du, X. Lu and S. Wang, Appl. Microbiol. Biotechnol., 2013, 97, 2077–2091 CrossRef CAS PubMed.
- C. Daniel, S. Poiret, V. Dennin, D. Boutillier and B. Pot, Appl. Environ. Microbiol., 2013, 79, 1086–1094 CrossRef CAS PubMed.
- X. Ji, P. Lu and S. van der Veen, Appl. Microbiol. Biotechnol., 2019, 103, 1465–1474 CrossRef CAS PubMed.
- M. Saarela, G. Mogensen, R. Fonden, J. Matto and T. Mattila-Sandholm, J. Biotechnol., 2000, 84, 197–215 CrossRef CAS PubMed.
- K. Spath, S. Heinl, E. Egger and R. Grabherr, Mol. Biotechnol., 2012, 52, 40–48 CrossRef CAS PubMed.
- E. Silberstein, C. Serna, S. P. Fragoso, R. Nagarkatti and A. Debrabant, PLoS One, 2018, 13, e195879 CrossRef PubMed.
- S. Ur Rahman, M. Stanton, P. G. Casey, A. Spagnuolo, G. Bensi, C. Hill, K. P. Francis, M. Tangney and C. G. M. Gahan, Front. Microbiol., 2017, 8, 1797 CrossRef PubMed.
- M. A. Paley and J. A. Prescher, MedChemComm, 2014, 5, 255–267 RSC.
- L. Mezzanotte, M. van T Root, H. Karatas, E. A. Goun and C. W. G. M. Löwik, Trends Biotechnol., 2017, 35, 640–652 CrossRef CAS PubMed.
- A. Taylor, J. Sharkey, A. Plagge, B. Wilm and P. Murray, Contrast Media Mol. Imaging, 2018, 2018, 1–10 CrossRef PubMed.
- U. Frömmel, W. Lehmann, S. Rödiger, A. Böhm, J. Nitschke, J. Weinreich, J. Groß, D. Roggenbuck, O. Zinke, H. Ansorge, S. Vogel, P. Klemm, T. Wex, C. Schröder, L. H. Wieler and P. Schierack, Appl. Environ. Microbiol., 2013, 79, 5814–5829 CrossRef PubMed.
- L. Y. Jessie Lau and F. Y. Chye, Food Control, 2018, 91, 237–247 CrossRef.
- C. G. England, E. B. Ehlerding and W. Cai, Bioconjugate Chem., 2016, 27, 1175–1187 CrossRef CAS PubMed.
Footnotes |
| † Electronic supplementary information (ESI) available. See DOI: 10.1039/d0ra01283a |
| ‡ These authors have contributed equally to this work. |
| This journal is © The Royal Society of Chemistry 2020 |

