 Open Access Article
Distinguishing between halogenated alkanes containing the same halogen based on the reaction kinetic parameter using negative ion mobility spectrometry at atmospheric pressure
Haiyan Han *ab,
Shihu Dub,
Yongliang Yan*c,
Xiuhong Liub,
Qiaofen Zhub,
Ruili Shib,
Sixing Xib,
Feng Liub,
Zhi Zhao*b and
Yannan Chu*a
aAnhui Province Key Laboratory of Medical Physics and Technology, Institute of Health and Medical Technology, Hefei Institutes of Physical Science, Chinese Academy of Sciences, Hefei, 230031, P. R. China. E-mail: ychu@aiofm.ac.cn
bSchool of Mathematics and Physics, Hebei University of Engineering, Handan 056038, PR China. E-mail: hanhy0226@163.com; hanwzl@163.com
cSchool of Information and Electrical Engineering, Hebei University of Engineering, Handan 056038, PR China. E-mail: yylhhy@163.com
First published on 10th August 2020
Abstract
Electron adsorption ionization ion mobility spectrometry can be used to detect halogen-containing volatile organic compounds with high sensitivity. However, this traditional electron attachment detection method cannot distinguish between volatile organic compounds containing the same halogen. For different organic compounds containing the same halogen, the product ions formed by the dissociation electron attachment process are the same. In this article, we propose a novel negative corona discharge ion mobility spectrometry method to distinguish between and detect halogenated alkanes containing the same halogen according to the different electron attachment rates and reaction kinetic parameters of the different halogenated alkanes. Although these halogenated alkanes, which contain the same halogen, produce the same type of ions through the electron attachment process, their electron attachment rates are different from each other. In this work, the kinetic information is used as the fingerprint information for the tested samples to distinguish different halogenated alkanes. Five halogenated alkanes were successfully detected using this method. The results show that the method based on the electron attachment rate constant is feasible for the determination of halogenated alkanes containing the same halogen.
1. Introduction
Halogenated alkanes RX (X = Cl, Br, and I) are ubiquitous environmental contaminants and important environmental pollution sources owing to their wide range of applications in the chemical, pharmaceutical, electrical, and food industries, paint formulations and so on.1–5 These halogenated alkanes, used either indoors or outdoors, are not only harmful to human health, but also detrimental to our surroundings.6–8 Therefore, it is essential to develop analytical methods for the analysis of halogenated alkane compounds.There are several detection approaches used to detect these compounds, including gas chromatography,9,10 mass spectrometry,11,12 spectroscopy,13,14 electronic noses,15,16 and other types of sensors.17,18 The halogenated alkanes have a very strong electronic attachment capability. Therefore, some experimental techniques use a low-energy electron attachment method to ionize such compounds. These ionization methods include the electron swarm,19,20 flowing afterglow Langmuir probe,21,22 Rydberg collisional ionization,23,24 electron cyclotron resonance25,26 and so on.
In a few cases, ion mobility spectrometry (IMS) has been observed to detect volatile organic compounds (VOCs) at atmospheric pressure.27–31 In the IMS technique, different ions are separated according to their individual velocities driven by an electric field as they move through a drift tube. IMS is a simple, inexpensive, and highly sensitive analytical method with a small size (enabling portability) and a fast response time that is used for the detection of organic trace compounds compared with other gas analyzers. Owing to the advantages, the IMS technique has been widely used in many fields, such as the detection of drugs and explosives,32,33 monitoring of environmental pollution,34,35 disease diagnosis,36,37 structure analysis of clusters and biomolecules,38,39 and other applications for trace measurements.
Halogenated alkanes can also be detected very well in the negative mode of ion mobility measurements. The detection is mostly based on the electron attachment behavior of the samples owing to the high ionization efficiency. In many apparatus, the ionization source applied in IMS is a 63Ni source.40–42 The radioactive source is stable, simple, and the is no need for an extra power supply, however there are inevitable disadvantages in terms of the regular leak tests and waste disposal. In addition, the ion generation rate of the 63Ni source is not high enough and results in a limited sensitivity and low measurement range. In recent years, a corona discharge ionization source has been used in the IMS technique. The ion intensity of the corona discharge ionization source is larger than that of the 63Ni ionization source in order to obtain a higher signal-to-noise ratio and better sensitivity.43–45 Using a negative corona discharge, the ionization source can offer a high intensity electron signal to meet the needs of the electron attachment of halogenated alkanes.
However, there are two weaknesses in the halogenated alkanes detection process using a negative corona discharge ion source. One weakness is that if a high concentration of the sample molecules diffuse into the discharge region, the discharge will be extinguished. Another weakness is that if the hydrocarbons contain the same halogen, the product ions of the electron attachment reaction in the spectra give the same signals because of the dissociative electron attachment. This makes it very difficult to distinguish between samples containing the same halogen.
In this work, the drift tube was improved to avoid the quenching phenomena by preventing the sample from entering the ionization source in the detection process. Different samples, particularly those samples containing the same halogen, were distinguished based not on the product ion, but on the reaction rate constant.
2. Experimental section
2.1 Equipment and conditions
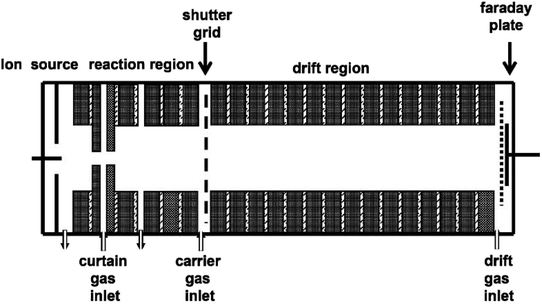
The dissociative electron attachment experimental processes for the halogenated alkanes were performed using a homemade IMS, as shown in Fig. 1. The apparatus mainly consists of the IMS drift tube and data processing section.The drift tube is 20 cm long (4 cm internal diameter), which consists of the ionization source, ion–molecule reaction region, drift and separate region, ion shutter and ion collector. The ionization source is a continuous point-to-plane corona discharge source. The discharge voltage between the corona brass needle and the brass plate can be adjusted in the range of 3 to 5 kV. During the experiments, the discharge gas used was a high pure nitrogen gas with flow rates from 50 to 300 mL min−1. The corona discharge of nitrogen can produce a high concentration of electrons. In order to avoid the corona discharge quenching when the high concentration electron attachment samples enter, there is a special electrode ring behind the discharge plate, called the curtain ring, with a hole of about 0.5–0.8 mm in the center of the electrode ring.46 The nitrogen gas enters the mobility tube through a curtain ring between the curtain electrode ring and the discharge plate to prevent the sample molecules diffusing into the discharge area.
The corona discharge can maintain a continuous and constant current under the action of the curtain ring and the curtain gas. The electrons can enter into the reaction region to be attached by the halogenated alkane molecules. The product ions can move forward under the effect of the electric field. The electric field along the axis of the drift tube can be formed using a high voltage, which is distributed through a series of 2 MΩ resistors on the electrode rings. The electrode rings of the drift tube are electronically insulated from each other using a 1 mm thick Teflon spacer. The electric field strength in the drift region is adjusted in the range of 200–500 V cm−1. An ion shutter consists of two interdigitated and parallel Bradbury–Nielsen wire arrays between the reaction region and the drift region. The product ions can enter the drift region through the ion shutter when the shutter is open. The ionic pulse width can vary from 50 to 300 μs. Therefore, the ion shutter converts the constant stream of electrons produced in the reaction region into a chain of pulses to enter the drift region. At the end of the drift area there is a Faraday plate to collect the accumulated ion current. The current signal amplified by the current amplifier is fed into the computer data processing system. Switched gain ranges of 10−9 to 10−6 A V−1 of the amplifier allow the measurement of electrons or ion currents over the range of 1 nA to 1 μA. The drift gas enters the tube from the end of the drift region close to the detector and flows countercurrent to the carrier gas to sweep neutral molecules out of the drift tube. The drift gas flow rate can be adjusted from 300 to 800 mL min−1 as needed. The carrier gas enters into the drift tube from behind the curtain ring to carry the sample gas into the reaction region.
The IMS instrument was operated under atmospheric pressure from 740 to 750 Torr, measured using a mercury barometer. The operating temperature was at an atmospheric temperature of 20 or 25 °C, measured using a digital thermometer.
2.2 Introduction system and samples
Halogenated alkanes of different concentrations can be obtained using a linear injection syringe pump apparatus. The glass micro-injectors with volumes from 1 to 100 μL filled with headspace vapor are fixed onto the syringe pump. The syringe pump speed can be adjusted according to the volume and internal diameter of the micro-injector. The sample from the syringe pump is injected into the drift tube using the carrier gas. Therefore, the sample concentrations in real time can be calculated using the initialization concentration, the syringe pump linear movement speed and the flow rate of the carrier gas. Different sample concentrations can be obtained by adjusting the volume of a glass micro-injector, the injection pump injection speed and the flow rate of the carrier gas.The drift and carrier gases used in the experiments were all ultra-high pure nitrogen gas provided by a compressed gas bottle (Nanjing Special Gas Co., Ltd., Nanjing, China). All of the chemical reagents were analytical reagents (Shanghai Haohua Chemical Co., Ltd., Shanghai, China).
3. Results and discussion
3.1. Formation of reactant ions
The reactant ions used in this experiment were low energy electrons (0–0.64 eV). In pure nitrogen, the electrons are effectively produced through a continuous negative corona discharge ion source. The formation process of electrons is described by reaction (1).| N2 → N2+ + e− | (1) |
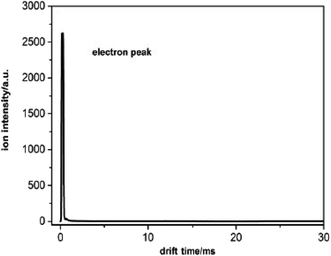
The electrons can be extracted using a negative applied electric field and pass through the entire drift tube when there is no sample. There is only one peak with a high intensity in the spectrum according to the electron signal. Owing to the small mass, the electron peak is very close to zero drift time as illustrated in Fig. 2. The intensity of the electron peak varies with the voltage between the two electrodes of the corona discharge source, the pulse width of the ion shutter grid, the electric field of the drift tube, and so forth.
3.2. Detection based on product ion types
Different sampling and testing methods were examined in this work to find a suitable method to separate the halogenated alkanes with the same halogen. We first detected the samples using the traditional detection method of IMS.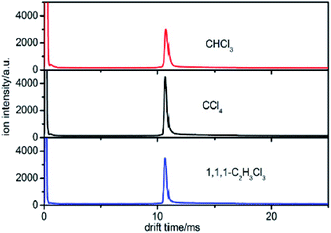 | ||
| Fig. 3 The spectra of CHCl3, CCl4 and 1,1,1-C2H3Cl3 when the sample is introduced into the IMS tube from the reaction region. | ||
This new peak corresponds to Cl− ions. The chloride ion Cl− is the only product ion observed in the pure nitrogen environment, because this reaction is a dissociative electron attachment process as shown in eqn (2).47
 | (2) |
In this reaction process, the chloride ion Cl− is the only product ion observed. The electron charge ends up on the halogen ion. Therefore, the charges in the reaction (eqn (2)) are balanced. The ion drift velocity in an IMS is expressed as shown in eqn (3).
| v = K × E | (3) |
In which, v is the velocity of ions, K is the ion mobility, and E is the electrostatic field in the entire drift region. If the ionic drift distance is L, the transit time in the drift region is t, the ionic mobility can be derived according to eqn (4).48
 | (4) |
The ion mobility K depends on the ionic mass, collision cross-section, and drift gaseous temperature and pressure. Normally, the ion mobility is normalized to the reduced mobility K0, which is supposed to be unrelated to the gaseous temperature T and pressure P in experiments.
 | (5) |
According to eqn (5), the reduced mobility for the peak in the three spectra of Cl− in Fig. 3 is calculated to be 2.87 cm2 V−1 s−1.
The reduced mobility K0 of different ions is distinguished because of the different sizes, shapes, mass, and so forth. The traditional IMS technology can identify different samples through the differential reduced mobility K0 of every sample. However, this distinction method is not suitable for same halogen VOCs, because only one kind of the same product ions can be obtained in the corresponding spectrum. This kind of phenomenon also occurs in other halogenated alkanes with the same halogen.
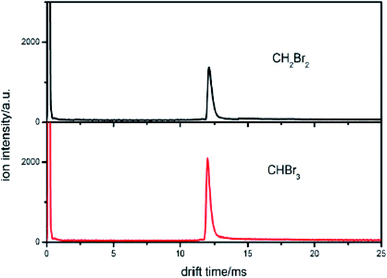 | ||
| Fig. 4 The spectra of CH2Br2 and CHBr3 when the sample is introduced into the IMS tube from the reaction region. | ||
This new peak corresponds to Br− ions. The reaction is also a dissociative electron attachment process, as shown in eqn (6).
 | (6) |
According to eqn (5), the reduced mobility for the Br− ion peak shown in Fig. 4 is calculated to be 2.54 cm2 V−1 s−1. The traditional detection method based on the reduced mobility values for IMS cannot distinguish two samples with the same halogen.
From the previous examples of halogenated alkanes with the same halogen, it can be seen that the low energy electron attachment reaction to the halide organic compounds is a dissociative process, which dissociates to yield a negative halide ion together with a neutral (usually a radical) fragment. IMS cannot identify the type of sample using only the same product ion signal. We must distinguish the halogenated alkanes with the same halogen using other detection methods. The method used in this work to distinguish these halogenated alkanes is based on the electron attachment rate constant or the reaction rate constant.
3.3. Detection based on the rate constant
Although the same product ion is obtained for the reaction of these halogenated alkanes with an electron, the reaction rates for each are different. The rate constants can be used as parameters to distinguish the different samples.
 | (7) |
The low energy electron attachment reaction to the halide organic compounds is a dissociative process, which dissociates to yield a negative halide X− ion together with a neutral (usually a radical) fragment R as the reaction products. The electron attachment rate for this reaction equation can be written as eqn (8) according to the definition relation of the chemical reaction equation.
 | (8) |
In which, [X−] is the concentration of halogen ions, [e−] represents the electron concentrations, [RX] represents the concentrations of the neutral halogenated alkanes and k is the reaction rate constant, respectively.
According to the conclusions drawn by Tabrizchi,49 the electron swarm is exponentially diluted as traveling in the drift region and can be described using eqn (9).
[e]t = [e]0![[thin space (1/6-em)]](https://www.rsc.org/images/entities/char_2009.gif) exp(−k[RX]t) exp(−k[RX]t)
| (9) |
In this equation [e]0 and [e]t are the concentration of electrons at the initial and elapsed time, respectively. The elapsed time t can be obtained using eqn (10).
 | (10) |
In which, w is the electron swarm velocity and x is the traveled distance. The electron attachment rate k is constant under the fixed electron energy value. It can be used to distinguish different halogenated alkane samples. Information on the rate constant k can be obtained using the ion trajectory in the drift region. However, when the sample enters the drift tube from the reaction region, the product ions are all formed before the ion shutter. Therefore, only the product and base ions are illustrated in the corresponding spectrum without information for the rate constant k. If the samples don't enter the drift tube from the reaction region, the high concentration electrons can pass the ion shutter during the open time. These samples can diffuse in the drift region to become a decay exponential distribution according to the distance from the ion shutter. When the halogenated alkane samples are continuously introduced into the drift tube from the end of the drift region, the neutral molecules can move towards the reaction region carried by the drift gas. Some molecules can arrive at the reaction region to be ionized into halogen ions. These negative ions can pass through the ion shutter during the opening time and move towards the Faraday plate to form an ion peak. Other molecules that do not enter the reaction region in the drift region can capture electrons and dissociate into negative halogen ions and alkyls. These halogen ions formed in the drift region are distributed all along the drift tube and move towards the Faraday plate. The drift time of these ions passing through the drift region varies with the ionized position. The intensity of these ions is exponentially increased with the electron distribution intensity in the drift region. This phenomenon can be recorded using the mobility spectrum. For example, CCl4 is detected using this method and the corresponding spectrum is illustrated in Fig. 5 (spectra a).
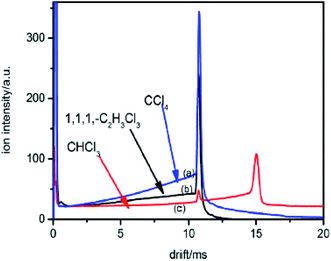 | ||
| Fig. 5 The spectra of CHCl3, CCl4 and 1,1,1-C2H3Cl3 when the sample is introduced into the IMS tube from the drift region. | ||
The high intensity ion peak at close to 11 ms in Fig. 5 corresponds to the signal for the Cl− ions formed in the reaction region. There is a gradually increasing trail that appears to the left of the negative Cl− ion peak. This trail corresponds to the Cl− ions formed during the sample molecules moving towards the ion shutter in the drift region. A similar phenomenon also occurs in the other halogenated alkane samples as illustrated in Fig. 5 (spectra b and c). The shapes of these trails are different from each other because of the different electron attachment reaction rates, k, of the reaction (eqn (7)). The electron attachment rate can be obtained from the information of these trails, which can become the distinguishing basis for different alkanes with the same halogen. According to eqn (9) and (10), the concentration of the negative ions formed at each point x in the drift region during the injection time of the electron swarm, tg, can be calculated as shown in eqn (11).
 | (11) |
The distance x can be expressed by the time taken for the ions to travel through this length, as shown in eqn (12).
| x = (td − t)vd | (12) |
In this equation, t is the time the ions spent from the point to the collected plate, td is the drift time of the halogen ions to travel through the entire drift region, and vd is the drift velocity of the ions. The drift velocity of the negative ions vd can be calculated from the ion mobility spectrum through the ratio between the length of the drift tube L and the drift time td of the halogen ion peak. Therefore, the concentration of the X− ions in eqn (11) can be described by eqn (13).
 | (13) |
The equation shows that the intensity of the X− ions can form a tail signal before the corresponding ion peak when the neutral molecules continuously enter the drift tube from the end of the drift region. This agrees with the spectra traces in Fig. 5 (a–c). The logarithm of this tail signal should be a straight line, and the slope of this line can be obtained by taking the logarithm of eqn (14):
 | (14) |
From eqn (14), it can be seen that the logarithm of the ion current intensity versus drift time for the trail is a straight line. The line has a slope proportional to the rate constant. The first two terms are the intercept of the straight line and the last term is the slope of the line S, which can be described by eqn (15):
 | (15) |
The electron attachment rate constant of halides RX can be calculated using eqn (16).
 | (16) |
In which, the slope S can be obtained through the spectrum. The electron drift velocity w depends on the value of E/N, in which E is the electric field and N is the neutral density in the drift region. The values for w at each E/N have been given by Jarvis et al.50 When the drift time td, the electron velocity w and the sample concentration are known, the electron attachment rate constant k of halides RX can be easily obtained using eqn (16). This rate constant can become the finger to distinguish different halides with the same halogen. In the process of detecting the rate constant, the sample concentration can be obtained using the linear syringe pump apparatus as described in the introduction. When the above parameters are substituted into eqn (16), the rate constant k can be easily obtained.
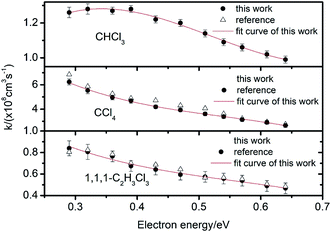 | ||
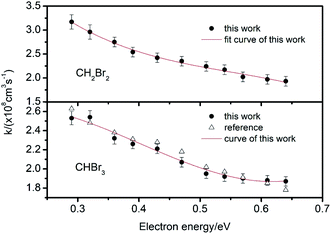
| Fig. 6 Electron attachment constants k for CHCl3, CCl4 and 1,1,1-C2H3Cl3 at different electron energies. | ||
 | (17) |
For CCl4 and 1,1,1-C2H3Cl3, there is one peak in the spectra shown in Fig. 5. There are two peaks in the spectrum of CHCl3, the second peak corresponds to the cluster ions (CHCl3)·Cl−. Owing to the different kinetic parameters of the different halogenated alkanes, the efficiency of this reaction varies significantly. However, there are no second ion peaks in the spectra of other halogenated alkanes. For CHCl3, the Gibbs energy of the reaction shown in eqn (17) is about −8.7 kcal mole−1 smaller than the other halogenated alkanes (−2.1 to −6.5 kcal mole−1), which improves the opportunity of the clustering reaction. The dissociation half-life of (CHCl3)·Cl− is about 0.44 μs which is also larger than the other halogenated alkanes with weaker associations with the Cl− ion.53,54
For example, two samples were detected using this method marked with sample a and b, respectively. The samples were injected into the drift tube from the reaction region. The neutral molecules captured the electrons to be ionized into halogen ions, move through the ion shutter and arrive at the collector plate under the influence of the mobility electric field. The spectra of the two samples are illustrated in Fig. 8.
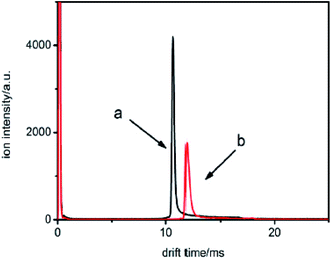 | ||
| Fig. 8 The spectra for samples a and b when the samples are introduced into the IMS tube from the reaction region. | ||
From Fig. 8, it can be seen that the mobility time is 10.6 ms for sample a and 11.8 ms for sample b. The reduced mobility K0 values are calculated by utilizing eqn (4) and (5) and were found to be 2.87 and 2.54 cm2 V−1 s−1, respectively. Therefore, by comparing these values with the K0 values, it can be concluded that sample a is a chloroalkane and sample b is a brominated halogenated alkane. However, from this information, the types of sample cannot be identified.
The samples were then injected into the drift tube from the drift region carried by the drift gas, respectively. The corresponding spectra are illustrated in Fig. 9.
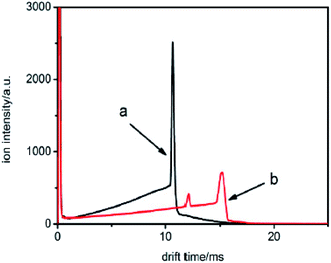 | ||
| Fig. 9 The spectra of samples a and b when the samples are introduced into the IMS tube from the drift region. | ||
From these traces, it can be seen that the trails in front of the ion peak are different from each other. To determine the kind of sample, the electron attachment rate constant k of each sample is calculated using the method introduced above. Comparing these values with the data given in Fig. 6 and 7, the type of sample can be easily obtained. Sample a is 1,1,1-C2H3Cl3, and sample b is CHBr3, respectively. The result was confirmed by comparison with the tagged samples, indicating that this method is credible and feasible.
3.4 Reproducibility measurements for the method
In order to test the reproducibility of the proposed method, we measured the samples under different times and experimental conditions. We used CCl4 as an example. From Fig. 10, it can be seen that the peak position of the product ion does not change when the concentration changes from 40 to 160 ppb. Although the ion peak is in the same position, the trailing signals in front of the ion peak have a different shape owing to the different sample concentrations. In addition, the spectra of 40 and 80 ppb were measured on the same day, while those of 120 and 160 ppb were measured on another day. The time interval was 35 days. It can be seen from the figure that the spectral position of the same sample measured at different times has a good reproducibility. This result proves that the value of the electron attachment rate constant is feasible, which means that the subsequent section used to detect the concentration is credible.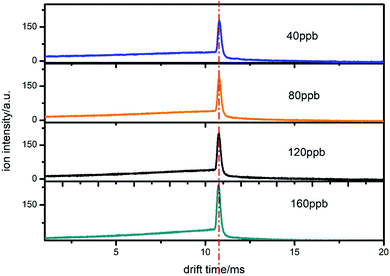 | ||
| Fig. 10 The spectra of CCl4 when introduced from the drift region at different concentrations on different days. | ||
4. Conclusions
Halogenated alkanes containing the same halogen cannot be distinguished between using traditional negative corona discharge ion mobility spectrometry. The reaction product ions are the same because the reaction between the sample and electrons is a dissociative electron attachment. In this work, a novel method has been developed to distinguish between halogenated alkanes based on a novel sample injection mode. In this method, the sample molecules are continuously introduced into the drift gas from the end of the drift region and ionized during the collision process. The spectra obtained at the end of the drift tube includes information on the sample electron attachment rate constant. Although the same product ion is obtained for the reaction of these halogenated alkanes with electrons, the reaction rates are different from each other. The rate constants can be used as parameters to distinguish between halogenated alkanes containing the same halogen.Five samples were detected using the method described in this work. The method used for obtaining the electron attachment rate constant is given. The rate constants of these samples are given at the different electron energies obtained using this method. The rate constants obtained in this work are compared with the data in the references. By comparison, it can be found that the data obtained in this work were in good agreement with the data in the references. To examine the accuracy of this method, two unknown samples were detected. The test results show that the method is accurate and feasible, which provides a novel method to distinguish between halogenated alkanes containing the same halogen for negative IMS. In order to test the reproducibility of the proposed method, the samples were detected at different times and under different experimental conditions. The measurement results show that the method proposed in our work has a good reproducibility. All the results show that this method can be used to detect and distinguish halogenated alkanes with the same halogens.
Conflicts of interest
There are no conflicts to declare.Acknowledgements
We gratefully thank the National Natural Science Foundation of China (No. 21976049, 11904073), and the Natural Science Foundation of Hebei Province (No. F2019402351, F2019402063, B2015402066) for their support of this work.References
- M. Tancrede, R. Wilson and L. Zeise, Atmos. Environ., 1987, 21, 2187–2205 CrossRef CAS.
- F. F. Zhang, L. T. Wang, J. Yang and M. Z. Chen, World J. Eng., 2015, 12, 221–236 CrossRef CAS.
- F. He, D. Zhao and C. Paul, Water Res., 2010, 44, 2360–2370 CrossRef CAS PubMed.
- S. Giannoukos, M. J. A. Josepha and S. Taylor, Anal. Methods, 2017, 9, 910–920 RSC.
- G. Mancini, G. Brancato, B. Chandramouli and V. Barone, Chem. Phys. Lett., 2015, 625, 186–192 CrossRef CAS.
- A. D. Olaitan, B. Zekavat, B. Dhungana, W. C. Hockaday, C. K. Chambliss and T. Solouk, Anal. Methods, 2014, 6, 4982–4987 RSC.
- A. S. Bale, S. Barone Jr, C. S. Scott and G. S. Cooper, Toxicol. Appl. Pharmacol., 2011, 255, 113–126 CrossRef CAS PubMed.
- G. S. Cooper, S. L. Makris, P. J. Nietert and J. Jinot, Environ. Health Perspect., 2009, 117, 696–702 CrossRef CAS PubMed.
- O. Komolafe, B. Bowler, J. Dolfing, W. Mrozik and R. J. Davenport, Anal. Methods, 2019, 11, 3474–3482 RSC.
- M. Mieth, J. K. Schubert, T. Groger, B. Sabel and S. Kischkel, Anal. Chem., 2010, 82, 2541–2551 CrossRef CAS PubMed.
- Z. Z. Cheng, T. Mozammel, J. Patel, W. J. Lee, S. Y. Huang, S. Lim, X. B. Ma, S. Bhargava and C. E. Li, Int. J. Mass Spectrom., 2018, 434, 23–28 CrossRef CAS.
- F. M. Fernandez and J. F. Garcia-Reyes, Anal. Methods, 2017, 9, 4894–4895 RSC.
- R. G. Gibilisco, I. Bejan, I. Barnes, P. Wiesen and M. A. Teruel, Chem. Phys. Lett., 2015, 618, 114–118 CrossRef CAS.
- L. Messaadia, G. E. Dib, A. Ferhati and A. Chakir, Chem. Phys. Lett., 2015, 626, 73–79 CrossRef CAS.
- M. Gancarz, J. Wawrzyniak, M. G. Witulsk, A. Nawrocka, M. Tadla and R. Rusinek, Measurement, 2017, 103, 227–234 CrossRef.
- Y. Dong, W. Gao, Q. Zhou, Y. Zheng and Z. You, Anal. Chim. Acta, 2010, 671, 85–91 CrossRef CAS PubMed.
- S. S. Shen, J. Yuan, Y. F. Chai, J. Wu and Y. J. Pan, Int. J. Mass Spectrom., 2018, 430, 143–148 CrossRef CAS.
- T. Lindfors and A. Ivaska, Anal. Chim. Acta, 2001, 437, 171–182 CrossRef CAS.
- J. M. Chen, C. C. Yang, W. H. Chung and W. H. Ding, RSC Adv., 2016, 6, 96510–96517 RSC.
- W. Barszczewska, J. Kopyra, J. Wnorowska and I. Szamrej, Int. J. Mass Spectrom., 2004, 233, 199–205 CrossRef CAS.
- T. P. Ragesh Kumar, B. Brynjarsson, B. Ómarsson, M. Hoshino and O. Ingólfsson, Int. J. Mass Spectrom., 2018, 426, 12–28 CrossRef CAS.
- P. Spanel and D. Smith, Int. J. Mass Spectrom., 2001, 205, 243–252 CrossRef CAS.
- S. Buathong, M. Kelley, C. H. Wang and F. B. Dunning, Chem. Phys. Lett., 2015, 618, 153–161 CrossRef CAS.
- F. Misaizu, T. Kondow and K. Kuchitsu, Chem. Phys. Lett., 1991, 178, 369–373 CrossRef CAS.
- S. F. Yoon, K. H. Tan, Rusli and J. Ahn, J. Appl. Phys., 2002, 91, 40–47 CrossRef CAS.
- S. F. Yoon, K. H. Tan, Rusli and J. Ahn, J. Appl. Phys., 2002, 91, 1634–1639 CrossRef CAS.
- M. J. Cohen and F. W. Karasek, J. Chromatogr. Sci., 1970, 8, 330–337 CrossRef CAS.
- H. H. Hill, W. F. Siems, R. H. Stlouis and D. G. McMinn, Anal. Chem., 1990, 62, 1201A–1209A CrossRef CAS.
- G. A. Eiceman, Anal. Chem., 1991, 22, 471–490 CAS.
- R. H. Stlouis and H. H. Hill, Crit. Rev. Anal. Chem., 1990, 21, 321–355 CrossRef CAS.
- R. P. Erickson, A. Tripathi, W. M. Maswadeh, A. P. Snyder and P. A. Smith, Anal. Chim. Acta, 2006, 556, 455–461 CrossRef CAS.
- J. R. Verkouteren and J. L. Staymates, Forensic Sci. Int., 2011, 206, 190–196 CrossRef CAS PubMed.
- R. G. Ewing, D. A. Atkinson, G. A. Eiceman and G. J. Ewing, Talanta, 2001, 54, 515–529 CrossRef CAS PubMed.
- I. M. Sillero, E. A. Herrador, S. Cardenas and M. Valcarcel, TrAC, Trends Anal. Chem., 2011, 30, 677–690 CrossRef.
- A. N. Klyucharev and P. A. Pechatnikov, Russ. J. Phys. Chem. B, 2014, 8, 783–786 CrossRef CAS.
- P. Shahdousti and N. Alizadeh, Anal. Chim. Acta, 2011, 684, 67–71 CrossRef CAS PubMed.
- V. Ruzsanyi, J. I. Baumbach, S. Sielemann, P. Litterst and M. Westho, J. Chromatogr. A, 2005, 1084, 145–151 CrossRef CAS PubMed.
- Z. Karpas, B. Tilman, R. Gdalevsky and A. Lorber, Anal. Chim. Acta, 2002, 463, 155–163 CrossRef CAS.
- N. Arabzadeh and T. Khayamian, Talanta, 2012, 99, 29–35 CrossRef CAS PubMed.
- I. Dzidic, D. I. Carroll, R. N. Stillwell and E. C. Horning, Anal. Chem., 1976, 48, 1763–1768 CrossRef CAS.
- S. K. Guharay, P. Dwivedi and H. H. Hill Jr, IEEE Trans. Plasma Sci., 2008, 36, 1458–1470 CAS.
- H. H. Hill and G. Simpson, Anal. Chem. Technol., 1997, 1, 119–134 CrossRef.
- T. Khayamian, M. Tabrizchi and N. Taj, Int. J. Ion Mobility Spectrom., 2017, 20, 15–21 CrossRef.
- H. Borsdorf, H. Schelhorn, J. Flachowsky, H. R. Doring and J. Stach, Anal. Chim. Acta, 2000, 403, 235–242 CrossRef CAS.
- C. L. Crawford and H. H. Hill, Talanta, 2013, 107, 225–232 CrossRef CAS PubMed.
- M. Tabrizchi and A. Abedi, Int. J. Mass Spectrom., 2002, 218, 75–85 CrossRef CAS.
- H. Borsdorf, E. G. Nazarov and G. A. Eiceman, Int. J. Mass Spectrom., 2004, 232, 117–126 CrossRef CAS.
- H. Borsdorf and G. A. Eiceman, Appl. Spectrosc. Rev., 2006, 41, 323–375 CrossRef CAS.
- M. Tabrizchi and A. Abedi, J. Phys. Chem. A, 2004, 108, 6319–6324 CrossRef CAS.
- G. K. Jarvis, R. A. Kennedy and C. A. Mayhew, Int. J. Mass Spectrom., 2001, 205, 253–270 CrossRef CAS.
- H. Shimamori, Y. Tatsumi, Y. Ogawa and T. Sunagawa, J. Chem. Phys., 1992, 97, 6335–6347 CrossRef CAS.
- T. Sunagawa and H. Shimamori, J. Chem. Phys., 1997, 107, 7876–7883 CrossRef CAS.
- A. Kalamarides, R. W. Marawar, M. A. Durham, B. G. Lindsay, K. A. Smith and F. B. Dunning, J. Chem. Phys., 1990, 93, 4034–4046 CrossRef.
- R. A. Popple, C. D. Finch, K. A. Smith and F. B. Dunning, J. Chem. Phys., 1996, 104, 8485–8489 CrossRef CAS.
| This journal is © The Royal Society of Chemistry 2020 |

