 Open Access Article
Creative Commons Attribution 3.0 Unported Licence
Preparation of cobalt sulfide@reduced graphene oxide nanocomposites with outstanding electrochemical behavior for lithium-ion batteries†
Junhai
Wang
a,
Yongxing
Zhang
 *b,
Jun
Wang
c,
Lvlv
Gao
c,
Zinan
Jiang
c,
Haibo
Ren
c and
Jiarui
Huang
 *c
*c
aSchool of Material and Chemical Engineering, Chuzhou University, Chuzhou 239000, P. R. China
bAnhui Province Key Laboratory of Pollutant Sensitive Materials and Environmental Remediation, Huaibei Normal University, Huaibei 235000, P. R. China. E-mail: zyx07157@mail.ustc.edu.cn
cKey Laboratory of Functional Molecular Solids, Ministry of Education, Key Laboratory of Electrochemical Clean Energy of Anhui Higher Education Institutes, College of Chemistry and Materials Science, Anhui Normal University, Wuhu 241002, P. R. China. E-mail: jrhuang@mail.ahnu.edu.cn
First published on 2nd April 2020
Abstract
Cobalt sulfide@reduced graphene oxide composites were prepared through a simple solvothermal method. The cobalt sulfide@reduced graphene oxide composites are composed of cobalt sulfide nanoparticles uniformly attached on both sides of reduced graphene oxide. Some favorable electrochemical performances in specific capacity, cycling performance, and rate capability are achieved using the porous nanocomposites as an anode for lithium-ion batteries. In a half-cell, it exhibits a high specific capacity of 1253.9 mA h g−1 at 500 mA g−1 after 100 cycles. A full cell consists of the cobalt sulfide@reduced graphene oxide nanocomposite anode and a commercial LiCoO2 cathode, and is able to hold a high capacity of 574.7 mA h g−1 at 200 mA g−1 after 200 cycles. The reduced graphene oxide plays a key role in enhancing the electrical conductivity of the electrode materials; and it effectively prevents the cobalt sulfide nanoparticles from dropping off the electrode and buffers the volume variation during the discharge–charge process. The cobalt sulfide@reduced graphene oxide nanocomposites present great potential to be a promising anode material for lithium-ion batteries.
Introduction
Nowadays, lithium-ion batteries (LIBs), as convenient and effective devices for the storage and conversion of energy, have extended their practical application in alternative energy sources, and hybrid electric vehicles, as well as other electrical equipment.1–3 The electrode materials largely determine some key electrochemical properties including its power density and cyclic-life. The present commercial anode, graphite with a low theoretical capacity of 372 mA h g−1, greatly hinders the application fields of LIBs.4–6 Thus, the search for an anode with a high capacity, high rate capability and good cycling stability becomes urgent for the extensive applications of LIBs.Recently, various transition metal sulfides (MSx) such as FeSx,7 NiSx,8,9 MnSx,10 MoS2,11,12 SnS2,13 CuS,14,15 ZnS16 have been fabricated and served as anode materials for LIBs due to their high theoretical capacities, low cost and abundant raw materials. Cobalt sulfide (CoSx) has been considered as an alternative anode material because of its high theoretical specific capacity of 590 mA h g−1 and superior electrochemical performance.17 Unfortunately, the pure CoS anode suffers from the low rate capability and a poor cycling stability, which were caused by the low electric conductivity, huge-structural change, and easy pulverization of the CoS anode material.17–20 Therefore, the tremendous efforts have been paid to improving the conductivity of anode materials and the diffusion of lithium ions/electrons.
To address the above problems, many attentions have been paid to the design of the CoS-based composites with nanostructures. The nanostructured CoS composites with an improved structural stability and electronic conductivity could be fabricated by incorporation of the CoS nanoparticles (NPs) with various carbonaceous materials such as amorphous carbon,21 carbon nanotubes,22 carbon nanofibers.23 These days, graphene, one of the most sparking carbonaceous materials, has attracted widespread attention because of its superior physical and chemical merits such as huge specific surface area, exceptional electrical conductivity and structural stability.24–26 It is formed by the hybridization of sp2 carbon atom, shaped by the 2D single atom layer. The graphene has been thought as a desirable conductive substrate to incorporate the CoS NPs.27–29 For example, Tan et al. synthesized CoS nanofibers (NFs) anchored on reduced graphene oxide (rGO) via combination of hydrothermal with sulfidation process. The as prepared CoS NFs–rGO electrodes delivered the discharge a capacity of 939 mA h g−1 after the 100th cycle at 100 mA g−1 with coulombic efficiency above 98%.30 Zhu et al. prepared CoSx/rGO nanocomposite via a facile hydrothermal method with CoSx NPs uniformly embedded in rGO. When utilized in LIBs, the composite demonstrated a high discharge capacity of 796 mA h g−1 after 50 cycles at 100 mA g−1.31 Lu et al. reported Co1−xS hollow spheres formed by in situ growth on reduced graphene oxide layers. When evaluated as an anode material for LIBs, it delivers a specific capacity of 969.8 mA h g−1 with a high coulombic efficiency of 96.49% after 90 cycles at 50 mA g−1.32 Compared with the pure CoS anodes, improvements in the specific capacity, cycling life and rate performance were achieved. Nevertheless, most graphene-based nanocomposites were obtained through a simple hydrothermal method, mixing the reactant with graphene oxide in a Teflon-lined autoclave. The resulting active materials obtained by this method cannot fully anchor on the surface of the rGO and often fall off easily, leading to a poor electrochemical property.25,27,32,33 Furthermore, the loading amount of CoS on rGO would also greatly affect the Li-storage performances of the nanocomposites. To seek for the desirable electrochemical behaviors for LIBs, it is important to develop a CoS@rGO nanocomposite with various CoS loadings, in which all CoS could anchor on the surface of rGO densely and tightly.
In this study, CoS@rGO nanocomposites with a 3D nanostructure were synthesized through a simple hydrothermal method. The composites consist of numerous CoS NPs and the rGO. The functional groups on the surfaces of rGO capture the Co ions via an electrostatic reaction to form CoS NPs uniformly distributing on the surfaces of the rGO. Employed as an anode, the CoS@rGO nanocomposites show outstanding electrochemical behaviors for LIBs.
Experimental
All chemical reagents in this study were at the analytical level. The preparation of graphene oxide and 3D rGO is described in the ESI.†Preparation of CoS@rGO
Synthesis of CoS@rGO 0.8 g of CH3CSNH2 and various amount of CoCl2·6H2O (Sinopharm Chemical Reagent Co., Ltd) were dissolved in 14 mL of DMF/water mixture solvent (1![[thin space (1/6-em)]](https://www.rsc.org/images/entities/char_2009.gif) :
:![[thin space (1/6-em)]](https://www.rsc.org/images/entities/char_2009.gif) 1 v/v). The mixed precursor solution was stirred to form a transparent solution at room temperature using a magnetic stirrer. Then, a columnar rGO was soaked in the solution for 2 days. After that, the solution system was transferred into a Teflon-lined stainless steel autoclave and maintained at 200 °C for 24 h. When it cooled down to room temperature, the product was taken out and rinsed for several times with deionized water and absolute ethanol, respectively. At last, the product was vacuum-dried at 60 °C for 10 h. The amounts of CoCl2·6H2O for the preparation of CoS@rGO-1, CoS@rGO-2 and CoS@rGO-3 were 0.4, 0.5 and 0.6 g, respectively.
1 v/v). The mixed precursor solution was stirred to form a transparent solution at room temperature using a magnetic stirrer. Then, a columnar rGO was soaked in the solution for 2 days. After that, the solution system was transferred into a Teflon-lined stainless steel autoclave and maintained at 200 °C for 24 h. When it cooled down to room temperature, the product was taken out and rinsed for several times with deionized water and absolute ethanol, respectively. At last, the product was vacuum-dried at 60 °C for 10 h. The amounts of CoCl2·6H2O for the preparation of CoS@rGO-1, CoS@rGO-2 and CoS@rGO-3 were 0.4, 0.5 and 0.6 g, respectively.
Material characterizations
The as-prepared samples were characterized using X-ray diffraction (Shimadzu XRD-6000, high-intensity Cu Kα radiation with a characteristic wavelength of 1.54178 Å), transmission electron microscopy (TEM, Hitachi H-800, operated at acceleration voltage of 200 kV), field emission scanning electron microscopy (FE-SEM, Hitachi S-4800, operated at 5 kV) with energy dispersive spectroscopy (EDS), X-ray photoelectron spectroscopy (XPS) (ESCALAB 250), Brunauer–Emmett–Teller (BET) nitrogen adsorption–desorption (Nova 2000E), and Raman spectroscopy (Bruker-Senterra, wavelength 532 nm). A thermogravimetric analysis (Setaram Labsys Evo SDT Q600) was conducted to determine the rGO content of the composites.Electrochemical measurements
For a half-cell, the electrochemical tests of the as-prepared CoS@rGO nanocomposites were conducted in a CR2032 coin-kind cell using a polypropylene separator (Celgard 2400), and the lithium plate acted as a counter/reference electrode. The active materials mixed with a sodium carboxymethyl cellulose binder, styrene butadiene rubber, and carbon black (mass ratio of 7![[thin space (1/6-em)]](https://www.rsc.org/images/entities/char_2009.gif) :
:![[thin space (1/6-em)]](https://www.rsc.org/images/entities/char_2009.gif) 1.5
1.5![[thin space (1/6-em)]](https://www.rsc.org/images/entities/char_2009.gif) :
:![[thin space (1/6-em)]](https://www.rsc.org/images/entities/char_2009.gif) 0.5
0.5![[thin space (1/6-em)]](https://www.rsc.org/images/entities/char_2009.gif) :
:![[thin space (1/6-em)]](https://www.rsc.org/images/entities/char_2009.gif) 1) in water to form a slurry. The uniform slurry was then cast onto the surface of a copper foil and dried at 80 °C for 12 h. The electrolyte consisted of 1 M LiPF6 mixed with ethylene carbonate (EC) and diethyl carbonate (DEC), with a volume ratio of 1
1) in water to form a slurry. The uniform slurry was then cast onto the surface of a copper foil and dried at 80 °C for 12 h. The electrolyte consisted of 1 M LiPF6 mixed with ethylene carbonate (EC) and diethyl carbonate (DEC), with a volume ratio of 1![[thin space (1/6-em)]](https://www.rsc.org/images/entities/char_2009.gif) :
:![[thin space (1/6-em)]](https://www.rsc.org/images/entities/char_2009.gif) 1. The mass loading of the electrode and the active mass are ca. 1.08 and 0.76 mg, respectively. The assembly process of the cells was carried out in a glove box (Mikrouna, Super (1220/750/900)) filled with Ar gas, with oxygen and water concentrations below 0.1 ppm and 1 ppm, respectively. For a full-cell, a commercial LiCoO2 was used as the counter/reference electrode using a polypropylene separator (Celgard 2400). The commercial LiCoO2 mixed with a binder polyvinylidene fluoride (PVDF) and carbon black (mass ratio of 8
1. The mass loading of the electrode and the active mass are ca. 1.08 and 0.76 mg, respectively. The assembly process of the cells was carried out in a glove box (Mikrouna, Super (1220/750/900)) filled with Ar gas, with oxygen and water concentrations below 0.1 ppm and 1 ppm, respectively. For a full-cell, a commercial LiCoO2 was used as the counter/reference electrode using a polypropylene separator (Celgard 2400). The commercial LiCoO2 mixed with a binder polyvinylidene fluoride (PVDF) and carbon black (mass ratio of 8![[thin space (1/6-em)]](https://www.rsc.org/images/entities/char_2009.gif) :
:![[thin space (1/6-em)]](https://www.rsc.org/images/entities/char_2009.gif) 1
1![[thin space (1/6-em)]](https://www.rsc.org/images/entities/char_2009.gif) :
:![[thin space (1/6-em)]](https://www.rsc.org/images/entities/char_2009.gif) 1) in N-methyl-2-pyrrolidone (NMP) solvent to form a slurry. The uniform slurry was then cast onto the surface of an aluminum foil and dried at 80 °C for 12 h. The mass loading of the electrode and the active mass are ca. 10.01 and 8.01 mg, respectively. The ratio of cathode and anode active materials is ca. 10.54. For a half-cell, a Neware battery tester (Shenzhen Neware Technology Co., Ltd) with a voltage ranging from 0.01–3.0 V was used to monitor the discharge/charge behavior. For the full-cell, the voltage range was 1.5–3.9 V. An electrochemical workstation (CHI-660E, Shanghai Chenhua Instruments Co., Ltd) was used to record the cyclic voltammetry (CV) performance at a scanning rate of 0.1 mV s−1. The data of the electrochemical impedance spectrum (EIS) was obtained from 0.01 Hz to 100 kHz.
1) in N-methyl-2-pyrrolidone (NMP) solvent to form a slurry. The uniform slurry was then cast onto the surface of an aluminum foil and dried at 80 °C for 12 h. The mass loading of the electrode and the active mass are ca. 10.01 and 8.01 mg, respectively. The ratio of cathode and anode active materials is ca. 10.54. For a half-cell, a Neware battery tester (Shenzhen Neware Technology Co., Ltd) with a voltage ranging from 0.01–3.0 V was used to monitor the discharge/charge behavior. For the full-cell, the voltage range was 1.5–3.9 V. An electrochemical workstation (CHI-660E, Shanghai Chenhua Instruments Co., Ltd) was used to record the cyclic voltammetry (CV) performance at a scanning rate of 0.1 mV s−1. The data of the electrochemical impedance spectrum (EIS) was obtained from 0.01 Hz to 100 kHz.
Results and discussion
Structural and morphological characterization
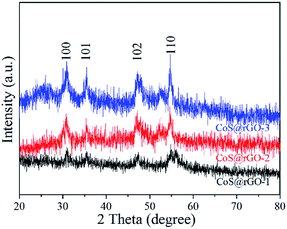
The crystal structure of the CoS@rGO samples were determined by XRD as shown in Fig. 1. Three XRD patterns all exhibit four typical diffraction peaks at around 30.8°, 35.3°, 47.1°, and 54.7°, which are ascribed to the (100), (101), (102) and (110) crystal planes of hexagonal CoS, respectively. The result is consistent with the standard card of CoS (JCPDS no. 75-0605). It should be noted that the peak of rGO at the location of 20–30° cannot be detected, in comparison with the XRD patterns of the 3D rGO made freshly, as exhibited in Fig. S1.† A possible reason can explain it that the agglomeration of the rGO can be effectively prevented due to CoS NPs closely anchored on the surface of the rGO.34,35 No other obvious diffraction peaks are found in Fig. 1, indicating that the composite has a high purity.The FE-SEM images of the samples (CoS@rGO-1, CoS@rGO-2 and CoS@rGO-3) are presented in Fig. 2. From the low-magnification images (Fig. 2a, c, and e) of the samples, a sheet-like structure can be seen, which consists of numerous crumpled rGO-based nanosheets. Compared to the SEM image of bare rGO (Fig. S2a†), the high magnification images (Fig. 2b, d, and f) demonstrate that there are a large number of nanoparticles on the surface of rGO. Further observation reveals that the amount of agglomerated nanoparticles anchored on the rGO nanosheets gradually increased with the increase of the CoS mass ratio.
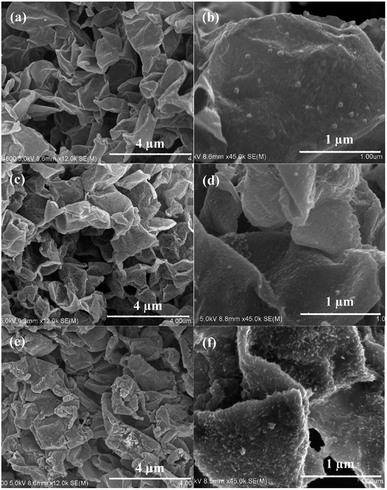 | ||
| Fig. 2 SEM images of (a and b) CoS@rGO-1, (c and d) CoS@rGO-2 and (e and f) CoS@rGO-3 nanocomposites. | ||
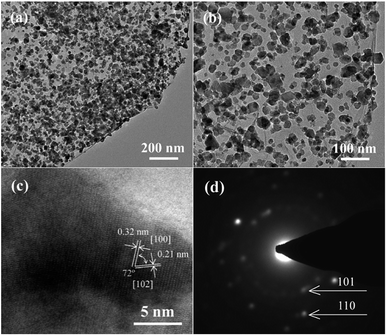
More detailed information on the morphology and structure of CoS@rGO-1 could be obtained using TEM and high-resolution TEM (HRTEM). The TEM images of the CoS@rGO-1 composite are presented in Fig. 3a and b. It can be seen that the sample possesses a wrinkled thin-sheet structure. Compared to the TEM image of bare rGO (Fig. S2b†), the high resolution TEM image (Fig. 3b) reveals that the rGO sheet was uniformly covered by a large number of CoS NPs, with sizes no larger than 50 nm. Lattices fringes are clearly observed in Fig. 3c, the HRTEM image. Two interplanar distances are 0.32 nm and 0.21 nm, which well correspond to the (100) and (102) lattice planes of hexagonal CoS, respectively. Fig. 3d displays the selected-area electron diffraction (SAED) pattern, from which two Debye–Scherrer rings are distinct and visible. And they conform to the (101) and (110) crystallographic directions of hexagonal CoS, which well correspond to the XRD results (Fig. 1).
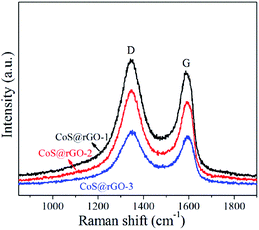
Raman spectroscopy was applied to investigate the structure of carbon materials in details. And Raman spectra of the CoS@rGO and GO samples are displayed in Fig. 4 and S3,† respectively. From the Raman spectra, two characteristic peaks are clearly discovered. They locate at ca. 1347 and 1588 cm−1, which can be respectively ascribed to the D and G bands of rGO. Furthermore, 2D and D + G peaks not shown here should locate at approximately 2694 and 2935 cm−1, respectively.36 The formation of the D and G bands results from the disorder and defects in the graphene layers, and sp2-bonded carbon atoms in the hexagonal lattice, respectively. For carbon-related materials, the intensity ratio (ID/IG) of the D and G bands represents the defects and degree of graphitization.37 ID/IG of the CoS@rGO-1, CoS@rGO-2, CoS@rGO-3, and GO are 1.12, 1.16, 1.22, and 0.917, respectively. This clearly indicates that most of the oxygen-containing functional groups on graphene oxide have been reduced in the CoS@rGO composites.36 Furthermore, the increase of the intensity ratio (ID/IG) may also be due to due to the widely separated rGO layers promoted by the intercalation of CoS NPs.38
XPS analysis was used to determine the valence state and elemental composition in the CoS@rGO nanocomposites. From the survey spectrum shown in Fig. 5a, the nanocomposite is comprised of the elements of Co, S and C, which is consistent with the results of the XRD and HRTEM. As shown in Fig. 5b, two peaks at 785.5 and 802.8 eV agree with satellite peaks of Co2+.39 The peaks at 778.5 and 793.7 eV are the Co 2p3/2 and 2p1/2 of cobalt sulfides.40 The binding energy at 780.6 and 796.3 eV are consistent with Co 2p3/2 and 2p1/2 with the splitting value over 15 eV demonstrating the coexistence of Co3+ and Co2+.41,42 The higher state of Co3+ would provide extra capacity for LIBs.43 The S 2p spectrum as shown in Fig. 5c can be deconvoluted into one peak at 169.4 eV typifying the oxidized-S, two peak at 164.8 and 163.0 eV corresponding to S–C bond and one peak at 161.8 eV indicating CoS.32,44–47 In addition, Fig. 5d exhibits the high-resolution C 1s spectra of the nanocomposites. The strong peak at 284.6 eV is originated from the C–C/C![[double bond, length as m-dash]](https://www.rsc.org/images/entities/char_e001.gif) C bonds. Also, two weak peaks at 288.5 eV and 286.3 eV are detected, coming from the O–C
C bonds. Also, two weak peaks at 288.5 eV and 286.3 eV are detected, coming from the O–C![[double bond, length as m-dash]](https://www.rsc.org/images/entities/char_e001.gif) O and C–O/C–S bonds, respectively.48 Obviously, the intensity of the C–C/C
O and C–O/C–S bonds, respectively.48 Obviously, the intensity of the C–C/C![[double bond, length as m-dash]](https://www.rsc.org/images/entities/char_e001.gif) C bonds are much stronger than that of O–C
C bonds are much stronger than that of O–C![[double bond, length as m-dash]](https://www.rsc.org/images/entities/char_e001.gif) O and C–O/C–S bonds. This result proves that the overwhelming majority of GO were reduced and transformed into the rGO via the hydrothermal process. The presence of C–S bond further confirms the formation of tight bonding between the C atoms and S atoms, which demonstrates that the CoS particles tightly attached on the surface of the rGO.25
O and C–O/C–S bonds. This result proves that the overwhelming majority of GO were reduced and transformed into the rGO via the hydrothermal process. The presence of C–S bond further confirms the formation of tight bonding between the C atoms and S atoms, which demonstrates that the CoS particles tightly attached on the surface of the rGO.25
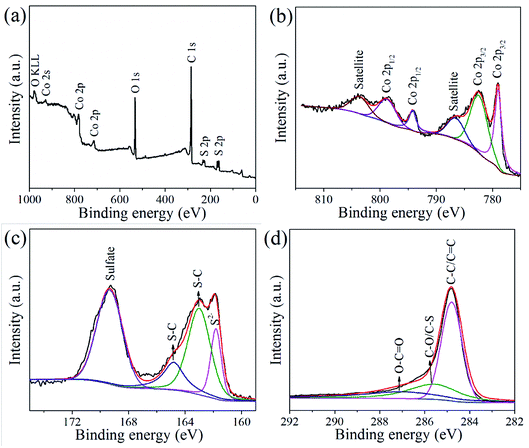 | ||
| Fig. 5 XPS spectra of CoS@rGO-2 sample: (a) survey spectrum, (b) Co 2p spectrum, (c) S 2p spectrum, and (d) C 1s spectrum. | ||
The content of rGO in the CoS@rGO nanocomposite was calculated based on the TGA results, which were performed at the temperature range of room temperature to 650 °C in air, as shown in Fig. S4 (see ESI for detail).† It can be seen that the weight of the composite decreases with the increase of temperature. A slight decrease in the weight occurred before 290 °C, which may be due to the release of a volatile gas and water. The second weight loss observed from 290 to 410 °C is ascribed to the combustion of rGO.49 The third weight loss from 410 to 650 °C is mainly due to the decomposition by oxidation of CoS into Co3O4.50 As we know that the TGA data cannot be so clearly separated to rGO and CoS formation. The carbon contents within the CoS@rGO-1, CoS@rGO-2 and CoS@rGO-3 samples are approximately 4.5 ± 0.3 wt%, 3.6 ± 0.2 wt% and 3.1 ± 0.2 wt%, respectively.
For the investigation of the porosity texture of the CoS@rGO nanocomposites, the nitrogen adsorption–desorption isotherms and pore size distributions (inset) were performed in Fig. S5.† A hysteresis loop appears in the isotherms of three samples. This strongly indicates some mesopores existing in the nanocomposites. The specific surface areas were calculated as 57.6, 34.4 and 18.3 m2 g−1 for the CoS@rGO-1, CoS@rGO-2 and CoS@rGO-3 samples, respectively, in terms of a Brunauer–Emmett–Teller (BET) model. Obviously, the specific surface area of the samples slightly decreases as the load of the CoS NPs increases. The insets of the figures show the distributions of the pore sizes ranging from 1 to 22 nm. The pore sizes for the CoS@rGO-1, CoS@rGO-2 and CoS@rGO-3 respectively average 2.4, 2.1 and 1.9 nm. The as prepared CoS@rGO nanocomposites with high specific surface area and sandwich structure would present some exceptional performances in the application of LIBs.
Electrochemical properties
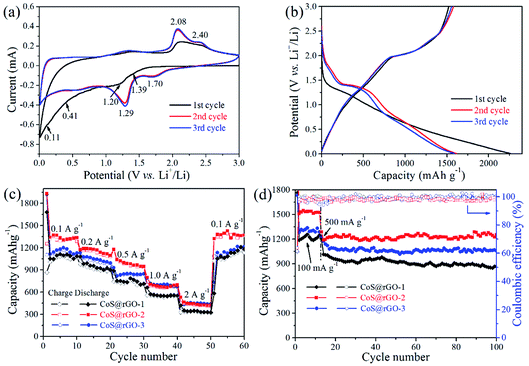
The electrochemical properties of the electrodes were studied using cyclic voltammograms (CV) tests. Fig. 6a shows the initial three CV curves of the CoS@rGO-2 nanocomposite anode. In the first cycle, a slight peak at ∼1.39 V can be assigned to the Li insertion reaction: CoS + xLi+ + xe− → LixCoS.19,33,51 Another slight peak at ∼1.20 V corresponds to the reduction reaction: (2 − x)Li+ + LixCoS + (2 − x)e− → Co + Li2S.19,33,51 In the next two cycles, two peaks positively shift to ∼1.70 V and ∼1.29 V, respectively. The weak broad peak at ca. 0.41 V is assigned to the formation of the solid electrolyte interface (SEI) film which disappear in the following two cycles. The prominent peak at ∼0.11 V is attributed to the insertion of lithium into the rGO nanosheets and the lattice of carbon: yC + xLi+ + xe− → LixCy.52,53 In the anodic process, two apparent peaks at ∼2.08 and ∼2.40 V can be identified as the reverse reaction to form LixCoS and CoS, respectively. The CV curves are overlapped well in the second and third cycles indicating the good electrochemical reversibility of the electrode.The discharge and charge profiles the CoS@rGO-2 nanocomposites are shown in Fig. 6b. The discharge profiles reveal a plateau at ∼1.26 V in the first cycle, which elevates to ∼1.41 V in the following cycles. (The plateau at ∼0.45 V is not apparent corresponding to the unapparent peak of SEI film formation.33 The obvious plateau at ∼0.12 V is ascribed to the lithium ion insertion of carbon.) In the charge process, two plateaus at ∼2.0 and ∼2.4 V are consistent with the anodic peaks in CV curves. In the first discharge and charge curves, the CoS@rGO-2 composite delivers specific capacities of 2262.0 and 1521.9 mA h g−1, respectively. And the coulombic efficiency is calculated as 67.3%, which mainly due to the SEI layer formed on the surface of the electrode. Besides, in the first lithiation process, some lithium ions were consumed because of the defects in the nanocomposite.54 In the second and third cycles, the specific discharge capacities of the CoS@rGO-2 composites declined to 1613.4 and 1589.2 mA h g−1, respectively. The coulombic efficiency of the second cycle increased to 97.8%, and it maintained ca. 97.9% in the third cycle, proving the good electrochemical cycling reversibility.
The rate performance of the CoS@rGO-1, CoS@rGO-2, CoS@rGO-3 were presented in Fig. 6c. The CoS@rGO-2 electrode obviously showed the best rate capability among these electrode materials and had reversible specific capacities of 1435.8, 1244.9, 1109.3, and 892.1 mA h g−1 at the current densities of 0.1, 0.2, 0.5, and 1.0 A g−1, respectively. The CoS@rGO-2 electrode delivered a high capacity of 668.5 mA h g−1 even at 2.0 A g−1. For the CoS@rGO-1, CoS@rGO-2 and CoS@rGO-3 electrodes, the specific capacities could respectively reach to 1305.8, 1462.6 and 1335.1 mA h g−1, when the current density returns to 0.1 A g−1. Furthermore, the CoS@rGO nanocomposite electrodes present a much better rate capacity than those of cobalt sulfide-based composites such as CoS NFs–rGO,30 CoSx/rGO nanocomposite31 and Co1−xS hollow spheres/rGO.32
The cycling performance of the CoS@rGO composites was investigated when a high current density was set as 0.5 A g−1. Observed from Fig. 6d, after 100 cycles, the nanocomposites of the CoS@rGO-1, CoS@rGO-2 and CoS@rGO-3 electrodes still hold corresponding specific capacities of 868.1, 1253.9 and 1056.6 mA h g−1 with the coulombic efficiency of 99.2%, 98.9% and 99.9%, respectively. The theoretical capacity of CoS@rGO-2 can be calculated to be ∼596.6 mA h g−1 (CoS contribution (capacityCoS = 590 × 96.4%) + rGO contribution (capacityrGO = 774 × 3.6%)). The capacity of the CoS@rGO-2 electrode is much higher than the theoretical value, which may be attributed to an excellent synergistic effect between CoS NPs and rGO.48 In comparison with the CoS-based electrodes recent reported, the CoS@rGO nanocomposite electrodes exhibit superior electrochemical performance than those of CoS NPs,18 lantern-like CoS,55 CoS/CNTs hybrid,22 CoS nanosheets/rGO foams,25 cobalt sulfides/rGO composite,27,28 CoS NFs–rGO,30 CoSx/rGO nanocomposite,31 Co1−xS hollow spheres/rGO,32 CoS2/rGO composites,38 and other CoS/rGO composites,33,56,57 which have been listed in Table S1 (ESI).† The superior electrochemical properties of CoS@rGO can be well-explained by two aspects: (i) rGO sheets can mitigate the volume variation of the CoS NPs during the lithium reaction; (ii) layered nanoarchitecture facilitates the electrolyte access, as well as enlarges the contact area between the CoS@rGO nanocomposites and the electrolyte, resulting in improved transport kinetics of the lithium ions. Therefore, the as-prepared nanocomposites can be potentially considered as a suitable electrode material in the future application of lithium-ion battery. Notably, the CoS@rGO-2 electrode exhibits the highest discharge capacity (1253.9 mA h g−1) among three nanocomposite electrodes after 100 cycles. And the suitable loading of active materials (CoS NPs) in the nanocomposites could account for the highest discharge capacity of the CoS@rGO-2 electrode. Since the theory capacity of CoS is higher than that of the rGO, the capacity of the CoS@rGO increases with the increase of the amount of the CoS within the composites. As a result, the specific capacity of the CoS@rGO-2 is higher than that of CoS@rGO-1. However, when there are too many CoS NPs anchored on the rGO, they could easily detached from rGO during the charge–discharge process, resulting a poor capacity.58 The detachment of the CoS NPs from the rGO can be observed from the SEM and TEM images (Fig. S7†) of the CoS@rGO-3 electrode after 100 cycles at 0.5 A g−1. Therefore, the specific capacity of the CoS@rGO-3 is lower than that of CoS@rGO-2.
The Nyquist plots of the CoS@rGO nanocomposite electrodes before cycling test and after 100 cycles were presented in Fig. 7. The experimental data was fitted by an equivalent circuit, as exhibited in Fig. 7a (inset). In this model, the internal resistance of the battery was denoted by Rs. The resistance and constant phase element for the SEI film can be respectively expressed by Rf and CPE1. And for electrode/electrolyte interface, the charge-transfer resistance and constant phase element can be represented by Rct and CPE2, respectively. In addition, the Warburg impedance produced in the process of the lithium-diffusion can be referred as Wo.59 The Rct of the CoS@rGO-1, CoS@rGO-2 and CoS@rGO-3 electrodes before cycling test are 80.7, 56.6 and 61.3 Ω, respectively, which can be revealed by the fitting results. After 100 cycles, Rct of these electrodes respectively decreases to 53.0, 20.1 and 40.5 Ω. This may be due to the obvious pulverization of CoS NPs on the surface of rGO during the cycling process. The pulverization of CoS NPs can be observed from the TEM image (Fig. 8b) of the CoS@rGO-2 electrode after 100 cycles at 0.5 A g−1. Among these CoS@rGO nanocomposite electrodes before cycling test and after 100 cycles, the Rct of CoS@rGO-2 electrode is the smallest, for CoS NPs anchored on the rGO in the composites contribute to the small Rct value. Moreover, the Rct of the CoS@rGO-3 electrode is higher than that of the CoS@rGO-2 electrode, which may be due to the slight detachment of active material CoS from the surface of rGO. The slight detachment of the CoS NPs marked with an arrow can be observed from the SEM image (Fig. 8a) of the CoS@rGO-2 electrode after 100 cycles at 0.5 A g−1. The straight line in the low-frequency region is associated with Warburg behaviour where the lithium-ion diffusion occurs in the nanostructure. This clearly indicates that the unique porous structure is quite advantageous for improving the speed of charge transfer at the interface, and reducing the overall resistance of the battery, thus leading to excellent electrochemical performances.
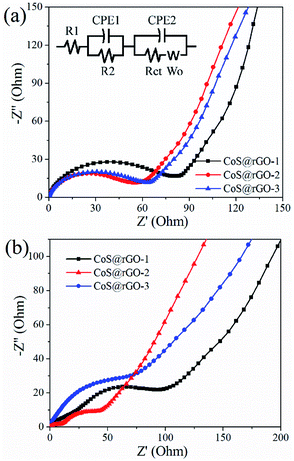 | ||
| Fig. 7 EIS impedance spectra of CoS@rGO electrodes (a) before cycling test and (b) after 100 cycles. Inset is the equivalent electrical circuit model. | ||
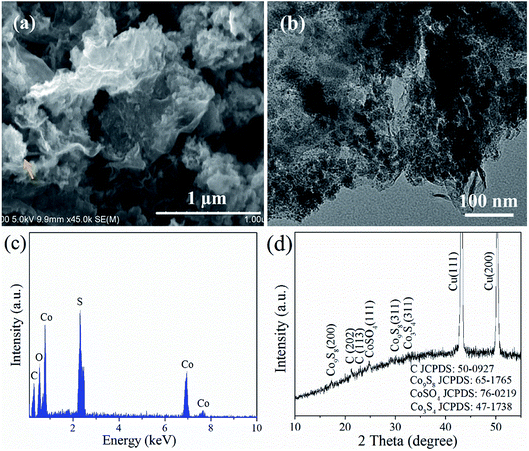 | ||
| Fig. 8 (a) SEM image, (b) TEM image, (c) EDS, and (d) XRD pattern of CoS@rGO-2 electrode after 100 cycles at a current density of 500 mA g−1. | ||
The morphology and composition of the CoS@rGO nanocomposites were investigated by SEM, TEM, EDS, and XRD after the composite electrode was tested at 0.5 A g−1 for 10 or 100 cycles. Fig. S8† shows the TEM image of the composites after 10 cycles. It can be found that the CoS NPs still anchor on the surface of rGO and most NPs have no obvious change in size. Fig. 8a and b show the SEM and TEM images of the composites after 100 cycles. The rGO still maintains its original nanosheet-like morphology, and the vast majority of ultra-small NPs are uniformly attached on the rGO. It can be concluded that the CoS NPs become small after 100 cycles, and most of them still firmly anchor on the surface of the rGO, demonstrating the outstanding stability of the nanocomposites. In addition, the presence of the rGO facilitates the good distribution of the ultra-small NPs during the cycling process. The EDS analysis shown in Fig. 8c indicates that the composites still consist of the original elements of Co, S and C after cycling. Fig. 8d presents the XRD pattern of the composites after 100 cycles and indicates the presence of cubic Co3S4, cubic Co9S8, orthorhombic CoSO4, and rhombohedral carbon in the final electrode material. This is consistent with the result of the EDS analysis after cycling. Moreover, Fig. S6† shows the XPS spectra of the nanocomposite electrode after 100 cycles at 0.1 A g−1. This clearly shows the presence of Co, S and C in the composites after 100 cycles. A small part of S has been oxidized to some higher valence states, and after the cycles, the composite consists of S2−, S22−, SO32−, and SO42−.
A full cell consists of commercial LiCoO2 and the CoS@rGO-2 nanocomposites which respectively serve as a cathode and an anode. The capacity of the LiCoO2 was 1.2 times than that of the anode in design. When a current density and potential range was respectively set as 0.2 A g−1 and 1.5–3.9 V, the charge/discharge profiles were presented in Fig. 9a based on the CoS@rGO-2 nanocomposites as an anode. During the cycling process, charge/discharge plateaus were obviously observed at the potential range of 2.3–2.8 V and 1.6–1.8 V caused by the reversible redox reactions. The initial discharge and charge capacities calculated based on the quality of the anode materials were respectively calculated as 1791.6 and 899.6 mA h g−1, and the coulombic efficiency is ∼50.2%. The formation of SEI layer on the surfaces of the electrodes may account for the major loss in capacity. In the second and third cycles, the coulombic efficiency was up to 97.1% and 97.5%, respectively. This suggests that there is efficient electron transport as well as smooth insertion and extraction of Li+. Moreover, the cycling performance of the full battery was exhibited in Fig. 9b. A capacity maintained 574.7 mA h g−1 at 0.2 A g−1 when the battery cycled 200 times, which indicates outstanding cycling stability for the full battery.
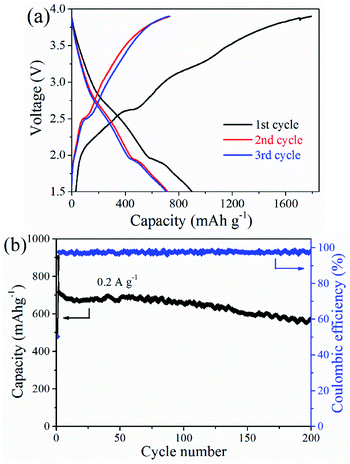 | ||
| Fig. 9 (a) Galvanostatic charge–discharge voltage profiles and (b) cycling performance of CoS@rGO-2 sample full-cell at a current density of 200 mA g−1. | ||
Conclusions
The CoS@rGO nanocomposites were synthesized through a facile solvothermal method. Some favorable electrochemical performances in specific capacity, cycling performance and rate capability are achieved when the nanocomposites were used as anode materials for LIBs. For a half-cell, the CoS@rGO-2 nanocomposite anode exhibited a capacity of 1253.9 mA h g−1 at 500 mA g−1 after 100 cycles. For a full-cell, the CoS@rGO-2 nanocomposite anode exhibited a capacity of 574.7 mA h g−1 at 200 mA g−1 after 200 cycles. In addition, in contrast to other CoS-based composite anodes reported, the as prepared nanocomposite anodes present the superior rate performance. And the CoS@rGO-2 nanocomposite delivers specific capacities of 892.1 and 668.5 mA h g−1, at respective 1000 mA g−1 and 2000 mA g−1. The unique nanostructure of the electrode materials accounts for the superior electrochemical behaviors. Furthermore, the rGO embedded in the nanocomposites can effectively buffer the volume variation, mitigate the aggregation of CoS particles, and prevent the CoS particles from dropping off the electrode during the cycling process. These notable electrochemical characteristics indicate promise of the nanocomposites as anode materials in LIBs.Conflicts of interest
There are no conflicts to declare.Acknowledgements
Natural Science Research Project for Universities in Anhui Province (KJ2018B14), Science and Technology Major Project of Anhui Province (18030901093), Key Research and Development Program of Wuhu (2019YF07).References
- L. L. Liu, S. J. Gu, S. L. Wang, X. Y. Zhang and S. M. Chen, RSC Adv., 2020, 10, 1704 RSC.
- B. Huang, Z. F. Pan, X. Y. Su and L. An, J. Power Sources, 2018, 399, 274 CrossRef CAS.
- Q. S. Wang, L. H. Jiang, Y. Yu and J. H. Sun, Nano Energy, 2019, 55, 93 CrossRef CAS.
- Y. Gao, X. T. Qiu, X. L. Wang, X. C. Chen, A. Q. Gu and Z. L. Yu, Nanotechnology, 2020, 31, 15 Search PubMed.
- X. Ao, H. Y. Sun, C. D. Wang, J. G. Li, Y. J. Ruan, B. Z. Li, Q. H. Wu, Y. Li, J. J. Jiang, Y. G. Yang and L. Q. Mai, Carbon, 2018, 130, 599 CrossRef CAS.
- R. Z. Li, J. F. Huang, J. W. Ren, L. Y. Cao, J. Y. Li, B. Li, G. X. Lu and A. M. Yu, J. Alloys Compd., 2020, 818, 25 Search PubMed.
- S. H. Qi, B. L. Xu, V. T. Tiong, J. Hu and J. M. Ma, Chem. Eng. J., 2020, 379, 1 CrossRef.
- Q. D. Li, L. Li, P. J. Wu, N. Xu, L. Wang, M. Li, A. Dai, K. Amine, L. Q. Mai and J. Lu, Adv. Energy Mater., 2019, 9, 1901153 CrossRef CAS.
- X. Dong, Z. P. Deng, L. H. Huo, X. F. Zhang and S. Gao, J. Alloys Compd., 2019, 788, 984 CrossRef CAS.
- R.-A. P. Camacho, A.-M. Wu, X.-Z. Jin, X.-F. Dong, X.-N. Li and H. Huang, J. Power Sources, 2019, 437, 15 Search PubMed.
- G. Zhao, Y. L. Cheng, P. X. Sun, W. X. Ma, S. H. Hao, X. K. Wang, X. J. Xu, Q. Q. Xu and M. Q. Liu, Electrochim. Acta, 2020, 331, 20 Search PubMed.
- J. X. Wu, F. Ciucci and J.-K. Kim, Chem.–Eur. J., 2020, 26, 1 CrossRef.
- H. Wen, W. B. Kang, X. G. Liu, W. J. Li, L. P. Zhang and C. H. Zhang, RSC Adv., 2019, 9, 41 Search PubMed.
- X. D. Ding, S. Lei, C. F. Du, Z. L. Xie, J. R. Li and X. Y. Huang, Adv. Mater. Interfaces, 2019, 6, 22 Search PubMed.
- J. S. Nam, J. H. Lee, S. M. Hwang and Y. J. Kim, J. Mater. Chem. A, 2019, 7, 11699 RSC.
- Z. C. Xu, Z. Q. Zhang, M. Y. Li, H. L. Yin, H. T. Lin, J. Zhou and S. P. Zhuo, J. Solid State Electrochem., 2019, 23, 3419 CrossRef CAS.
- J. Wu, W. M. Lau and D. S. Geng, Rare Met., 2017, 36, 307 CrossRef CAS.
- Y. M. Wang, J. J. Wu, Y. F. Tang, X. J. Lu, C. Y. Yang, M. S. Qin, F. Q. Huang, X. Li and X. Zhang, ACS Appl. Mater. Interfaces, 2012, 4, 4246 CrossRef CAS PubMed.
- Q. H. Wang, L. F. Jiao, H. M. Du, W. X. Peng, Y. Han, D. W. Song, Y. C. Si, Y. J. Wang and H. T. Yuan, J. Mater. Chem., 2011, 21, 327 RSC.
- R. C. Jin, L. X. Yang, G. H. Li and G. Chen, J. Mater. Chem. A, 2015, 3, 10677 RSC.
- J. H. Kim, J.-H. Lee and Y. C. Kang, Electrochim. Acta, 2014, 137, 336 CrossRef CAS.
- H. J. Wang, J. J. Ma, S. Liu, L. Y. Nie, Y. Q. Chai, X. Yang and R. Yuan, J. Alloys Compd., 2016, 676, 551 CrossRef CAS.
- F. Luo, D. T. Ma, Y. L. Li, H. W. Mi, P. X. Zhang and S. Luo, Electrochim. Acta, 2019, 299, 173 CrossRef CAS.
- G. J. Li, X. Y. Mo, W.-C. Law and K. C. Chan, ACS Appl. Mater. Interfaces, 2019, 11, 238 CrossRef CAS PubMed.
- Y. F. Yao, Y. H. Zhu, J. F. Huang, J. H. Shen and C. Z. Li, Electrochim. Acta, 2018, 271, 242 CrossRef CAS.
- C. Gao, C. Z. Fang, H. M. Zhao, J. Y. Yang, Z. D. Gu, W. Sun, W. N. Zhang, S. Li, L. C. Xu, X. Y. Li and F. W. Huo, J. Power Sources, 2019, 421, 132 CrossRef CAS.
- G. C. Huang, T. Chen, Z. Wang, K. Chang and W. X. Chen, J. Power Sources, 2013, 235, 122 CrossRef CAS.
- Z. P. Li, W. Y. Li, H. T. Xue, W. P. Kang, X. Yang, M. L. Sun, Y. B. Tang and C.-S. Lee, RSC Adv., 2014, 4, 37180 RSC.
- Q. Zhou, L. Liu, G. X. Guo, Z. C. Yan, J. L. Tan, Z. F. Huang, X. Y. Chen and X. Y. Wang, RSC Adv., 2015, 5, 71644 RSC.
- Y. B. Tan, M. Liang, P. L. Lou, Z. H. Cui, X. X. Guo, W. W. Sun and X. B. Yu, ACS Appl. Mater. Interfaces, 2016, 8, 14488 CrossRef CAS PubMed.
- J. S. Zhu and X. B. Ding, Mater. Lett., 2019, 253, 22 CrossRef CAS.
- S.-J. Lu, Z.-T. Wang, X.-H. Zhang, Z.-J. He, H. Tong, Y.-J. Li and J.-C. Zheng, ACS Appl. Mater. Interfaces, 2020, 12, 2671 CrossRef CAS PubMed.
- S. F. Kong, Z. T. Jin, H. Liu and Y. Wang, J. Phys. Chem. C, 2014, 118, 25355 CrossRef CAS.
- X. Y. Pei, D. C. Mo, S. S. Lyu, J. H. Zhang and Y. X. Fu, Appl. Surf. Sci., 2019, 465, 470 CrossRef CAS.
- X. Y. Sui, X. K. Huang, Y. P. Wu, R. Ren, H. H. Pu, J. B. Chang, G. H. Zhou, S. Mao and J. H. Chen, ACS Appl. Mater. Interfaces, 2018, 10, 26170 CrossRef CAS PubMed.
- G. J. Li, X. Y. Mo, W.-C. Law and K. C. Chan, J. Mater. Chem. A, 2019, 7, 4055 RSC.
- Y. H. Ma, Y. K. Li, D. Li, Y. S. Liu and J. M. Zhang, J. Alloys Compd., 2019, 771, 885 CrossRef CAS.
- J. R. He, Y. F. Chen, P. J. Li, F. Fu, Z. G. Wang and W. L. Zhang, Electrochim. Acta, 2015, 182, 424 CrossRef CAS.
- X. Z. Wang, Y. H. Xiao, D. C. Su, L. M. Zhou, S. D. Wu, L. F. Han, S. M. Fang and S. K. Cao, Electrochim. Acta, 2016, 194, 377 CrossRef CAS.
- Y. P. Wang, T. Zhu, Y. F. Zhang, X. Z. Kong, S. Q. Liang, G. Z. Cao and A. Q. Pan, J. Mater. Chem. A, 2017, 5, 18448 RSC.
- G. Q. Wang, J. Zhang, S. Kuang, S. M. Liu and S. P. Zhuo, J. Power Sources, 2014, 269, 473 CrossRef CAS.
- Q. F. Wang, X. Liang, D. P. Yang and D. H. Zhang, RSC Adv., 2017, 7, 29933 RSC.
- Y. F. Yao, Y. H. Zhu, J. H. Shen, X. L. Yang and C. Z. Li, Electrochim. Acta, 2016, 222, 1300 CrossRef CAS.
- S. J. Patil, J. H. Kim and D. W. Lee, J. Power Sources, 2017, 342, 652 CrossRef CAS.
- Q. Q. Shi, F. Peng, S. X. Liao, H. J. Wang, H. Yu, Z. W. Liu, B. S. Zhang and D. S. Su, J. Mater. Chem. A, 2013, 1, 14853 RSC.
- X. H. Qiao, J. T. Jin, H. B. Fan, Y. W. Li and S. J. Liao, J. Mater. Chem. A, 2017, 5, 12354 RSC.
- Y. C. Ge, J. J. Wu, X. W. Xu, M. G. Ye and J. F. Shen, Int. J. Hydrogen Energy, 2016, 41, 19847 CrossRef CAS.
- J. R. Huang, W. Wang, X. R. Lin, C. P. Gu and J. Y. Liu, J. Power Sources, 2018, 378, 677 CrossRef CAS.
- H. B. Ren, W. Wang, S. W. Joo, Y. F. Sun and C. P. Gu, Mater. Res. Bull., 2019, 111, 34 CrossRef CAS.
- Q. Zhou, L. Liu, G. X. Guo, Z. C. Yan, J. L. Tan, Z. F. Huang, X. Y. Chen and X. Y. Wang, RSC Adv., 2015, 5, 71644 RSC.
- Z. Yang, J. Wang, H.-T. Wu, F.-J. Kong, W.-Y. Yin, H.-J. Cheng, X.-Y. Tang, B. Qian, S. Tao, J. Yi, Y.-S. Ma and R.-X. Yuan, Appl. Surf. Sci., 2019, 479, 693 CrossRef CAS.
- L. H. Zhuo, Y. Q. Wu, L. Y. Wang, Y. C. Yu, X. B. Zhang and F. Y. Zhao, RSC Adv., 2012, 2, 5084 RSC.
- M. Endo, C. Kim, K. Nishimura, T. Fujino and K. Miyashita, Carbon, 2000, 38, 183 CrossRef CAS.
- Y. Y. Zheng, Y. W. Li, J. H. Yao, Y. Huang and S. H. Xiao, Ceram. Int., 2018, 44, 2568 CrossRef CAS.
- W. J. Lin, Y. H. Huang and G. Q. He, Crystengcomm, 2018, 20, 6727 RSC.
- Y. Gu, Y. Xu and Y. Wang, ACS Appl. Mater. Interfaces, 2013, 5, 801 CrossRef CAS PubMed.
- J. Zhu, M. H. Jin and S. Tang, J. Nanosci. Nanotechnol., 2019, 19, 5921 CrossRef CAS PubMed.
- L. L. Gao, C. P. Gu, H. B. Ren, X. J. Song and J. R. Huang, Electrochim. Acta, 2018, 290, 72 CrossRef CAS.
- J. J. Zhao, H. B. Ren, C. P. Gu, W. M. Guan, X. J. Song and J. R. Huang, J. Alloys Compd., 2019, 781, 174 CrossRef CAS.
Footnote |
| † Electronic supplementary information (ESI) available. See DOI: 10.1039/d0ra01351j |
| This journal is © The Royal Society of Chemistry 2020 |

