 Open Access Article
Creative Commons Attribution 3.0 Unported Licence
Unimolecular decomposition rates of a methyl-substituted Criegee intermediate syn-CH3CHOO†
Yu-Lin Liab,
Mei-Tsan Kuo a and
Jim Jr-Min Lin
 *ab
*ab
aInstitute of Atomic and Molecular Sciences, Academia Sinica, Taipei 10617, Taiwan. E-mail: jimlin@gate.sinica.edu.tw
bDepartment of Chemistry, National Taiwan University, Taipei 10617, Taiwan
First published on 28th February 2020
Abstract
Criegee intermediates play important roles in atmospheric chemistry. Methyl Criegee intermediate, CH3CHOO, has two conformers, syn- and anti-conformers. Syn-CH3CHOO would undergo fast unimolecular decomposition to form OH radical via 1,4 H-atom transfer. In this work, unimolecular decomposition of syn-CH3CHOO was probed in real time with UV absorption spectroscopy at 278–318 K and 100–700 torr. We used water vapor as the scavenger of anti-CH3CHOO to distinguish the absorption signals of the two conformers. After removing the contributions from reactions with radical byproducts, reaction with water vapor and wall loss, we obtained the unimolecular reaction rate coefficient of syn-CH3CHOO (at 300 torr), which increases from (67 ± 15) s−1 at 278 K, (146 ± 31) s−1 at 298 K, to (288 ± 81) s−1 at 318 K with an Arrhenius activation energy of ca. 6.4 kcal mol−1 and a weak pressure dependence for 100–700 torr. Compared to previous studies, this work provides temperature dependent unimolecular rates of syn-CH3CHOO at higher pressures, which are more relevant to atmospheric conditions.
Introduction
Criegee intermediates are very reactive carbonyl oxides formed in the reactions of ozone with alkenes (ozonolysis) and play important roles in atmospheric chemistry, including oxidation of water, SO2, NOx, etc. In particular, the decomposition of Criegee intermediates can be a significant source of OH radicals in the troposphere, especially during nighttime and winter.1After the breakthrough of the efficient preparation of Criegee intermediates in 2012,2 the physical and chemical properties of simple Criegee intermediates have been widely investigated.3,4 Nowadays, it has been established that the reactivity of Criegee intermediates is highly structure-dependent.4–6 For example, CH2OO and anti-CH3CHOO react with water vapor very quickly but syn-CH3CHOO and (CH3)2COO react with water vapor much slower. On the other hand, syn-CH3CHOO and (CH3)2COO may undergo intramolecular H-atom transfer from the methyl group to the terminal oxygen atom, resulting in OH production.7,8
However, there have been large discrepancies in the unimolecular (also bimolecular and termolecular) reaction rates of Criegee intermediates. If we focus on the unimolecular rate coefficients of syn-CH3CHOO reported after 2012, the reported experimental value9–12 at 298 K ranges from 3 to 300 s−1 whilst the reported theoretical value13–15 is from 24 to 330 s−1.1 Unimolecular rates may control the steady-state concentrations and thus the impact of such a Criegee intermediate in the atmosphere. It is important to have reliable experimental data at atmospherically relevant pressure and temperature.
Lester and coworkers excited syn-CH3CHOO, syn-C2H5CHOO and (CH3)2COO to a high vibrational energy via infrared laser and monitored the OH production by laser-induced fluorescence. The OH formation rates have been measured at specific vibrational energies. Master equation modeling based on these microcanonical rates and high-level quantum chemistry calculations has been used to estimate the thermal decay rate coefficients at 298 K to be 166/122 s−1 for syn-CH3CHOO,14,16 279, and 276 s−1 for syn-C2H5CHOO17 and (CH3)2COO,14 respectively.18 The fast rates indicate thermal decomposition is the main sink for these Criegee intermediates in the atmosphere.
Zhou et al. have monitored the OH products of syn-CH3CHOO in a flow cell. The thermal decomposition rate at 298 K (25 to 100 torr) is reported to be 182 ± 66 s−1.19 Their results also support that the thermal decomposition is the main atmospheric process for syn-CH3CHOO.
In this work, we used water vapor to scavenge anti-CH3CHOO20 and directly monitored the kinetics of syn-CH3CHOO via its strong UV absorption in real time.21 The unimolecular rates were determined at atmospherically relevant temperatures and pressures. The results are compared with previous experimental and theoretical works.
Experimental method
Following previous studies, we used CH3CHI2 (Aldrich, ≥98%) as the precursor and generated CH3CHI radicals by applying photolysis laser (Excimer laser, KrF 248 nm, Coherent COMPexPro 205F). Under high [O2] (10 torr), the iodo-radicals would react with O2 rapidly to form CH3CHOO.12 The photolysis laser beam was coupled into the reactor by a long-pass filter (275 nm, Eksma Optics, customized). After passing through the reactor, the photolysis beam was reflected out by another long-pass filter, and the laser pulse energy was monitored with an energy meter (Gentec QE25SP-H-MB-D0). Continuous UV probe beam originated from a broadband Xe lamp (Energetiq, EQ-99) went through the reactor six times. The probe beam overlapped collinearly with the photolysis beam, resulting in an effective absorption path length of ca. 426 cm.The probe wavelength was selected by a band-pass filter (340 nm, 10 nm bandwidth, OD4, Edmund #65129). The time-dependent absorption change was detected with a balanced photodiode detector (Thorlab PDB450A) and recorded in real time with a high-definition oscilloscope (LeCroy HDO4034, 4096 vertical resolution). All time traces were averaged for ca. 120 laser shots to increase S/N ratio. We found a small absorption change even without adding the precursor, which was caused by the photolysis laser and the long-pass filters. This background could be subtracted by recording background traces before and after each experimental set. All reported time traces have undergone background subtraction.
CH3CHI2 vapor was carried by a stream of N2. All the gas flows were controlled by mass-flow controllers (Brooks, 5850E or 5800E). A small portion of CH3CHI2 vapor was introduced into a residual gas analyzer (SRS RGA200) to monitor the impurity. Most of CH3CHI2 vapor would mix with O2 and then flowed into an absorption cell (90 cm in length) to measure the UV absorption spectrum with a deuterium lamp (Hamamatsu L10904) and a mini spectrometer (Ocean Optics USB-2000). The water vapor concentration was controlled by varying the ratio of dry and moisturized N2 gases and monitored with a humidity sensor (Rotronic HC2-S, 0.8% RH accuracy at room temperature). The water vapor was pre-cooled or pre-heated by flowing through a copper tube (1/4′′ OD, ca. 75 cm long) which was immersed in a circulating water bath. Two streams of the gas mixtures (water vapor/N2 and precursor/O2) were mixed together right before entering the reactor. The laser repetition rate was set to ca. 1 Hz to fully refresh the gas between consecutive laser shots.
The temperature of the water-jacketed reactor was controlled (±0.5 K) by using a circulating water bath (Yih Der BL-730), and detected by three resistance temperature detectors (RTD, Newport Omega F2020-1000-A). The pressures at the water reservoir, absorption cell and reactor were measured by diaphragm gauges (1000 torr, INFICON, ±0.2% of reading).
Results
We synthesized CH3CHOO (a mixture of anti and syn conformers) via a well-known method.7,12| CH3CHI2 + hν → CH3CHI + I | (R1) |
| CH3CHI + O2 → CH3CHOO + I | (R2) |
| CH3CHI + O2 + M → CH3CHIOO (adduct) + M | (R3) |
Similar to the case of preparing CH2OO, adduct formation (R3) is also expected and would reduce the yield of CH3CHOO at high pressures.22,23
Removing the contribution of anti-CH3CHOO
Fig. 1 shows typical time traces of CH3CHOO absorption signals recorded at 340 nm under various [H2O]. We can see that the fast component decays faster at higher [H2O], while the effect of [H2O] on the slow component is rather weak. Because anti-CH3CHOO reacts with water vapor much faster than syn-CH3CHOO does,20 we may separate their signals by fitting the time traces with two exponential functions (eqn (1)).
 | (1) |
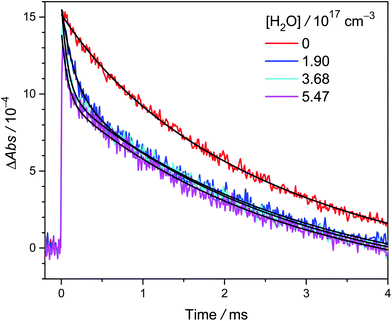 | ||
| Fig. 1 Typical time traces of CH3CHOO absorption probed at 340 ± 5 nm under various [H2O] (308 K and 305 torr, Exp. W2-3: [CH3CHI2] = 1.4 × 1014 cm−3, laser fluence = 1.7 mJ cm−2, see Table S1† for details). The photolysis laser pulse sets the time zero. The black lines are two-exponential fit to the data (see text). The fast decay signal is assigned to anti-CH3CHOO, the slow one to syn-CH3CHOO. | ||
The fast kinetics of anti-CH3CHOO reaction with water vapor has been investigated in depth by a few groups.12,20,25 Therefore we do not repeat it here. Water vapor efficiently scavenges anti-CH3CHOO; Fig. 1 shows that at [H2O] > 1.9 × 1017 cm−3, only syn-CH3CHOO signal remains for t > 1 ms. The reaction of syn-CH3CHOO with H2O has been reported to be much slower than that of anti-CH3CHOO.12,13,20,25 More kinetic investigation on the reaction of syn-CH3CHOO with H2O will be discussed later in this paper.
Effect of bimolecular reactions of syn-CH3CHOO with radical byproducts
Fig. 2 shows the time traces of CH3CHOO absorption signals recorded under various precursor concentrations [CH3CHI2]0 and a fixed photolysis laser fluence. In this experiment, we added water ([H2O] = 1.9 × 1017 cm−3) to scavenge anti-CH3CHOO and the absorption signal of the remaining syn-CH3CHOO predominates in the time traces for t > 1 ms. We can see that the lifetime of syn-CH3CHOO becomes shorter at higher [CH3CHI2]0. This is mainly due to the reactions of syn-CH3CHOO with radical byproducts like iodine atoms, similar to previous results for CH2OO,23 syn-CH3CHOO19,26 and (CH3)2COO.27 The inset of Fig. 2 shows the observed decay rate coefficient kobs of syn-CH3CHOO plotted against its fitted peak height [syn-CH3CHOO]0, which was estimated by using the Beer–Lambert law with a reported cross section σsyn = 1.19 × 10⁻¹⁷ cm2 at 340 nm (ref. 21) (which is consistent with the results by Sheps et al.25) and effective length L = 426 cm.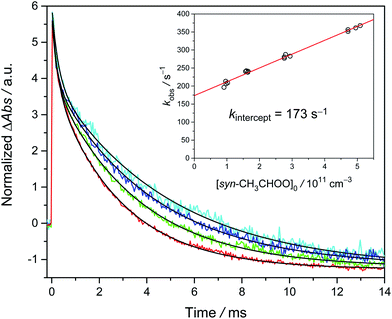 | ||
| Fig. 2 Typical time traces of CH3CHOO probed at 340 ± 5 nm at [H2O] = 1.9 × 1017 cm−3; different colors denote various precursor concentrations [CH3CHI2]0 (4.8 × 1013 cm−3 (cyan), 7.7 × 1013 cm−3 (blue), 1.3 × 1014 cm−3 (green), and 2.5 × 1014 cm−3 (red)). These traces were acquired at 299 K and 301 torr with a laser fluence of 1.7 mJ cm−2 (Exp. 2-1, see Table S2†). For each trace, the black line is the two-exponential fit (eqn (1)) to the signal of CH3CHOO. The fast decay signal is assigned to anti-CH3CHOO; the slow one is assigned to syn-CH3CHOO. The slightly negative baseline is due to the depletion of the precursor CH3CHI2, which is a constant in the detection time window and does not affect the kinetics. We scaled the peak absorbance of syn-CH3CHOO to the same value for easier visualization. Inset: the plot of kobs versus [syn-CH3CHOO]0. The red line is the linear fit. | ||
Under our experimental conditions, the concentrations of the radical byproducts (I, CH3CHOO, CH3CHIOO, etc.) are proportional to [syn-CH3CHOO]0. The related chemical reactions include (R1)–(3). Thus, we can use [X], [X] ∝ [syn-CH3CHOO]0, to represent the effective concentration of the total radical species. We used the following kinetic model to analyze the experimental data.
| kobs = kuni + kX[X] + kw[H2O] + kwall | (2) |
Similar experiments have also been performed at temperatures from 278 K to 318 K. The results are shown in Fig. 3. Again, the positive slope indicates the observed decay rate coefficient becomes larger at higher radical concentrations. Remarkably, the intercept rate is substantially larger at higher temperature, suggesting that the unimolecular rate is faster at higher temperature.
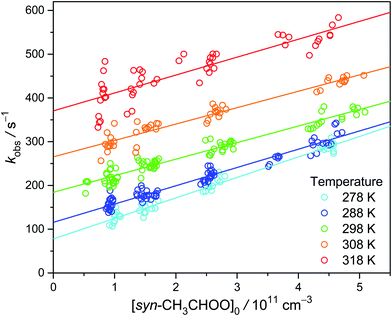 | ||
| Fig. 3 Plot of kobs as a function of [syn-CH3CHOO]0 at different temperatures. The experiments were conducted at 300 torr and detailed experimental conditions are shown in Table S2.† | ||
Effect of water vapor
We observed that the decay rate of syn-CH3CHOO becomes slightly faster at higher [H2O], especially at higher temperatures (see Fig. 4). However, the slopes are not very significant, especially considering the large scatters of the data. The obtained slopes (kw) at 298 K and 300 torr are on the order of 1 × 10⁻¹⁶ cm3 s−1 (Exp. W3-1 and W4-1, see Table S1†), much larger than the theoretical results ranging from 1.9 × 10⁻¹⁹ to 2.4 × 10⁻¹⁸ cm3 s−1.13,28 The source of this discrepancy is not fully clear. It is likely that minor impurity in the water vapor had some effect (different sets of gas tubing were used in Experiments W3 and W4†). It is difficult to determine the small rate coefficient of syn-CH3CHOO reaction with water; as evidenced by previous investigations by Sheps et al.25 and Taatjes et al.12 which only reported upper limits of 2 × 10⁻¹⁶ and 4 × 10⁻¹⁵ cm3 s−1, respectively, for the rate coefficient. A similar difficulty has also been reported for the case of (CH3)2COO reaction with water (kw < 1.5 × 10⁻¹⁶ cm3 s−1).29 Fig. S3† shows the Arrhenius plot of kw. Because we cannot measure kw at temperatures lower than 298 K, the values of kw from the Arrhenius fit are used. Considering the difficulties in the experiments, here we report a conservative upper limit of 1 × 10⁻¹⁶ cm3 s−1 for kw at 298 K.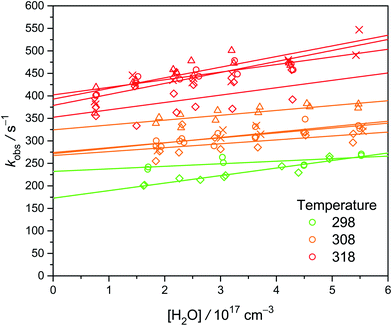 | ||
| Fig. 4 Plot of kobs as a function of [H2O] at three temperatures (color-coded) under 300 torr. Different symbols represent different sets of experiments at various [CH3CHI2]0, while each set of experiment was conducted at a constant laser power (see Table S1†). The lines are linear fit to the data. Larger values of the intercept rates are due to higher temperature or higher [CH3CHI2]0. | ||
Effect of wall loss
To estimate the wall loss in our system, we measured the decay rates of CH2OO under similar experimental conditions. The thermal decomposition of CH2OO has been calculated to be quite slow.6 In addition, Berndt et al. have performed time-resolved experiments of C2H4 ozonolysis, which yielded a rate coefficient of (0.19 ± 0.07) s−1 for the unimolecular reaction of CH2OO at 298 K and 1 bar.30 Furthermore, Stone et al. directly measured the unimolecular reaction of CH2OO at higher temperatures (450–650 K) and obtained a rate coefficient of (1.1+1.5−1.1 × 10⁻³) s−1 at 298 K and 760 torr using a master-equation method.31 Thus, the observed CH2OO decay (kobs, see Fig. 5) in our system should mainly come from the wall loss (intercept) and bimolecular reactions (slope). As shown in Fig. S6,† the results at different temperatures and pressures are quite similar, with an average value of about 9 s−1 for kwall. At our pressure range, diffusion is too slow to explain the observed wall loss rate; gas turbulence, which is expected to be more severe at higher pressures, should be the main cause of the observed wall loss (see ESI† for details). As gas turbulence would not be affected by the highly diluted precursor molecules and Criegee intermediates, we assume the wall loss rate of syn-CH3CHOO is the same as that of CH2OO.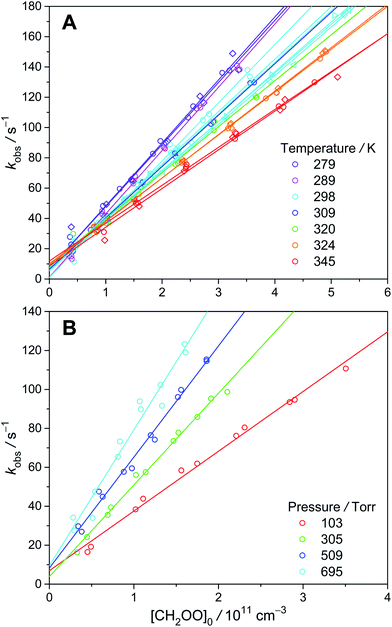 | ||
| Fig. 5 kobs as a function of [CH2OO]0 at various temperatures (A) and pressures (B) (color-coded). Different symbols represent different experimental sets. | ||
kuni and its temperature dependence
Here we give one example of determining the unimolecular rate at 298 K.| kuni = kobs − kX[X] − kw[H2O] − kwall = kintercept − kw[H2O] − kwall | (2′) |
In Fig. 2 inset, we can see that the kX[X] term has a significant contribution to kobs. This contribution can be removed by extrapolating kobs to zero radical concentration (i.e., using kintercept). For Exp. 2-1 (299 K, 301 torr, see Table S2†), kintercept = 173 s−1, kw[H2O] = 17 s−1, kwall = 9 s−1 and we have kuni = 173 − 17 − 9 = 147 s−1. See ESI† for details.
Fig. 6 shows the Arrhenius plot of kuni measured at 300 torr, as well as a few theoretical results. Our data are consistent with the theoretical results, especially those by Fang et al.14 and Yin et al.15 However, the theoretical slopes (activation energy) are all a bit higher than the experimental value. The reason for this difference is unclear. As mentioned above, the water reaction rates kw[H2O] are difficult to quantify. If we assume kw = 0, the resulted activation energy would be a bit closer to the theoretical values (see Table 1).
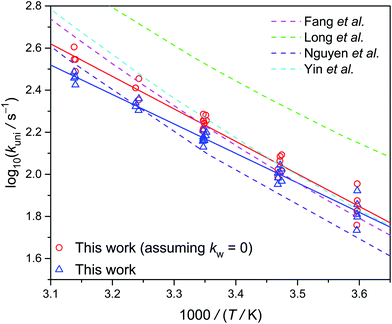 | ||
| Fig. 6 Arrhenius plot of the thermal decomposition rate coefficient of syn-CH3CHOO at 300 torr (Table S2†). The dashed lines are theoretical data reported by various groups at the high pressure limit.13–15,32 The experimental data shown as triangles and circles represent the data with and without subtracting the water contribution, respectively. | ||
| kuni/s−1 | Ea/kcal mol−1 | |
|---|---|---|
| a At 298 K and 300 torr. The error bar is one standard deviation (see ESI).b The activation energy (including theoretical ones) is obtained from the slope of the linear fitting of log(k) against 1/T within 278–318 K; the error bar is one standard deviation of the fitting.c Theoretical result at 298 K at the high pressure limit. | ||
| This work | 146 ± 31a | 6.4 ± 0.2b |
| This work (assuming kw = 0) | 173 ± 31a | 7.1 ± 0.3b |
| Fang et al.14 | 166c | 8.5 ± 0.1b |
| Long et al.13 | 328c | 7.7 ± 0.2b |
| Nguyen et al.32 | 124c | 8.2 ± 0.4b |
| Yin et al.15 | 182c | 8.6 ± 0.2b |
Pressure dependence of kuni
Fig. 7 shows the pressure dependence of kuni at 298 K. Because we used water to scavenge anti-CH3CHOO, we cannot measure kuni at pressure lower than 100 torr. Our data from 100 to 700 torr suggest slightly higher unimolecular rate at higher pressure, albeit some scattering of the data points. The low-pressure results of Zhou et al. are also plotted in Fig. 7. As will be discussed below, Zhou et al.19 may have underestimated their diffusion loss and thus overestimated their kuni values, especially for data at lower pressures. Overall, the observed pressure dependences are roughly consistent with the theoretical trend.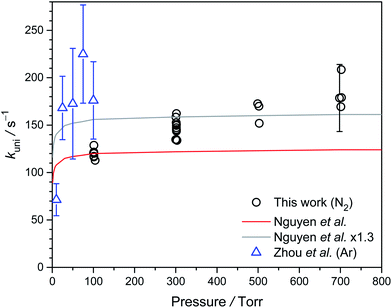 | ||
| Fig. 7 Plot of kuni of syn-CH3CHOO against pressure from 100 to 700 torr at 298 K (Table S3†). The experimental data reported by Zhou et al. are shown as blue triangles,19 and the theoretical data reported by Nguyen et al. is shown as a red line.32 In order to compare with the experimental data, we also scaled the data of Nguyen et al. by a factor of 1.3 (gray line). | ||
Discussion
Effect of second-order reactions
In previous works on the thermal decomposition reactions of (CH3)2COO by Smith et al.27 and of syn-CH3CHOO by Zhou et al.,19 the authors have considered the contributions of second-order reactions (including the reaction with iodine atoms and self-reaction of Criegee intermediates26). Following the notation of Smith et al., the corresponding kinetic equation can be expressed as below.27
 | (3) |
 | (4) |
As mentioned by Smith et al., the difference between the two models only shows up at high concentration data.27 As shown in Fig. S5,† the simulated time traces of the solutions of eqn (3) and (4) are quite similar for [CI]0 = 3 × 1011 cm−3, k1 = 150 s−1, k2 = 1.6 × 10⁻¹⁰ cm3 s−1. Therefore, we chose to use eqn (4) for more efficient data analysis.
Tunneling and potential energy surface
Lester, Klippenstein and coworkers have shown that H-atom tunneling is the main mechanism of the unimolecular decay of syn-CH3CHOO.14,16,33 Green et al. of the same group further investigated the tunneling dynamics by using syn-CD3CHOO sample.34 Their theoretical calculation describes the energy-specific unimolecular rates quite well. Based on these successes, they can further estimate the unimolecular rates under thermalized conditions. The result is plotted in Fig. 6 (Fang et al.), which agrees with our experimental data. The subtle difference in the slopes of the Arrhenius plots may be due to minor differences in (i) potential energy surface, (ii) tunneling model, and (iii) experimental uncertainties.Compare to the recent results of Zhou et al.
Recently Zhou et al. measured the unimolecular rates of syn-CH3CHOO by probing the OH products with laser-induced fluorescence.19 Because the barrier of OH production of anti-CH3CHOO is much higher than that for syn-CH3CHOO,13,15 Zhou et al. do not need to scavenge anti-CH3CHOO.Their measurements were under 10 to 100 torr,19 limited by the lower sensitivity of the OH laser-induced fluorescence at higher pressure. Our work provides data at higher pressures up to 700 torr, much more relevant to the atmospheric conditions. In addition, perhaps due to sensitivity issue, Zhou et al. used higher concentrations of the Criegee intermediate in their experiments (judged by the faster observed decay rates), resulting in larger error bars for the unimolecular rates. Furthermore Zhou et al. did not investigate the temperature dependence.19
Diffusion would have a more significant effect at low pressures as the diffusion coefficient is inversely proportional to the pressure. However, Zhou et al. only argued that their experiments should be in the laminar flow condition (i.e., no turbulence), without estimating the effect of diffusion.19 A simple but useful estimation of the diffusion effect can be found in textbooks35 as
| zrms = (2Dt)0.5 |
Fig. S8† shows more-realistic simulation results for cases similar to the experimental conditions of Zhou et al. (with orthogonal pump and probe laser beams).19 Again, the diffusion loss has a significant effect of about 50 s−1 (10 torr) to ≈< 10 s−1 (100 torr) (see ESI†), indicating that the low-pressure results by Zhou et al. should be corrected by considering the diffusion loss.
Fate of syn-CH3CHOO in troposphere
Previous investigations6 have pointed out that unimolecular decay is one of the main processes of Criegee intermediates in the atmosphere. For syn conformers, the unimolecular decay would be the predominant process.4 For syn-CH3CHOO, we list the effective pseudo-first-order rates of some important processes in Table 2. It is clear that the unimolecular decomposition is the predominate decay pathway of syn-CH3CHOO in the troposphere. This fast unimolecular decay would control the steady-state concentration of syn-CH3CHOO. As a result, the probability for syn-CH3CHOO to oxidize SO2 would be low due to its low concentration. For other Criegee intermediates of similar structures (alkyl substitution at the syn position), the situation is expected to be similar. As mentioned above, the thermal decomposition rate is quite sensitive to temperature. This work gives temperature dependent value of kuni, which allows modelers to better estimate the unimolecular decay rates of syn-CH3CHOO at atmospherically relevant temperatures.| Process | Assumed coreactant concentration/cm−3 | Bimolecular rate coefficient/cm3 s−1 | Effective first-order rate coefficient/s−1 |
|---|---|---|---|
| a This work. Note that the value of kuni is quite sensitive to temperature.b Upper limit, this work.c The values are reported by Taatjes et al.12 and Sheps et al.25 | |||
| Thermal decomposition | — | — | 146 ± 31a |
| syn-CH3CHOO + H2O | 3.8 × 10¹⁷ (50% RH) | <1 × 10⁻¹⁶,b | <38 |
| syn-CH3CHOO + SO2 | 9 × 10¹¹ (35 ppbv) | (2.4–2.9) × 10−11,c | 22–26 |
Conflicts of interest
There are no conflicts to declare.Acknowledgements
This work is supported by Academia Sinica and Ministry of Science and Technology, Taiwan (MOST 106-2113-M-001-026-MY3). We thank Ms Yen-Hsiu Lin for help in the measurements of the wall loss rates.References
- M. A. H. Khan, C. J. Percival, R. L. Caravan, C. A. Taatjes and D. E. Shallcross, Environ. Sci.: Processes Impacts, 2018, 20, 437–453 RSC.
- O. Welz, J. D. Savee, D. L. Osborn, S. S. Vasu, C. J. Percival, D. E. Shallcross and C. A. Taatjes, Science, 2012, 335, 204–207 CrossRef CAS PubMed.
- C. A. Taatjes, Annu. Rev. Phys. Chem., 2017, 68, 183–207 CrossRef CAS PubMed.
- J. J. M. Lin and W. Chao, Chem. Soc. Rev., 2017, 46, 7483–7497 RSC.
- L. Vereecken, D. R. Glowacki and M. J. Pilling, Chem. Rev., 2015, 115, 4063–4114 CrossRef CAS PubMed.
- L. Vereecken, A. Novelli and D. Taraborrelli, Phys. Chem. Chem. Phys., 2017, 19, 31599–31612 RSC.
- F. Liu, J. M. Beames, A. S. Petit, A. B. McCoy and M. I. Lester, Science, 2014, 345, 1596–1598 CrossRef CAS PubMed.
- F. Liu, J. M. Beames and M. I. Lester, J. Chem. Phys., 2014, 141, 234312 CrossRef PubMed.
- T. Berndt, T. Jokinen, R. L. Mauldin, T. Petäjä, H. Herrmann, H. Junninen, P. Paasonen, D. R. Worsnop and M. Sipilä, J. Phys. Chem. Lett., 2012, 3, 2892–2896 CrossRef CAS.
- A. Novelli, L. Vereecken, J. Lelieveld and H. Harder, Phys. Chem. Chem. Phys., 2014, 16, 19941–19951 RSC.
- M. J. Newland, A. R. Rickard, L. Vereecken, A. Muñoz, M. Ródenas and W. J. Bloss, Atmos. Chem. Phys., 2015, 15, 9521–9536 CrossRef CAS.
- C. A. Taatjes, O. Welz, A. J. Eskola, J. D. Savee, A. M. Scheer, D. E. Shallcross, B. Rotavera, E. P. F. Lee, J. M. Dyke, D. K. W. Mok, D. L. Osborn and C. J. Percival, Science, 2013, 340, 177–180 CrossRef CAS PubMed.
- B. Long, J. L. Bao and D. G. Truhlar, J. Am. Chem. Soc., 2016, 138, 14409–14422 CrossRef CAS PubMed.
- Y. Fang, F. Liu, V. P. Barber, S. J. Klippenstein, A. B. McCoy and M. I. Lester, J. Chem. Phys., 2016, 144, 061102 CrossRef PubMed.
- C. Yin and K. Takahashi, Phys. Chem. Chem. Phys., 2017, 19, 12075–12084 RSC.
- Y. Fang, F. Liu, V. P. Barber, S. J. Klippenstein, A. B. McCoy and M. I. Lester, J. Chem. Phys., 2016, 145, 234308 CrossRef PubMed.
- Y. Fang, F. Liu, S. J. Klippenstein and M. I. Lester, J. Chem. Phys., 2016, 145, 044312 CrossRef PubMed.
- T. A. Stephenson and M. I. Lester, Int. Rev. Phys. Chem., 2020, 39, 1–33 Search PubMed.
- X. H. Zhou, Y. Q. Liu, W. R. Dong and X. M. Yang, J. Phys. Chem. Lett., 2019, 10, 4817–4821 Search PubMed.
- L. C. Lin, W. Chao, C. H. Chang, K. Takahashi and J. J. M. Lin, Phys. Chem. Chem. Phys., 2016, 18, 28189–28197 RSC.
- M. C. Smith, W. L. Ting, C. H. Chang, K. Takahashi, K. A. Boering and J. J. M. Lin, J. Chem. Phys., 2014, 141, 074302 CrossRef PubMed.
- Y.-H. Huang, L.-W. Chen and Y.-P. Lee, J. Phys. Chem. Lett., 2015, 6, 4610–4615 CrossRef CAS PubMed.
- W. L. Ting, C. H. Chang, Y. F. Lee, H. Matsui, Y. P. Lee and J. J. M. Lin, J. Chem. Phys., 2014, 141, 104308 CrossRef PubMed.
- S. P. Sander, J. R. Barker, D. M. Golden, M. J. Kurylo, P. H. Wine, J. P. D. Abbatt, J. B. Burkholder, C. E. Kolb, G. K. Moortgat, R. E. Huie and V. L. Orkin, Chemical Kinetics and Photochemical Data for Use in Atmospheric Studies Evaluation Number 17, JPL Publication, 2011, pp. 10–6 Search PubMed.
- L. Sheps, A. M. Scully and K. Au, Phys. Chem. Chem. Phys., 2014, 16, 26701–26706 RSC.
- P.-L. Luo, Y. Endo and Y.-P. Lee, J. Phys. Chem. Lett., 2018, 9, 4391–4395 CrossRef CAS PubMed.
- M. C. Smith, W. Chao, K. Takahashi, K. A. Boering and J. J. M. Lin, J. Phys. Chem. A, 2016, 120, 4789–4798 CrossRef CAS PubMed.
- J. Anglada, J. Gonzalez and M. Torrent-Sucarrat, Phys. Chem. Chem. Phys., 2011, 13, 13034–13045 RSC.
- H.-L. Huang, W. Chao and J. J.-M. Lin, Proc. Natl. Acad. Sci. U. S. A., 2015, 112, 10857–10862 CrossRef CAS PubMed.
- T. Berndt, R. Kaethner, J. Voigtländer, F. Stratmann, M. Pfeifle, P. Reichle, M. Sipilä, M. Kulmala and M. Olzmann, Phys. Chem. Chem. Phys., 2015, 17, 19862–19873 RSC.
- D. Stone, K. Au, S. Sime, D. J. Medeiros, M. Blitz, P. W. Seakins, Z. Decker and L. Sheps, Phys. Chem. Chem. Phys., 2018, 20, 24940–24954 RSC.
- T. L. Nguyen, L. McCaslin, M. C. McCarthy and J. F. Stanton, J. Chem. Phys., 2016, 145, 131102 CrossRef PubMed.
- V. P. Barber, S. Pandit, V. J. Esposito, A. B. McCoy and M. I. Lester, J. Phys. Chem. A, 2019, 123, 2559–2569 CrossRef CAS PubMed.
- A. M. Green, V. P. Barber, Y. Fang, S. J. Klippenstein and M. I. Lester, Proc. Natl. Acad. Sci. U. S. A., 2017, 114, 12372–12377 CrossRef CAS PubMed.
- P. L. Houston, Chemical Kinetics and Reaction Dynamics, Dover Publications, Mineola, New York, 2006 Search PubMed.
Footnote |
| † Electronic supplementary information (ESI) available. See DOI: 10.1039/d0ra01406k |
| This journal is © The Royal Society of Chemistry 2020 |
