 Open Access Article
Comparative study on the catalytic steam reforming of biomass pyrolysis oil and its derivatives for hydrogen production
Peng Fu *,
Andong Zhang,
Shan Luo,
Weiming Yi and
Yuchun Zhang
School of Agricultural Engineering and Food Science, Shandong Research Center of Engineering & Technology for Clean Energy, Shandong University of Technology, Zibo 255000, China. E-mail: fupengsdut@163.com
First published on 31st March 2020
Abstract
In order to explore the reforming process of biomass pyrolysis oil in depth, the catalytic steam reforming (SR) of crude bio-oil (BIO) derived from rapid pyrolysis of rice husk and its derivatives for hydrogen production was studied by means of a bench-scale fixed-bed unit combined with the FTIR/TCD technique. The physico-chemical properties and compositions of BIO were determined. Acetic acid (HOAc), ethylene glycol (EG), acetone (ACE) and phenol (PHE) were selected as four representative bio-oil derivatives. Evolution characteristics of H2, CO, CO2 and CH4 during SR of HOAc, EG, ACE, PHE and BIO were revealed and compared. The hydrogen yield increased sharply with reaction time to the peak values of 24.7%, 32.3%, 16.4%, 25.6% and 24.9%, corresponding to HOAc, EG, ACE, PHE and BIO, respectively. After that, the yield of hydrogen exhibited a downward trend, suggesting that the catalyst ability for selective hydrogen production gradually decreased. The H2 yield from EG was the highest, followed by PHE, HOAc, BIO and ACE. The order of CO yields from large to small was EG > HOAc > ACE > BIO ≈ PHE. The percentages of coke deposited on catalyst were arranged in descending order as HOAc > BIO > ACE > PHE > EG. This study could provide more detailed information on the catalytic reforming mechanism of bio-oil on the one hand, and also point out the direction for the improvement of the catalysts, which play a role in ensuring the high yield of H2 while converting CO to H2 through the water gas shift reaction.
1. Introduction
Hydrogen is recognized as the most promising clean fuel and energy carrier in the 21st century, and has advantages of high energy density per unit mass, green cleanliness and recyclability. Due to achieving efficient and convenient use of hydrogen, fuel cell technology is one of the most promising routes in the use of hydrogen energy, and provides higher electrical efficiencies and overall efficiencies than heat engines. Hydrogen, as a base chemical, is widely applied in industrial fields such as food processing, petroleum refining, metal smelting, methanol and ammonia synthesis. Currently, the main approaches to produce industrial hydrogen are steam reforming (SR) of petroleum-derived naphtha and natural gas, partial oxidation of heavy oils, coal gasification and water electrolysis. Given the importance of environmental issues and sustainable energy development, a lot of efforts are being made to exploit the sustainable biomass for producing hydrogen.1,2 Biomass has the advantages of abundant reserves, wide sources, low price, carbon neutrality. The use of lignocellulosic waste to produce hydrogen can not only help to reduce CO2 emissions, but also enable the waste to be recycled. Therefore, it is of great significance to develop lignocellulosic biomass utilization technologies for hydrogen production.There are many ways to produce hydrogen from biomass, including thermochemical processes or bio-chemical/biological means.3 With regard to thermochemical conversion technologies for hydrogen production, it mainly involves two routes, one is to gasify biomass to obtain a hydrogen-rich mixture;4,5 the second one is to rapidly pyrolyze biomass to generate bio-oil (for convenience, marked as BIO) followed by the catalytic reforming of BIO to obtain hydrogen.6 Compared to the former, the latter has some advantages already mentioned in the literature, making it one of the most promising approaches for the generation of hydrogen from biomass on a large scale. Bio-oil has been confirmed to contain mainly water and different organic compounds such as acetic acid, furfural, hydroxyacetone, 3-methyl-2-cyclopentenone, phenol, 2,6-dimethoxy-phenol, isoeugenol, levoglucosan, etc.7,8
Although bio-oil stands for a promising source of hydrogen, there are some technical obstacles in the efficient generation of hydrogen by SR process, one of which is the catalyst deactivation caused by complex components of bio-oil. For the purpose of further understanding bio-oil reforming process, acetic acid,9,10 ethylene glycol,11 acetone12/hydroxyacetone,13 phenol14 and simulated bio-oils15 in reforming processes have been studied to establish the correlations between catalyst structure and reforming activities and/or to explore process control conditions and reaction mechanisms. In fact, bio-oil contains quite a lot of water-insoluble or non-volatile components, which are difficult to reform and tend to form coke on the catalyst surfaces or catalytic bed walls, causing deactivation of the catalysts and clogging of the reaction bed. So far, extensive work has focused on the water-soluble or volatile components of bio-oil.16–18 However, the water-insoluble components and the heavy fractions of bio-oil are missed to be reformed into the hydrogen. Recently, Liu et al.19 reported the successful application of rice husk pyrolysis bio-oil as the feedstock for the production of H2-rich syngas through two-stage catalytic SR process, using different combinations of Fe/bio-char and Ni–Ca/γ-Al2O3 catalysts. Wiranarongkorn and Arpornwichanop20 proposed a Ca-looping sorption-enhanced steam reforming (SESR) process and conducted the comparative analysis on the SR and SESR processes of bio-oil. The highest H2 concentration from the SR was 33.67% at 700 °C, while that from the SESR was 48.7% at 600 °C. Valle et al.21–23 delved into the SR of raw bio-oil over Ni/La2O3–αAl2O3 and Ni-spinel derived catalyst and clarified the effects of temperature, space-time, steam-to-carbon ratio and phenols extraction on product yields and catalyst deactivation. Remiro et al.24 explored the deactivation mechanism of Rh/CeO2–ZrO2 catalyst in SR of raw bio-oil. However, the comparative studies on the catalytic SR of bio-oil and its derivatives for hydrogen production are rarely reported, which deserves further exploration.
In order to explore the reforming process of crude bio-oil in depth, the catalytic SR of raw bio-oil and four main bio-oil derivatives (acetic acid, ethylene glycol, acetone and phenol) for hydrogen production was studied by means of a bench-scale fixed-bed unit combined with the FTIR/TCD techniques. The properties and compositions of rice husk pyrolysis bio-oil were analyzed in detail. The comparative analysis on evolution characteristics of H2, CO, CO2 and CH4 during SR of HOAc, EG, ACE, PHE and BIO was conducted. In addition, the coke deposition behavior on the catalyst was also examined. This study could provide more detailed information on the catalytic reforming mechanism of bio-oil on the one hand, and also points out the direction for the improvement of the catalysts, which play a role in ensuring the high yield of H2 while converting CO to H2 through the water gas shift reaction.
2. Experimental
2.1. Materials
The bio-oil utilized in this work was obtained through rapid pyrolysis of rice husk at 500–520 °C in a self-designed and built fluidized bed plant. The representative bio-oil derivatives selected in this study were acetic acid (HOAc, ≥99.5% purity), ethylene glycol (EG, ≥99.5% purity), acetone (ACE, ≥99.5% purity) and phenol (PHE, ≥99% purity). A commercial Ni-based catalyst was employed as SR catalyst. The ultimate analysis, water content, calorific value, density and pH value of the bio-oil was determined according to the methods provided in the literature.25 The bio-oil kinematic viscosity was measured using a YDN100 viscometer. The bio-oil composition was examined using GC/MS (Agilent 6890/5973N). The relative contents of bio-oil compounds were determined using semiquantitative analysis by accounting for the total area of identified peaks.2.2. Experimental apparatus and procedure
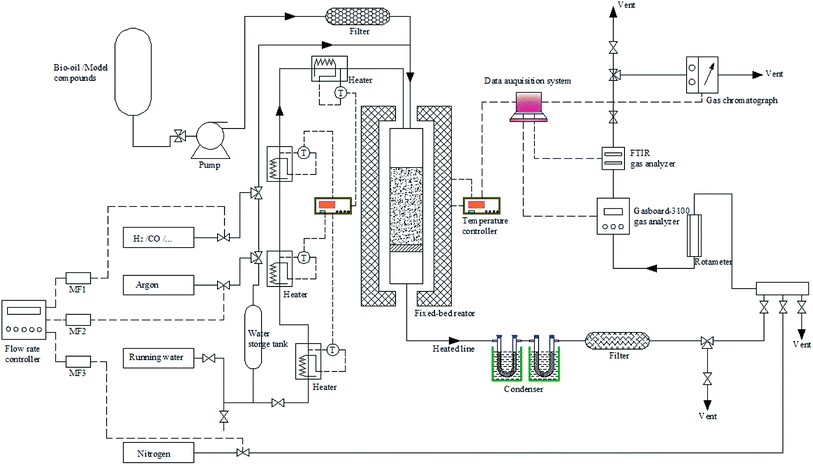
The reforming experiments were carried out in a bench-scale fixed-bed unit combined with the FTIR/TCD techniques (see Fig. 1). In each run, the catalysts were first reduced in situ under a N2/H2 atmosphere. Afterwards, the reactor was purged with N2 and heated to the target temperature between 600 and 900 °C. The bio-oil and steam were then introduced to the reaction system through two peristaltic pumps. The produced gas passed through a condensing system to mostly separate excess water and some unconverted reactants. A cotton filter was employed to capture residual condensable vapors to minimize interference with the rear gas analyzers. The cleaned gas was dried through a silica gel filter and then fed to a Gasboard-3100 analyzer and a Gasmet Dx-4000 FTIR analyzer in turn. After each experiment, the catalyst bed was purged and cooled to room temperature in a stream of nitrogen. Subsequently, the catalyst bed, condenser, pipes and filters were removed and weighed. Finally, the air was sent into the reforming reactor by combustion to clear away heavy tar from the tube wall. The condenser and all possible condensation lines were cleaned with acetone and the solvent was evaporated at 60 °C.The yield of H2 was defined as the ratio of the moles of H2 produced to the theoretical maximum H2 amount corresponding to complete SR of bio-oil and its derivatives to CO2 and H2. The yields of CO, CO2 and CH4 were defined as the ratio of the moles of corresponding gas produced to the moles of carbon in the feed. The carbon conversion could be obtained by dividing the moles of carbon in the gaseous products by the moles of the feed carbon. The water–carbon molar ratio (WCMR) and weight hourly space velocity (WHSV) were defined according to the methods provided in our previously published paper.25
2.3. Catalyst characterization
The catalyst chemical composition was measured by a ZSX-100e X-ray Fluorescence Spectrometer. The specific surface area and pore structure characteristics of the catalysts were evaluated by using an ASAP 2020 analyzer. The X-ray diffraction (XRD) measurements were conducted by using a Bruker AXS D8 Advance X-ray Diffractometer. The amount of coke deposited on the catalyst surface was analyzed by WCT-1C thermogravimetric analyzer. The temperature program was set to increase from ambient temperature to 800 °C and maintained at this temperature for 10 min. The weight loss of the catalyst was recorded in real time. According to the weight loss curves, the percentage of coke deposited on catalyst could be obtained by calculation.3. Results and discussion
3.1. The properties and compositions of bio-oil
The bio-oil derived from rapid pyrolysis of rice husk is a dark-brown liquid with a strong pungent odor. Table 1 shows the main properties of the used bio-oils. Considering that the bio-oil consists mainly of carbon, hydrogen and oxygen with their respective contents being 30.37%, 7.56% and 59.98%, its molecular formula can be simply labeled as CH2.987O1.481. It is worth noting that the oxygen content in the bio-oil is high because of the presence oxygenated organic compounds and also partly owing to the high water content of 40.17%, resulting in relatively poor chemical stability. Consequently, the bio-oil has a relatively low HHV of 13.86 MJ kg−1, as the existence of substantial amounts of oxygen and water adversely affects the fuel HHVs. The density of the bio-oil is 1.12 g cm−3 and higher than that of water. On the basis of the above-mentioned density and HHV data of the bio-oil, its energy density is calculated to be 15.5 GJ m−3, which is about 10 times higher than that of the original biomass assuming a bulk density of 100 kg m−3 for rice husk. The bio-oil has a pH value of 3.2 indicating it to be very acidic. This is mainly due to the fact that hemicellulose and cellulose in the original biomass produced a considerable amount of acid substances during rapid pyrolysis. The bio-oil has a low kinematic viscosity of 6.88 mm2 s−1 owing to the high water content of 40.17%, as the bio-oil viscosity is highly dependent on its water content, which has been confirmed by experiments.26| Properties | |
|---|---|
| Elemental composition (wt%) | |
| Carbon | 30.37 |
| Hydrogen | 7.56 |
| Nitrogen | 0.74 |
| Sulfur | 1.35 |
| Oxygen (by difference) | 59.98 |
| Water content (wt%) | 40.17 |
| Density (g cm−3) | 1.12 |
| Kinematic viscosity (mm2 s−1) | 6.88 |
| Calorific value (MJ kg−1) | 13.86 |
| pH | 3.2 |
The distribution of the group components and key chemical compounds in the bio-oil are displayed in Fig. 2. The acids account for a relatively large proportion of bio-oil, 15.06%, of which acetic acid is the most ascendent acidic compound with its content being 11.67%. Huang et al.27 pointed out that rice husk pyrolysis bio-oils had a relatively high proportion of acids with acetic acid being the most abundant one. Ketones account for 12.42%, wherein hydroxyacetone, 1-hydroxy-2-butanone, and methyl cyclopentenolone are the main ketonic compounds with their respective contents being 8.15%, 1.51%, and 2.21%. Phenols are important chemicals used in the production of dyes, pharmaceuticals, phenolic resins, adhesives, and the like. As displayed in Fig. 2, phenols, as the predominant components of bio-oil, has a content of 11.83%, which are derived from the depolymerization of lignin and decomposition of polysaccharide. With respect to the guaiacols, guaiacol and methyl guaiacol are the preponderating ones with their contents being 2.24% and 1.16%, respectively (see Fig. 2). The proportion of 1,2-benzenediol, hydroquinone and 2,6-dimethoxyphenol in the phenolic compound are also relatively high, the contents of which are 2.07%, 1.01% and 1.44%, respectively. Furthermore, phenol and maltol having the corresponding contents of 1.01% and 1.25% are also present in the bio-oil. Among the aldehydes, hydroxyacetaldehyde accounts for a relatively high proportion, and its content is 3.10%. Furans account for 4.28%, of which furfural is the most important compound. The bio-oil also contains 2.38% esters, of which methyl acetate is the preponderant one with its content being 1.49%. Additionally, the bio-oil also contains a certain amount of other oxygenated substances, such as sugars, ethers, anhydrides, etc.
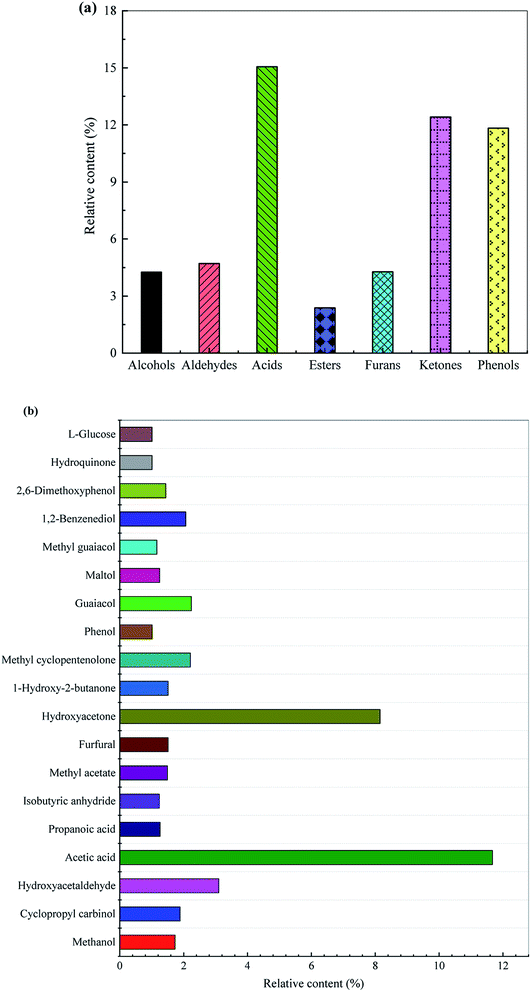 | ||
| Fig. 2 Distribution of (a) the group components and (b) key chemical compounds in the bio-oil derived from rapid pyrolysis of rice husk. | ||
With regard to the bio-oil, the overall SR reaction under ideal conditions can be expressed as follows:
 | (1) |
This means that the theoretical maximum amount of H2 produced from the bio-oil is 0.104 gH 2gbio-oil−1. However, in fact, the amount of hydrogen generated could not reach this maximum because of some accompanying side reactions such as the thermal decomposition, methanation and boudouard reactions.
| CnHmOk → CxHyOz + gas(H2, CO, CO2, CH4, …) + coke | (2) |
| CO + 3H2 ↔ CH4 + H2O | (3) |
| CO2 + 4H2 ↔ CH4 + 2H2O | (4) |
| 2CO ↔ CO2 + C | (5) |
3.2. Catalyst characteristics
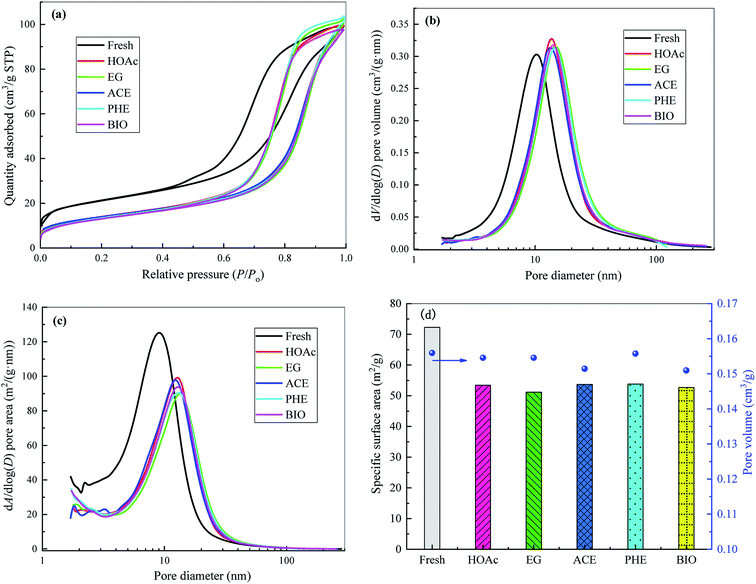
The Ni-based catalyst is a rod-like catalyst, which is mainly composed of NiO (16.3%), SiO2 (25.5%), Al2O3 (17.7%), ZrO2 (10.8%) and WO3 (29.2%). Nickel oxide could be reduced to the metal Ni through the reaction of NiO + H2 → Ni + H2O. On the one hand, Ni contributes to the breakage of the C–C and O–H bonds, and on the other hand, it has a high hydrogenation activity and promotes the formation of H2 by the H atoms.28 Silica could be used as the support of reforming catalysts to enhance their catalytic activities and stabilities. Alumina with acidic sites can catalyze the polymerization reactions.29 Zirconia has acidic/basic properties, which enhance the adsorption of steam and carbon oxides on its surface,30 thereby improving H2 yield and catalyst anti-carbon deposition ability. The addition of tungsten to Ni-based catalysts could enhance their stabilities and coke resistance.31 In addition, Very small amounts of K, Na, Mg, Ca and Fe are also present in the catalyst. Alkali and alkaline earth metals (such as K, Na, Mg, Ca) can modify the interaction between adsorbed species and Ni, thereby promoting the activity of reforming catalysts.28According to the physical adsorption isotherm classification method proposed by the International Union of Pure and Applied Chemistry (IUPAC), the adsorption isotherms for the fresh and reformed catalysts can be classified as IV type, indicating that they belong to mesoporous materials, which can also be confirmed from the data shown in the Fig. 3. From Fig. 3(a), in the lower relative pressure (P/P0) region, the adsorption isotherm is convex upward, similar to the type II isotherm, and the adsorption mechanism is also basically the same. When the P/P0 reaches about 0.4, the adsorbate undergoes capillary condensation in the mesopores and the adsorption capacity suddenly rises. When the capillary condensation of all the mesopores is completed, the adsorption occurs only on the outer surface much smaller than the inner surface, and the increasing trend of adsorption capacity gradually slows down. The capillary condensation phenomenon makes the desorption and adsorption isotherms unable to coincide and gives rise to the occurrence of adsorption hysteresis and thus the formation of hysteresis loops shown in Fig. 3(a). The adsorpted quantity was significantly lower for the reforming catalysts than for the fresh catalyst. This is mainly due to the fact that the coke produced by the reforming blocks some pores in the catalyst, which hinders further adsorption of nitrogen.
Pore size distribution (PSD) and specific surface area distribution (SSAD) diagrams for the fresh and used catalysts under SR of different feedstocks are displayed in Fig. 3(b) and (c), respectively. As observed, compared to the fresh catalyst, the steam reforming reaction results in considerable variation in the PSD and SSAD of reformed catalysts, thus leading to the visible changes in catalyst specific surface area values (see Fig. 3(d)). The specific surface area of the fresh catalyst is 72.25 m2 g−1, while those of the reformed catalysts are 53.43, 51.19, 53.67, 53.80 and 52.66 m2 g−1 for HOAc, EG, ACE, PHE and BIO, respectively. After steam reforming, the corresponding specific surface area values of the reformed catalysts are decreased by 26.0%, 29.1%, 25.7%, 25.5% and 27.1% compared to the fresh catalyst. The average pore diameter of the reformed catalysts becomes larger than that of the fresh catalyst. However, the reformed catalysts give the similar pore volumes to the fresh catalyst.
3.3. XRD analysis
The XRD patterns of the fresh and used catalysts under SR of bio-oil and its different oxygenated derivatives at temperature = 800 °C, WCMR = 3 and WHSV = 5 h−1 are shown in Fig. 4. Since the fresh and used catalysts contain very complex substances, the XRD patterns shown are the superposition of the diffraction peaks of various internal phases. The absorption or reflection of X-ray is different for each component in a catalyst, which is related not only to the content and crystallinity of the substance, but also to the existence of other substances in the catalyst. In addition, there may be diffraction peaks at the same angle for different substances, but the peak intensities are different. The occurrence of XRD peak overlap makes it difficult to accurately analyze the catalyst crystal structure. Therefore, the detected substances can not cover all the substances in the catalysts. For the fresh CNC catalyst, the band assigned to NiO(111) can be observed at 2θ = 37.1°, while the other two bands correspond to the NiO(200) and NiO(220) peaks are not obvious. In addition, other mineral phases, such as nickel tungsten oxide (NiWO4), alumina (Al2O3), and aluminum zirconium silicon (Zr3Al4Si5) are detected in the fresh catalyst.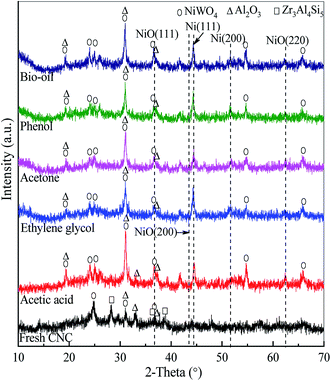 | ||
| Fig. 4 XRD patterns of the fresh and used catalysts at the operational conditions of temperature = 800 °C, WCMR = 3 and WHSV = 5 h−1. | ||
The used CNC catalysts under SR of bio-oil and its different oxygenated derivatives exhibit similar XRD pattern. As shown in Fig. 4, the NiO(111) band in the XRD patterns of the used catalysts is still clearly visible at 2θ = 37.1°. It's worth noting that the band corresponding to Ni(111) at 2θ = 44.7° can also be clearly observed. In addition, there is a very weak diffraction peak being at 2θ = 51.8°, corresponding to the Ni(200) band. The above information confirms that a certain amount of NiO in the catalyst is reduced to Ni through the reaction of NiO + H2 → Ni + H2O. Furthermore, all the used catalysts have the characteristic diffraction bands of NiWO4 with the 2θ of 19.3°, 24.0°, 24.9°, 30.9°, 36.6°, 54.6° and 65.8°. From the Fig. 4, there are diffraction peaks of A12O3 observed at 2θ = 19.5°, 31.1°, 32.8° and 37.0°. However, the characteristic diffraction bands of SiO2 and ZrO2 are not obvious, though the contents of silicon and zirconium are relatively high. This may be due to the fact that they are not present in the catalyst in the form of oxide crystallites. Another possible and reasonable reason is that they are highly dispersed on the surface of the catalyst.
3.4. Comparative analysis on the reforming of bio-oil and its derivatives
The catalytic reforming of bio-oil and its derivatives was studied at temperature = 800 °C, WCMR = 3 and WHSV = 5 h−1. The evolution patterns of H2, CO, CO2 and CH4 during the SR of HOAc, EG, ACE, PHE and BIO are displayed in Fig. 5. In the initial stage of the reforming process, the reforming reaction is very intense, and the H2 yield increases sharply with reaction time to the peak values of 24.7%, 32.3%, 16.4%, 25.6% and 24.9%, corresponding to HOAc, EG, ACE, PHE and BIO, respectively. After that, the yield of hydrogen exhibits a downward trend, indicating that the catalyst ability for selective hydrogen production gradually decreases. Because as the reaction proceeds, the intermediates are generated in large amounts during the SR of HOAc and cover the catalyst surface, which hinder the effective contact of the reactants with the catalyst. In addition, different reactions are competitive at the catalyst active sites. The above factors inhibit the reactions associated with hydrogen generation, resulting in the decrease of H2 yield and the lowered ability of the catalysts to selectively generate hydrogen. When the reaction time exceeds 10 min, the decreasing trend of H2 yield gradually slows down in response to the reaction time. The H2 yield from EG is the highest, followed by HE, HOAc, BIO and ACE.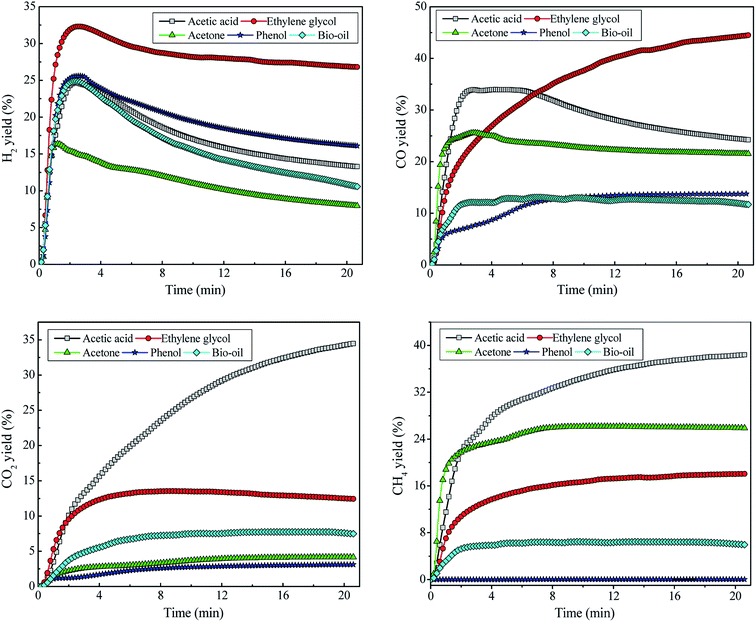 | ||
| Fig. 5 Evolution of hydrogen and the main carbonaceous gas products from the catalytic steam reforming of bio-oil and its derivatives. | ||
Regarding the SR of ethylene glycol, in the initial stage of the reaction, the yield of CO increases sharply with reaction time, and then the increasing trend of CO yield gradually slows down in response to the further increase of reaction time. Finally, it tends to be stable. For the SR of HOAc and ACE, the yield of CO has undergone a process of sharply increasing first, then decreasing and finally stabilizing. CO from bio-oil reforming shows the similar evolution behavior to that from phenol reforming. Ethylene glycol gives the highest CO yield, followed by acetic acid and acetone. The yields of CO from bio-oil and phenol are roughly similar and significantly lower than those from the other three feedstocks. The order of CO yields from large to small is EG > HOAc > ACE > BIO ≈ PHE. The CO2 yields from the SR of these five feedstocks are arranged in descending order as HOAc > EG > BIO > ACE > PHE. The yields of CH4 from these five feedstocks are in descending order of HOAc > ACE > EG > BIO > PHE, wherein the yield of CH4 from phenol is almost zero. The yield of CH4 from bio-oil is also relatively low and finally stabilizes at around 6%. The varied product distribution from various feedstocks could be due to the differences in their chemical structures and the resulting discrepancies in their reactivity with H2O molecules.
3.5. Analysis of coke deposition on catalyst
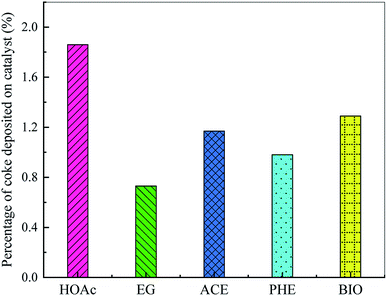
The coke deposition on the catalyst is one of the major drawbacks of bio-oil catalytic reforming technology, which not only leads to the reduction of H2 yield, but also to catalyst poisoning, deactivation and even reactor blockage. Therefore, it is very important to avoid or inhibit coke formation. The amount of coke formed on the reforming catalyst was analyzed by DTG. Fig. 6 shows the effect of feedstock type on the percentage of coke deposited on catalyst. As shown, the percentages of coke deposited on catalyst are arranged in descending order as HOAc > BIO > ACE > PHE > EG, which are rather small. This is attributed to the good resistance of the catalyst to the formation of coke for different feedstocks, which greatly reduces the accumulation of coke precursors and unreacted reactants. Thus, the contact between the Ni active sites and the reactants is greatly maintained. At the same time, some side reactions, such as the thermal decomposition of reactants, Boudouard reaction, reduction of carbon oxides, etc., are also suppressed.4. Conclusions
The physico-chemical properties and compositions of BIO were determined. Evolution characteristics of H2, CO, CO2 and CH4 during SR of HOAc, EG, ACE, PHE and BIO were revealed and compared. The hydrogen yield increased sharply with reaction time to the peak values of 24.7%, 32.3%, 16.4%, 25.6% and 24.9%, corresponding to HOAc, EG, ACE, PHE and BIO, respectively. After that, the yield of hydrogen exhibited a downward trend, suggesting that the catalyst ability for selective hydrogen production gradually decreased. The H2 yield from EG was the highest, followed by PHE, HOAc, BIO and ACE. The order of CO yields from large to small was EG > HOAc > ACE > BIO ≈ PHE. The CO2 yields from the SR of these five feedstocks were arranged in descending order as HOAc > EG > BIO > ACE > PHE. The yields of CH4 from these five feedstocks were in descending order of HOAc > ACE > EG > BIO > PHE, wherein that from phenol was almost zero. The percentages of coke deposited on catalyst were arranged in descending order as HOAc > BIO > ACE > PHE > EG.Conflicts of interest
There are no conflicts to declare.Acknowledgements
The authors gratefully thank the support for this research from National Natural Science Foundation of China (No. 51676116, 51976112 and 51206100), Youth Innovation Support Program of Shandong Colleges and Universities (2019KJD013) and Zibo Key R & D Project (2019ZBXC300).References
- J. Spragg, T. Mahmud and V. Dupont, Hydrogen production from bio-oil: A thermodynamic analysis of sorption-enhanced chemical looping steam reforming, Int. J. Hydrogen Energy, 2018, 43, 22032–22045 CrossRef CAS.
- L. Heng, R. Xiao and H. Zhang, Life cycle assessment of hydrogen production via iron-based chemical-looping process using non-aqueous phase bio-oil as fuel, Int. J. Greenhouse Gas Control, 2018, 76, 78–84 CrossRef CAS.
- O. A. Omoniyi and V. Dupont, Optimised cycling stability of sorption enhanced chemical looping steam reforming of acetic acid in a packed bed reactor, Appl. Catal., B, 2019, 242, 397–409 CrossRef CAS.
- Z. Sun, S. Toan, S. Chen, W. Xiang, M. Fan, M. Zhu and S. Ma, Biomass pyrolysis-gasification over Zr promoted CaO-HZSM-5 catalysts for hydrogen and bio-oil co-production with CO2 capture, Int. J. Hydrogen Energy, 2017, 42, 16031–16044 CrossRef CAS.
- C. Wu, L. Wang, P. T. Williams, J. Shi and J. Huang, Hydrogen production from biomass gasification with Ni/MCM-41 catalysts: Influence of Ni content, Appl. Catal., B, 2011, 108–109, 6–13 CrossRef CAS.
- K. Bizkarra, V. L. Barrio, L. Gartzia-Rivero, J. Bañuelos, I. López-Arbeloa and J. F. Cambra, Hydrogen production from a model bio-oil/bio-glycerol mixture through steam reforming using Zeolite L supported catalysts, Int. J. Hydrogen Energy, 2019, 44, 1492–1504 CrossRef CAS.
- P. Fu, W. Yi, Z. Li and Y. Li, Comparative study on fast pyrolysis of agricultural straw residues based on heat carrier circulation heating, Bioresour. Technol., 2019, 271, 136–142 CrossRef CAS PubMed.
- P. Fu, X. Bai, Z. Li, W. Yi, Y. Li and Y. Zhang, Fast pyrolysis of corn stovers with ceramic ball heat carriers in a novel dual concentric rotary cylinder reactor, Bioresour. Technol., 2018, 263, 467–474 CrossRef CAS PubMed.
- I. Choi, K. Hwang, K. Lee and I. Lee, Catalytic steam reforming of biomass-derived acetic acid over modified Ni/γ-Al2O3 for sustainable hydrogen production, Int. J. Hydrogen Energy, 2019, 44, 180–190 CrossRef CAS.
- N. Cakiryilmaz, H. Arbag, N. Oktar, G. Dogu and T. Dogu, Catalytic performances of Ni and Cu impregnated MCM-41 and Zr-MCM-41 for hydrogen production through steam reforming of acetic acid, Catal. Today, 2019, 323, 191–199 CrossRef CAS.
- E. C. Vagia and A. A. Lemonidou, Thermodynamic analysis of hydrogen production via steam reforming of selected components of aqueous bio-oil fraction, Int. J. Hydrogen Energy, 2007, 32, 212–223 CrossRef CAS.
- X. Hu, L. Zhang and G. Lu, Pruning of the surface species on Ni/Al2O3 catalyst to selective production of hydrogen via acetone and acetic acid steam reforming, Appl. Catal., A, 2012, 427–428, 49–57 CrossRef CAS.
- S. Wang, Q. Cai, F. Zhang, X. Li, L. Zhang and Z. Luo, Hydrogen production via catalytic reforming of the bio-oil model compounds: Acetic acid, phenol and hydroxyacetone, Int. J. Hydrogen Energy, 2014, 39, 18675–18687 CrossRef CAS.
- N. Yu, M. M. Rahman, J. Chen, J. Sun, M. Engelhard, X. I. P. Hernandez and Y. Wang, Steam reforming of simulated bio-oil on K-Ni-Cu-Mg-Ce-O/Al2O3: The effect of K, Catal. Today, 2019, 323, 183–190 CrossRef CAS.
- Z. Ma, R. Xiao and H. Zhang, Catalytic steam reforming of bio-oil model compounds for hydrogen-rich gas production using bio-char as catalyst, Int. J. Hydrogen Energy, 2017, 42, 3579–3585 CrossRef CAS.
- V. Paasikallio, J. Kihlman, C. A. S. Sánchez, P. Simell, Y. Solantausta and J. Lehtonen, Steam reforming of pyrolysis oil aqueous fraction obtained by one-step fractional condensation, Int. J. Hydrogen Energy, 2015, 40, 3149–3157 CrossRef CAS.
- F. Bimbela, J. Ábrego, R. Puerta, L. García and J. Arauzo, Catalytic steam reforming of the aqueous fraction of bio-oil using Ni-Ce/Mg-Al catalysts, Appl. Catal., B, 2017, 209, 346–357 CrossRef CAS.
- D. Yao, C. Wu, H. Yang, Q. Hu, M. A. Nahil, H. Chen and P. T. Williams, Hydrogen production from catalytic reforming of the aqueous fraction of pyrolysis bio-oil with modified Ni–Al catalysts, Int. J. Hydrogen Energy, 2014, 39, 14642–14652 CrossRef CAS.
- Q. Liu, Z. Xiong, S. S. A. Syed-Hassan, Z. Deng, X. Zhao, S. Su, J. Xiang, Y. Wang and S. Hu, Effect of the pre-reforming by Fe/bio-char catalyst on a two-stage catalytic steam reforming of bio-oil, Fuel, 2019, 239, 282–289 CrossRef CAS.
- K. Wiranarongkorn and A. Arpornwichanop, Analysis of the Ca-looping sorption-enhanced steam reforming and solid oxide fuel cell integrated process using bio-oil, Energy Convers. Manage., 2017, 134, 156–166 CrossRef CAS.
- B. Valle, B. Aramburu, P. L. Benito, J. Bilbao and A. G. Gayubo, Biomass to hydrogen-rich gas via steam reforming of raw bio-oil over Ni/La2O3-αAl2O3 catalyst: Effect of space-time and steam-to-carbon ratio, Fuel, 2018, 216, 445–455 CrossRef CAS.
- B. Valle, N. García-Gómez, A. Arandia, A. Remiro, J. Bilbao and A. G. Gayubo, Effect of phenols extraction on the behavior of Ni-spinel derived catalyst for raw bio-oil steam reforming, Int. J. Hydrogen Energy, 2019, 44, 12593–12603 CrossRef CAS.
- B. Valle, B. Aramburu, M. Olazar, J. Bilbao and A. G. Gayubo, Steam reforming of raw bio-oil over Ni/La2O3-αAl2O3: Influence of temperature on product yields and catalyst deactivation, Fuel, 2018, 216, 463–474 CrossRef CAS.
- A. Remiro, A. Ochoa, A. Arandia, P. Castaño, J. Bilbao and A. G. Gayubo, On the dynamics and reversibility of the deactivation of a Rh/CeO2-ZrO2 catalyst in raw bio-oil steam reforming, Int. J. Hydrogen Energy, 2019, 44, 2620–2632 CrossRef CAS.
- P. Fu, W. Yi, Z. Li, X. Bai, A. Zhang, Y. Li and Z. Li, Investigation on hydrogen production by catalytic steam reforming of maize stalk fast pyrolysis bio-oil, Int. J. Hydrogen Energy, 2014, 39, 13962–13971 CrossRef CAS.
- C. Jr, D. Mohan, A. Eseyin, Q. Li and L. Ingram, Characterization of Bio-oils Produced from Fast Pyrolysis of Corn Stalks in an Auger Reactor, Energy Fuels, 2012, 26, 3816–3825 CrossRef.
- A. Huang, C. Hsu, B. Hou and H. Kuo, Production and separation of rice husk pyrolysis bio-oils from a fractional distillation column connected fluidized bed reactor, Powder Technol., 2018, 323, 588–593 CrossRef CAS.
- W. Nabgan, T. A. Tuan Abdullah, R. Mat, B. Nabgan, Y. Gambo, M. Ibrahim, A. Ahmad, A. A. Jalil, S. Triwahyono and I. Saeh, Renewable hydrogen production from bio-oil derivative via catalytic steam reforming: an overview, Renewable Sustainable Energy Rev., 2017, 79, 347–357 CrossRef CAS.
- L. Zhang, X. Hu, K. Hu, C. Hu, Z. Zhang, Q. Liu, S. Hu, J. Xiang, Y. Wang and S. Zhang, Progress in the reforming of bio-oil derived carboxylic acids for hydrogen generation, J. Power Sources, 2018, 403, 137–156 CrossRef CAS.
- X. Zhao, Y. Xue, C. Yan, Y. Huang, Z. Lu, Z. Wang, L. Zhang and C. Guo, Promoted activity of porous silica coated Ni/CeO2-ZrO2 catalyst for steam reforming of acetic acid, Int. J. Hydrogen Energy, 2017, 42, 21677–21685 CrossRef CAS.
- N. Cakiryilmaz, H. Arbag, N. Oktar, G. Dogu and T. Dogu, Effect of W incorporation on the product distribution in steam reforming of bio-oil derived acetic acid over Ni based Zr-SBA-15 catalyst, Int. J. Hydrogen Energy, 2018, 43, 3629–3642 CrossRef CAS.
| This journal is © The Royal Society of Chemistry 2020 |

