 Open Access Article
Graphitic carbon nitride with thermally-induced nitrogen defects: an efficient process to enhance photocatalytic H2 production performance†
Guangzhi Dong ab,
Yun Wena,
Huiqing Fan
 *a,
Chao Wang
 ac,
Zhenxiang Cheng
 b,
Mingchang Zhanga,
Jiangwei Maa and
Shujun Zhang
 b
b
aState Key Laboratory of Solidification Processing, School of Materials Science and Engineering, Northwestern Polytechnical University, Xi'an, 710072, PR China. E-mail: hqfan@nwpu.edu.cn
bInstitute for Superconducting and Electronic Materials, Australia Institute of Innovative Materials, University of Wollongong, Wollongong, 2522, Australia
cDepartment of Chemical Engineering, University College London, Torrington Place, London WC1E 7JE, UK
First published on 15th May 2020
Abstract
Graphitic carbon nitride (g-C3N4, CN) with nitrogen vacancies was synthesized by a controlled thermal etching method in a semi-closed air-conditioning system. The defect-modified g-C3N4 shows an excellent photocatalytic performance demonstrated by water splitting under visible light irradiation. With proper heat-treatment durations such as 2 h (CN2) and 4 h (CN4) at 550 °C, the hydrogen production rates significantly increase to 100 μmol h−1 and 72 μmol h−1, which are 11 times and 8 times the rate of the pristine CN (8.8 μmol h−1) respectively. The excellent hydrogen production performance of nitrogen defect modified CN2 is due to the synergy effect of the decreased band gap, enlarged specific surface area and increased separation/migration efficiency of photoinduced charge carriers. This simple defect engineering method provides a good paradigm to improve the photocatalytic performance by tailoring the electronic and physical structures of g-C3N4.
1. Introduction
Solar energy is one of the promising renewable resources to meet sustainable energy development. The utilization of solar energy has aroused extensive attention over decades.1,2 Hydrogen (H2) evolution by splitting water under solar light has been regarded as an efficient strategy to utilize the solar energy.3–5 Therefore, developing proper photocatalysts has been actively studied in recent years.6–8 Graphitic carbon nitride (g-C3N4), as a new layered compound, is found to possess many merits, including appropriate band structure, high thermal and chemical stability and visible-light activity.2,9–11 Nonetheless, the shortcomings, such as poor quantum conversion efficiency, high recombination of photogenerated carriers and small specific surface area, greatly limit the application of bulky g-C3N4 in water splitting.12,13 Therefore, numerous approaches,14 including exfoliation,15–17 structural modification18–20 and nano/microstructure design,21–23 have been developed to enhance the photoactivity of g-C3N4. All these above-mentioned methods tune the band structure and accelerate the migration and separation of photoinduced charge carriers, however, they suffer from complicate synthesis or limited light harvesting. Thus, seeking simple way to tailor the electronic structure and enlarge visible light harvesting range is desired for g-C3N4.Very recently, atomic level modification has attracted substantial interests owing to its good effect in photocatalysis.24 For instance, substitution atoms (heteroatoms: O,25 P,4 N26) could either provide extra delocalized electrons or construct internal electric field to accelerate the separation of charge carries. In addition, interstitial atoms27 as well as carbon/nitrogen defects28,29 for two-dimension (2D) layered g-C3N4 play important role in promoting the performance in photocatalysis due to the hindrance of the recombination of photoinduced carries and extending the visible-light adsorption. Especially, among these works, nitrogen vacancies have many unique merits in visible-light harvesting,28,30 which act as a trap to capture the carries and introducing defect energy level. Accordingly, efforts have been made to effectively facilitate the separation of charge carriers through introducing point defects. For instance, it was reported that directly heating precursor (urea, melamine) and alkali can dramatically enlarge the range of light harvesting by decreasing the conduction band (CB) minimum.31 Post heating in ammonia/hydrogen or in other inert atmosphere is an alternative way to realize the introduction of defects with the intent of promoting red-shift of light absorption.28,32,33 One of the most important tasks is to explore an environmental friendly and low-cost way to enhance the photoreactivity through defects controlling, the behind mechanism of the introduction of defects needs to be established to in-depth understand the process of defects modification.
In this work, a simple method was developed to introduce nitrogen defects into g-C3N4 by post-heating raw carbon nitride in a semi-closed system (only air out) filled with air. This air-condition method makes the thermal-treatment process safer, cheaper and more convenient than the reducing gas treatment. With increasing the annealing time, the optical absorption range of the thermal treated polymeric carbon nitride (defects modified g-C3N4) exhibits a slight red-shift at first, followed by a remarkable blue-shift. Combined with the elemental analysis (EA) and X-ray photoelectron spectroscopy (XPS), it suggests that the N vacancies have an enormous effect on suppressing the recombination of charge carriers. The modified electronic structure and enlarged specific surface area play an important role in improving photocatalytic hydrogen evolution. This method may provide a direct way to study thermal treatment and promote the application of defect engineering in other semiconductors.
2. Experimental
2.1 Synthesis of g-C3N4
Pristine graphitic carbon nitride (g-C3N4) was synthesized by thermal treatment of dicyandiamide (DCDA) at 550 °C for 4 h with a ramp rate of 5 °C min−1, which is similar to our previous works.16,34,35 The obtained bulk carbon nitride was then milled into powders in an agate mortar.2.2 Synthesis of defects modified g-C3N4
The defects modified g-C3N4 was prepared by post-heating raw g-C3N4 powders in a semi-closed tube furnace filled with air. 1.5 g carbon nitride powder was put in a porcelain boat and placed in a tube furnace, and one end of the tube was sealed and the other was connected with a hose in a glass of deionized water. Subsequently, the tube furnace was heated to 550 °C for x = 2 or 4 h (characteristic times) with a ramp rate of 5 °C min−1. The obtained samples were denoted as CNx (x means hour duration of thermal treatment).2.3 Materials characterizations
The phase structure was investigated by X-ray diffraction diffractometer (XRD; X'pert, Philips Eindhoven, The Netherlands) with Cu Kα irradiation. Fourier transform infrared spectra were performed on a spectrometer (FT-IR; TENSOR27, Bruker, Billerica, MA, USA). The chemical composition was studied by X-ray photoelectron spectroscopy (XPS; ESCALAB220i-XL, Thermo Scientific, Waltham, MA, USA) using Al Kα radiation as the excitation source. The optical properties were investigated by ultraviolet-visible spectrophotometer (UV-vis; UV-3600, Shimadzu, Tokyo, Japan). Photoluminescence spectra were recorded on a fluorescence spectrophotometer (PL; FLSP-920, Edinburgh Instruments, Edinburg, UK) with an excitation wavelength of 337 nm. The morphology of the samples was examined by scanning electron microscope (FE-SEM; JSM-6701F, JEOL, Tokyo, Japan) and transmission electron microscope (JEM-3010, JEOL, Tokyo, Japan). Nitrogen adsorption/desorption isotherms were performed using surface area analyzer (V-sorb 2800P, Gold APP Instruments, Beijing, China). Photoelectrochemical properties were characterized by electrochemical workstation (CHI 660E, CH Instruments, Shanghai, China) in a standard three-electrode cell with 0.5 M Na2SO4 solution.2.4 Photocatalytic performance measurement
The photocatalytic performance is evaluated by hydrogen evolution from water splitting under visible light irradiation, which were carried out in a quartz reaction vessel connected to a glass gas-circulation system. 50 mg photocatalysts was dispersed in 10 wt% triethanolamine solution. After vigorously stirring for 30 min, 3 wt% Pt was deposited on the surface of C3N4 as co-catalyst using H2PtCl6 as precursor though in situ photodeposition. Prior to reaction, the system was vacuumed several times to remove air completely. A 300 W xenon lamp (MAX-302, Asahi Spectra, Torrance, CA, USA) with a cut-off filter (λ > 400 nm) was chosen as the light source, and the system was maintained at 10 °C. The rate of hydrogen evolution was determined by a gas chromatography.3. Results and discussion
3.1 Phase structure and chemical composition
The phase structure of the as-prepared samples was investigated by X-ray diffraction, as shown in Fig. 1a. The XRD patterns exhibit two characteristic peaks centered at 13.1° and around 27.5°, which are ascribed to the in-planar repeat motif and the interlayer periodic stacking of g-C3N4 sheets, respectively.36 Additionally, the sharp peak at 27.5° assigned to the (002) crystal planes shifts to higher 2θ angles with increasing the treatment time, implying a gradually reduced crystal plane distance originated from the thermal treatment.34,37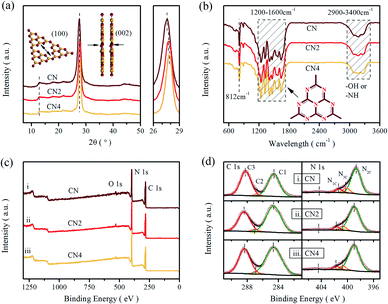 | ||
| Fig. 1 (a) XRD patterns, (b) FT-IR spectra, (c) XPS survey spectra, and (d) high resolution C 1s and N 1s XPS spectra of CN, CN2, and CN4. | ||
Fourier transform infrared spectra (FT-IR) were carried out to illustrate the phase structure of the samples (Fig. 1b). All the samples show a sharp peak at 812 cm−1 assigned to the bending mode of tri-s-triazine units,38 and a band in the range of 1200–1600 cm−1 relates to the stretching vibration mode of heptazine rings.36,39 Moreover, the fingerprint band in 2900–3400 cm−1 can be attributed to the absorbed H2O and terminal amino group (–NHx).40,41 These results further confirmed the basic structure of carbon nitride was maintained during the thermal treatment, even though some minor changes can be observed. The peak at 812 cm−1 and the broad band over 2900–3400 cm−1 are both weakened as the thermal treatment time increased, implying that the decrease of the amino group and the decomposition of the CN heterocycles. Besides, the peaks of stretching vibration mode for tri-s-triazine rings are much sharper than raw g-C3N4, indicating the formation of thin layered structure.16 These changes illustrate that the thermal treatment can reduce the terminal amino and produce thin layered structure.
To further confirm the reduction of the amino group, the X-ray photoelectron spectroscopy test and element analysis (EA) were performed, as shown in Fig. 1c and d. It is clear that the XPS shows two sharp peaks (assigned to C 1s and N 1s) and a small peak (related to O 1s). In Fig. 1d, the enlarged XPS spectra shows that the C 1s peak is deconvoluted into three peaks centered at 284.6 eV, 287.11 eV and 288.4 eV by Gaussian curve fitting, which can be attributed to foreign graphitic carbon, sp2-hybridized carbon connected to primary or secondary amino group and sp2-hybridized carbon in the heteroaromatic ring, respectively.42–44 Similarly, three peaks deconvoluted from N 1s spectra located at 398.96 eV, 400.68 eV and 401.66 eV are assigned to sp2-hybridized nitrogen in triazine rings (N2C; C–N![[double bond, length as m-dash]](https://www.rsc.org/images/entities/char_e001.gif) C), tertiary nitrogen (N3C; N–(C)3) and amino group (N1C; –NHx).18,31,45 The area ratios of the obtained peaks are listed in the Table S1,† exhibiting the content variation of nitrogen in different status. The ratios of the sp2-hybridized nitrogen to the tertiary nitrogen are 6.61, 5.66 and 6.63, respectively. Meanwhile, from the high resolution of O 1s spectra (Fig. S1†), all the samples exhibit two peaks centered at 532.0 eV and 533.4 eV, which originate from the absorbed H2O and O
C), tertiary nitrogen (N3C; N–(C)3) and amino group (N1C; –NHx).18,31,45 The area ratios of the obtained peaks are listed in the Table S1,† exhibiting the content variation of nitrogen in different status. The ratios of the sp2-hybridized nitrogen to the tertiary nitrogen are 6.61, 5.66 and 6.63, respectively. Meanwhile, from the high resolution of O 1s spectra (Fig. S1†), all the samples exhibit two peaks centered at 532.0 eV and 533.4 eV, which originate from the absorbed H2O and O![[double bond, length as m-dash]](https://www.rsc.org/images/entities/char_e001.gif) C, respectively.46 The result of the element analysis is a convincing proof of the existence of nitrogen defects. The mass ratios of N
C, respectively.46 The result of the element analysis is a convincing proof of the existence of nitrogen defects. The mass ratios of N![[thin space (1/6-em)]](https://www.rsc.org/images/entities/char_2009.gif) :
:![[thin space (1/6-em)]](https://www.rsc.org/images/entities/char_2009.gif) C for the samples from element analysis results are 1.767, 1.711 and 1.710 (Table S2†), respectively, suggesting that the decrease of nitrogen content after heat treatment. Furthermore, the variation of the surface N
C for the samples from element analysis results are 1.767, 1.711 and 1.710 (Table S2†), respectively, suggesting that the decrease of nitrogen content after heat treatment. Furthermore, the variation of the surface N![[thin space (1/6-em)]](https://www.rsc.org/images/entities/char_2009.gif) :
:![[thin space (1/6-em)]](https://www.rsc.org/images/entities/char_2009.gif) C ratios from XPS results are 2.327, 2.288 and 2.252, respectively. The decreasing N
C ratios from XPS results are 2.327, 2.288 and 2.252, respectively. The decreasing N![[thin space (1/6-em)]](https://www.rsc.org/images/entities/char_2009.gif) :
:![[thin space (1/6-em)]](https://www.rsc.org/images/entities/char_2009.gif) C ratios also indicating that the existence of nitrogen vacancies after the post-thermal treatment. Combined with XPS result from CN to CN2, it is analyzed that the missing N atoms mainly originate from amino group and some two-coordinated nitrogen. There is no obvious change in mass ratio and distribution of amino from CN2 to CN4, which is mainly attributed to the reduction of C and N by etching the heteroaromatic rings.
C ratios also indicating that the existence of nitrogen vacancies after the post-thermal treatment. Combined with XPS result from CN to CN2, it is analyzed that the missing N atoms mainly originate from amino group and some two-coordinated nitrogen. There is no obvious change in mass ratio and distribution of amino from CN2 to CN4, which is mainly attributed to the reduction of C and N by etching the heteroaromatic rings.
3.2 Optical properties
Ultraviolet-visible light absorption spectra are shown in Fig. 2a and b. The typical absorption spectra of semiconductor can be observed with the absorption edge located at 460 nm for CN, 466 nm for CN2 and 462 nm for CN4, which are in accordance with the red-shift from CN to CN2 and blue-shift from CN2 to CN4. The corresponding band gaps are 2.71 eV for CN, 2.65 eV for CN2 and 2.86 eV for CN4 (the gap between defects energy level and valence band for CN4 is 2.68 eV). Combined with the valence band spectra, the schematic band structure was plotted and shown in Fig. S2.† The conduction bands are located at −1.00 eV, −0.83 eV and −0.95 eV for CN, CN2 and CN4. Both conduction band and valence band first shift down for CN2 mainly due to the effect of the nitrogen defects, while they shift up from CN2 to CN4 as a result of the synergetic effects of quantum confinement effect and nitrogen defects.33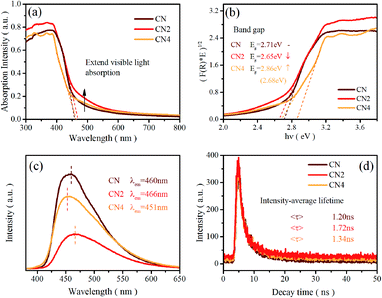 | ||
| Fig. 2 (a) UV-vis diffuse reflectance spectra, (b) (F(R) × E)1/2 versus hν plot, (c) PL spectra, and (d) time-resolved fluorescence decay spectra of CN, CN2 and CN4. | ||
Photoluminescence spectra were employed to investigate the radiative recombination efficiency of the photogenerated charge carriers. As can be seen in Fig. 2c, the peak intensity of the defects-modified g-C3N4 is obviously quenched, illustrating that the nitrogen defects play an important role in improving charge carrier's separation efficiency. The decrease of peak intensity from CN to CN2 may be mainly due to the new defects-induced surface states to form the carrier traps, which can capture the carriers and inhibit the recombination of carriers. Nevertheless, the intensity of CN4 increases from CN2 even if it is still weaker than pristine CN. This result suggests that thermal treatment would destroy the tri-s-triazine rings leading to reduced charge carrier's separation efficiency, which is consistent with the analysis result from the EA and XPS spectra. The emission peaks of the samples, regarded as the band-to-band recombination of holes and electrons,28,47 are located at 459 nm (2.70 eV), 466 nm (2.66 eV) and 451 nm (2.75 eV), which is in accordance with the variation trend of the band gap. The analysis of PL spectra shows that the defect state structure is benefit to the separation of carriers, resulting in low recombination efficiency of photo excited electron hole pairs and eventually higher photocatalytic activity.
Time-resolved photoluminescence spectra (TRPL) were also performed on a fluorescence spectrophotometer, which exhibit an exponential decay of carrier lifetime, as shown in Fig. 2d. The spectra were fitted using a two-exponential decay function with short and long lifetimes τ1 and τ2, corresponding to the trapping of electrons by the defects at short and long distances, respectively. The components of the lifetime are given in Table S3.† The average lifetime (<τ>) can be calculated as 1.20 ns, 1.72 ns, and 1.34 ns, for CN, CN2 and CN4. The average charge lifetimes of defects modified g-C3N4 are longer than pristine carbon nitride clearly suggesting that the nitrogen defects prolong the charge lifetimes of the photocatalysts. At the same time, the charge lifetime of CN4 decreases in comparison to CN2, which is possibly due to the charge localization. The nitrogen defects promote the charge carriers migration from the inner to the surface to participate in the water-splitting reactions.
3.3 Morphology and microstructure evolution
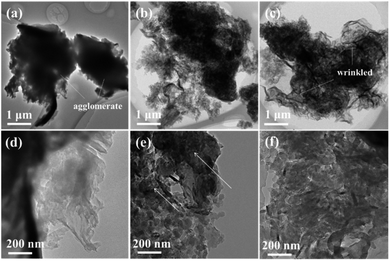
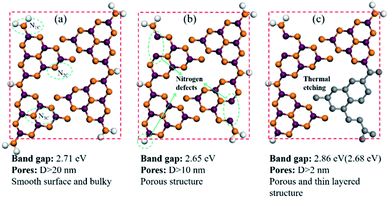
The sample was prepared by directly heating raw graphitic carbon nitride in a semi-sealed system for different times at 550 °C, and the yield of as-prepared samples decreased as the treat time increased. The comparison of volume and color for 300 mg of CN, CN2, and CN4 is shown in Fig. S3.† The colors of the as-prepared samples show an obvious change. Contrast to raw materials, the color of the treated CN2 shows darker color. Moreover, the TEM images and SEM images are the most intuitionistic evidence to illustrate the changes of morphology. It's obvious that the thermal treatment had a significant influence on the defects modified g-C3N4 (Fig. 3). As can be seen, the pristine g-C3N4 consist of bulky aggregations with a relatively smooth surface, and the rough lateral edge illustrates that they are formed by multilayer stacking. Meanwhile, thinner layered structure was observed in defects modified g-C3N4. With the further increase of treat time, different from the CN2, the edge of the CN4 is curling and wrinkled, which suggests further reduced thickness. SEM images of Fig. S4† shows that the particles of the pristine carbon nitride possess a much smoother surface, while the particles of the CN2 keep this feature and the CN4 possesses a thinner layered structure with clearly visible pores. Atomic force microscopy was observed on CN4 as the representative to further confirm that the nanosheets were obtained (Fig. S5†). Result shows that thickness of the sheets is around 5.6 nm, implying the formation of thin layered structure.In order to illustrate the evolution of layer thickness with heat treatment, dispersing stability experiment was carried out (Fig. S6†). It is worth to note that the thermal-treated samples were much more stable in suspension after natural sedimentation for 20 days judging by the light transmittance. After natural sedimentation for 15 days, the obtained CN4 is more stable than CN2 and CN which might be owing to the larger specific surface area originated from lower thickness and porous structure. Besides that, the tail gas solution is alkaline which suggests the post-treatment can reduce lattice N into ammonia (Fig. S7†). Obviously, because no adventitious hydrogen atoms have been provided, the H atoms in ammonia can be determined mainly from the primary or secondary amino group (N1C). This result is in accordance with the decrease of amino from the XPS results and the others' works.48–50 With further heat treatment, the tri-s-triazine units are destroyed due to the collapse of incomplete CN heterocycles (Fig. 4). The gases release during the treatment and exfoliate the agglomerates into thin layers. Correspondingly, the surface area was determined by N2 adsorption–desorption analysis (Fig. S8†). After post-heating, the specific surface area of the samples was gradually increased from 4.05 m2 g−1 of CN to 12.79 m2 g−1 of CN2 and 21.26 m2 g−1 of CN4, the corresponding pore size distribution curves calculated by the adsorption branches are provided. As we can see, there is a little bit difference of the pore size distribution between the defects modified g-C3N4 and pristine g-C3N4. The minimum diameter of the pores has reduced to 2 nm of CN4 and 5 nm of CN2 from around 15 nm of the pristine CN. The pore distribution curve of CN4 has an obvious peak at the range of 2–4 nm and 6–50 nm, the former emerges from the destruction of the heptazine ring and the breaking of the ammonia bubbles, and the latter results from the decomposition of oligomer fragments and the collapse of the wall of the primary pores. From the above results, it can be found that this post-treating process is a dynamic process. During this process, the nitrogen defects were introduced into the texture through releasing ammonia and result in incomplete rings at first, and then the incomplete units were more easily destroyed during further thermal treatment.
3.4 Electronic properties
Electron paramagnetic resonance (EPR) measurements were performed at 77 K to investigate the structural defects in the modulated graphitic carbon nitride. All samples show one single Lorentzian line, which is related to lone pair electrons on sp2-carbon within the heptazine rings.33,51 As shown in Fig. 5a, the EPR signal intensity of these samples displays a trend of first enhancement and then weakening with the increasing of treatment time. Nitrogen vacancies would introduce more lone pair electrons and result in stronger EPR intensity. Meanwhile, the broken of heptazine rings would reduce the concentration of delocalized electrons and exhibit reduced EPR intensity in comparison with CN2 consequently. Moreover, the defects modulated g-C3N4 exhibits a stronger intensity than CN, clearly implying the increase of delocalized electrons. It is noteworthy that this trend is in good consistent with previous analysis.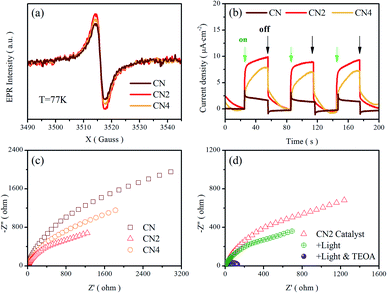 | ||
| Fig. 5 (a) EPR spectra, and (b) transient photocurrent response, and (c) Nyquist plots of CN, CN2 and CN4. (d) Nyquist plots of CN2 at different condition. | ||
To further investigate the migration and separation efficiency of charge carriers, the transient photocurrent response and electrochemical impedance spectroscopy (EIS) tests were carried out (Fig. 5b–d). Compared with the raw g-C3N4, the treated g-C3N4 shows remarkably enhanced photocurrent density, implying the outstanding photoelectric response under visible light illumination and more efficient separation of photoinduced electron–hole pairs.52 For the EIS Nyquist plots of Fig. 5c, the smaller arc radiuses of the CN2 and CN4 suggest a smaller charge migration resistance. To better simulate the change of the charge transfer resistance, the EIS spectra of CN2 were also performed under visible-light irradiation and after adding 10% (mass ratio) triethanolamine (TEOA) in the electrolyte (0.5 mol L−1 Na2SO4 solution), as shown in Fig. 5d. Under the illumination of visible light, the resistance reduces clearly due to the photovoltage reduces the energy barriers of charge migration. Moreover, it is very clear that the impedance attains a minimum with the coexistence of light and triethanolamine, demonstrating that the triethanolamine as a scavenger can trap the holes to free the photoinduced electrons.
3.5 Photocatalytic performance
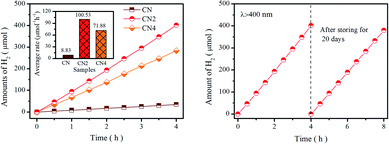
Photocatalytic performance was tested by water splitting under visible light irradiation using 3 wt% Pt as co-catalyst and 10 vol% triethanolamine as scavenger. Photocatalytic hydrogen evolution rate of catalysts is shown in Fig. 6a. Obviously, CN2 and CN4 show remarkable enhancement in H2 yields, while the CN2 produces a total amount of 401.57 μmol (100.53 μmol h−1) and CN4 produce 284.04 μmol (71.88 μmol h−1) after 4 hours of visible light irradiation. The superior photocatalytic performance of CNx indicates that the thermal treatment is highly beneficial to optimize the optical and electronic properties. Moreover, the apparent quantum yield (AQY) values are carried out by splitting water using monochromatic light illuminating. As shown in Fig. S9,† the AQY values of CN2 reached 10.38% at 420 nm and 0.53% at 550 nm, which is in accordance with the trend of the light harvesting result. At the same time, the CN2 exhibits higher photocatalytic activity than the CN4, which is most probably due to the synergistic effects of optical performance and the separation efficiency of photoinduced charge carriers. Besides, compared with the pristine CN, larger specific surface area can provide more reactive sites and the pore structure reduces the diffusion length of carriers from interior to the outer surface. In addition, stability is another key factor to the commercial application of the photocatalyst. The cycling test was carried out under the same condition after storing in the solution for 20 days to evaluate the stability of CN2 photocatalyst. As displays in Fig. 6b, the H2 production rate didn't exhibit significant decrease even the experiment was repeated after three weeks, which confirm the enhanced stability of nitrogen vacancies modified g-C3N4.Based on the above results, we could conclude that the nitrogen defects play a key role in enhancing the photocatalytic performance. It has been widely accepted that excellent photocatalytic performance is strongly relying on three crucial factors: (1) hindered radiative recombination of photoinduced charge carriers (2) increased specific surface area (3) tuned band structure and enlarged visible light harvesting capacity. During thermal etching in a semi-closed system, nitrogen defects was produced by releasing ammonia as a result of thermal treatment, and then, further treatment leads to the destruction of tri-s-triazine and thin layered structure. In this evolution process, the introduction of nitrogen defects and the breakage caused by thermal etching will modify the electronic structure, expand the range of light absorption and suppress the recombination of carriers. It should be noted that the introduction of defects can also damage the stable structure, which directly leads to the broken of the tri-s-triazine after the thermal treatment. To sum up, the nitrogen defects can be introduced into g-C3N4 by proper duration of thermal-treatment to reduce the energy barrier of charge migration and prolong lifetime of photoinduced charge carriers, which all contribute to the improvement of photocatalytic performance of the defect modified g-C3N4.
4. Conclusions
In summary, an effective thermal-treatment method in a semi-closed system was developed for the preparation of defects modified g-C3N4. Nitrogen defects were controllably introduced into the framework of g-C3N4 and the porous thin-layered structure was formed by adjusting the thermal-treated duration. Compared with CN (pristine g-C3N4), the hydrogen evolution rate of CN2 (g-C3N4 treated for 2 h) has been significantly improved to 100 μmol h−1 from 8 μmol h−1 of CN, and then slightly decrease to72 μmol h−1 for CN4 when the heat treatment duration was prolonged to 4 h. The underlying origins associated with the fluctuation of hydrogen production performance include the heat treatment induced modification of bandgap, structure, specific surface area and photogenerated carrier lifetime, as well as their synergistic effects. During this process, short-term heat treatment (CN2) narrows the band gap (∼2.65 eV) by introducing defect states resulted in enhanced visible light responses, while excessive treatment duration (CN4) would severely destruct the framework of graphitic carbon nitride. In addition, the reduction of charge transfer barrier and the longer of photo-induced carrier lifetime are also critical for hydrogen production performance. The method developed in this work demonstrates an efficient and simple process to the predictable modification of electronic structure and the contrivable regulation of hydrogen production performance in related material systems.Conflicts of interest
There are no conflicts to declare.Acknowledgements
This work has been supported by the National Natural Science Foundation (51672220, 51902258), the Fundamental Research Funds for the Central Universities of NPU (3102019GHXM002), the State Key Laboratory of Solidification Processing Project (2019-TZ-04) of China, the China Postdoctoral Science Foundation (2019M653729), the Shaanxi Province Postdoctoral Science Foundation (2017BSHEDZZ07), and the Natural Science Foundation of Shaanxi Province (2019JQ-621). We would also like to thank the Analytical & Testing Center of Northwestern Polytechnical University.References
- A. Kudo and Y. Miseki, Chem. Soc. Rev., 2009, 38, 253–278 RSC.
- M. Nasir, G. Yang, I. Ayub, S. Wang, L. Wang, X. Wang, W. Yan, S. Peng and S. Ramakarishna, Appl. Catal., B, 2019, 257, 117855 CrossRef CAS.
- J. Ran, J. Zhang, J. Yu, M. Jaroniec and S. Qiao, Chem. Soc. Rev., 2014, 43, 7787–7812 RSC.
- J. Ran, T. Ma, G. Gao, X. Du and S. Qiao, Energy Environ. Sci., 2015, 8, 3708–3717 RSC.
- S. Cao and J. Yu, J. Phys. Chem. Lett., 2017, 5, 2101–2107 CrossRef PubMed.
- H. Shi, G. Chen, C. Zhang and Z. Zou, ACS Catal., 2014, 4, 3637–3643 CrossRef CAS.
- P. Song, S. Liang, J. Cui, D. Ren, R. Duan, Q. Yang and S. Sun, Catal. Sci. Technol., 2019, 9, 5150–5159 RSC.
- S. Cao, C. Wang, G. Wang, Y. Chen, X. Lv and W. Fu, RSC Adv., 2020, 10, 5930–5937 RSC.
- X. Wang, K. Maeda, A. Thomas, K. Takanabe, G. Xin, J. Carlsson, K. Domen and M. Antonietti, Nat. Mater., 2008, 8, 76–80 CrossRef PubMed.
- X. Liu, F. Pang, M. He and J. Ge, Nano Res., 2017, 10, 3638–3647 CrossRef CAS.
- X. Bi, S. Yu, E. Liu, X. Yin, Y. Zhao and W. Xiong, RSC Adv., 2020, 10, 524–532 RSC.
- F. Dong, Z. Zhao, T. Xiong, Z. Ni, W. Zhang, Y. Sun and W. Ho, ACS Appl. Mater. Interfaces, 2013, 5, 11392–11401 CrossRef CAS PubMed.
- W. Iqbal, C. Dong, M. Xing, X. Tan and J. Zhang, Catal. Sci. Technol., 2017, 7, 1726–1734 RSC.
- F. Kessler, Y. Zheng, D. Schwarz, C. Merschjann, W. Schnick, X. Wang and M. Bojdys, Nat. Rev. Mater., 2017, 2, 17030 CrossRef CAS.
- X. Dong and F. Chen, J. Mater. Chem. A, 2015, 3, 23642–23652 RSC.
- L. Ma, H. Fan, M. Li, H. Tian, J. Fang and G. Dong, J. Mater. Chem. A, 2015, 3, 2244–22412 Search PubMed.
- L. Fang, Y. Li, P. Liu, D. Wang, H. Zeng, X. Wang and H. Yang, ACS Sustainable Chem. Eng., 2017, 5, 2039–2043 CrossRef CAS.
- W. Che, W. Cheng, T. Yao, F. Tang, W. Liu, H. Su, Y. Huang, Q. Liu, J. Liu, F. Hu, Z. Pan and Z. Sun, J. Am. Chem. Soc., 2017, 139, 3021–3026 CrossRef CAS.
- Y. Yu, W. Yan, W. Gao, P. Li, X. Wang, S. Wu, W. Song and K. Ding, J. Mater. Chem. A, 2017, 5, 17199–17203 RSC.
- Y. Zhou, L. Zhang, W. Huang, Q. Kong, X. Fan, M. Wang and J. Shi, Carbon, 2016, 99, 111–117 CrossRef CAS.
- Z. Tong, D. Yang, Y. Sun, Y. Nan and Z. Jiang, Small, 2016, 12, 4093–4101 CrossRef CAS PubMed.
- C. Liu, H. Huang, L. Ye, S. Yu, N. Tian, X. Du, T. Zhang and Y. Zhang, Nano Energy, 2017, 41, 738–748 CrossRef CAS.
- X. Li, B. Wang, X. Shu, D. Wang, G. Xu, X. Zhang, J. Lv and Y. Wu, RSC Adv., 2019, 9, 15900–15909 RSC.
- A. D. Fortes, E. Suard and K. S. Knight, Science, 2011, 331, 742–746 CrossRef CAS PubMed.
- Y. Zeng, X. Liu, C. Liu, L. Wang, Y. Xia, S. Zhang, S. Luo and Y. Pei, Appl. Catal., B, 2018, 224, 1–9 CrossRef CAS.
- J. Fang, H. Fan, M. Li and C. Long, J. Mater. Chem. A, 2015, 3, 13819–13826 RSC.
- T. Xiong, W. Cen, Y. Zhang and F. Dong, ACS Catal., 2016, 6, 2462–2472 CrossRef CAS.
- P. Niu, L. Yin, Y. Yang, G. Liu and H. Cheng, Adv. Mater., 2014, 26, 8046–8052 CrossRef CAS PubMed.
- J. Di, J. Xia, X. Li, M. Ji, H. Xu, Z. Chen and H. Li, Carbon, 2016, 107, 1–10 CrossRef CAS.
- P. Niu, M. Qiao, Y. Li, L. Huang and T. Zhai, Nano Energy, 2018, 44, 73–81 CrossRef CAS.
- H. Yu, R. Shi, Y. Zhao, T. Bian, Y. Zhao, C. Zhou, G. Waterhouse, L. Wu, C. Tung and T. Zhang, Adv. Mater., 2017, 29, 1605148 CrossRef PubMed.
- P. Yang, J. Zhao, W. Qiao, L. Li and Z. Zhu, Nanoscale, 2015, 7, 18887–18890 RSC.
- P. Niu, L. Zhang, G. Liu and H. Cheng, Adv. Funct. Mater., 2012, 22, 4763–4770 CrossRef CAS.
- L. Ma, H. Fan, J. Wang, Y. Zhao, H. Tian and G. Dong, Appl. Catal., B, 2016, 190, 93–102 CrossRef CAS.
- G. Dong, H. Fan, K. Fu, L. Ma, S. Zhang, M. Zhang, J. Ma and W. Wang, Composites, Part B, 2019, 162, 369–377 CrossRef CAS.
- J. Qian, J. Yan, C. Shen, F. Xi, X. Dong and J. Liu, J. Mater. Sci., 2018, 53, 12103–12114 CrossRef CAS.
- Y. Wen, H. Fan, L. Ning, C. Wang, B. Hu, J. Ma and K. Cui, J. Mater. Sci., 2019, 54, 1462–1474 CrossRef CAS.
- F. Cheng, H. Wang and X. Dong, Chem. Commun., 2015, 51, 7176–7179 RSC.
- S. Hu, L. Ma, Y. Xie, F. Li, Z. Fan, F. Wang, Q. Wang, Y. Wang, X. Kang and G. Wu, Dalton Trans., 2015, 44, 2889–2897 Search PubMed.
- H. Xu, J. Yan, X. She, L. Xu, J. Xia, Y. Xu, Y. Song, L. Huang and H. Li, Nanoscale, 2014, 6, 1406–1415 RSC.
- X. Bai, J. Li, C. Cao and S. Hussain, Mater. Lett., 2011, 65, 1101–1104 CrossRef CAS.
- N. Nie, L. Zhang, J. Fu, B. Cheng and J. Yu, Appl. Surf. Sci., 2018, 441, 12–22 CrossRef CAS.
- Q. Xu, B. Cheng, J. Yu and G. Liu, Carbon, 2017, 118, 241–249 CrossRef CAS.
- B. Sun, H. Li, H. Yu, D. Qian and M. Chen, Carbon, 2017, 117, 1–11 CrossRef CAS.
- J. S. Kim, J. W. Oh and S. I. Woo, Int. J. Hydrogen Energy, 2017, 42, 5485–5495 CrossRef CAS.
- X. She, J. Wu, J. Zhong, H. Xu, Y. Yang, R. Vajtai, J. Lou, Y. Liu, D. Du, H. Li and P. Ajayan, Nano Energy, 2016, 27, 138–146 CrossRef CAS.
- G. Liu, G. Zhao, W. Zhou, Y. Liu, H. Pang, H. Zhang, D. Hao, X. Meng, P. Li, T. Kako and J. Ye, Adv. Funct. Mater., 2016, 26, 6822–6829 CrossRef CAS.
- P. Niu, G. Liu and H. Cheng, J. Phys. Chem. C, 2012, 116, 11013–11018 CrossRef CAS.
- Y. Kang, Y. Yang, L. Yin, X. Kang, L. Wang, G. Liu and H. Cheng, Adv. Mater., 2016, 28, 6471–6477 CrossRef CAS PubMed.
- Z. Mo, H. Xu, Z. Chen, X. She, Y. Song, J. Wu, P. Yan, L. Xu, Y. Lei, S. Yuan and H. Li, Appl. Catal., B, 2018, 225, 154–161 CrossRef CAS.
- Y. Li, M. Yang, Y. Xing, X. Liu, Y. Yang, X. Wang and S. Song, Small, 2017, 13, 1701552 CrossRef PubMed.
- Y. Hong, C. Li, Z. Fang, B. Luo and W. Shi, Carbon, 2017, 121, 463–471 CrossRef CAS.
Footnote |
| † Electronic supplementary information (ESI) available. See DOI: 10.1039/d0ra01425g |
| This journal is © The Royal Society of Chemistry 2020 |

