 Open Access Article
Continuous flow synthesis of phase transition-resistant titania microparticles with tunable morphologies†
Zachary S. Campbell ,
Daniel Jackson,
Jacob Lustik,
Amur K. Al-Rashdi,
Jeffrey A. Bennett,
Fanxing Li
 and
Milad Abolhasani
 *
*
Department of Chemical and Biomolecular Engineering, North Carolina State University, 911 Partners Way, Raleigh, NC, USA 27695. E-mail: abolhasani@ncsu.edu; Web: http://www.abolhasanilab.com
First published on 26th February 2020
Abstract
Titania microspheres have attracted substantial attention for a variety of applications, including ion scavenging, catalysis, and energy generation, though most synthetic techniques are limited to a few basic morphologies and narrow size ranges. Here, an intensified microfluidic strategy for continuous synthesis of anatase titania microspheres is presented. In-flow photo crosslinking, incorporated with a flow reactor and polar aprotic solvent, enables access to precursor compositions up to an order of magnitude higher than those previously reported, with size tunability approaching two orders of magnitude. Morphological and surface area effects associated with precursor composition are explored, resulting in hollow, yolk–shell, macroporous, and dense titania microspheres containing no detectable rutile phase and possessing surface areas exceeding 350 m2 g−1 post calcination. Furthermore, effects of calcination temperature and time on the surface area, crystallinity and phase composition, and morphology of the synthesized titania microspheres are studied in detail. The synthesized microspheres are shown to remain completely in the anatase phase, even at temperatures up to 900 °C, far beyond the expected phase transition temperature. Thus, the breadth of attainable morphologies, specific surface areas, and phase compositions present a variety of intriguing substrate candidates for such applications as heterogeneous (photo) catalysis, adsorption and ion capture, electrochemistry, and photovoltaics.
Introduction
Titania (TiO2) possesses a variety of intriguing optical, physical, and chemical properties that make it an appealing substrate candidate for chemical (e.g., thermal/photo catalysis),1–7 electrochemical (e.g., batteries),8,9 photovoltaic (e.g., dye-sensitized solar cells),8,10 and adsorption (e.g. ion scavenging) applications.11,12 The breadth of applications has resulted in significant research efforts toward synthesis of high quality titania (i.e., size dispersity < 3% and surface area > 200 m2 g−1) with a variety of morphologies and length scales, ranging from films to nano- and microparticles.3,13,14 Special attention has been devoted to the synthesis of TiO2 microspheres due to their application in dye-sensitized solar cells, lithium ion batteries, and photocatalysis,9,14–17 using a variety of synthesis methods including solvothermal/sol–gel, emulsion, and deposition/etching strategies.14,18,19 Recently, microfluidic synthesis strategies offering more precise process control and enhanced heat and mass transfer rates compared to batch processes20,43 have emerged as an effective approach for the continuous synthesis of highly monodisperse particles,21–23 including polymeric24,25 and inorganic26–30,44,45 micro/nano-particles. Such microfluidic techniques have also been applied to synthesize TiO2 microspheres, enabling the synthesis of microparticles more than an order of magnitude larger than traditional synthetic methods.31–33However, to this point, strategies for synthesizing TiO2 microspheres in-flow have primarily relied on hydrolysis,31–33 which occurs at the interface between water and an immiscible oil phase in which the titanium precursor is dissolved. The interfacial hydrolysis process, which is triggered immediately after contacting the continuous phase (i.e., water), results in the formation of hollow titania shells,31–33 with no other morphologies synthesized with these techniques. Recently, our group has demonstrated that the interfacial hydrolysis reaction used in the production of TiO2 microspheres may be delayed via the use of a polar aprotic solvent (formamide) as the continuous phase rather than water.34 Utilizing a polar aprotic solvent makes it possible to delay the interfacial hydrolysis reaction, thus decoupling droplet formation from hydrolysis. Building on this approach, we herein demonstrate the effect of complete elimination of in-reactor interfacial hydrolysis coupled with in-reactor photocuring of the sacrificial polymer scaffold on the morphology and surface area of in-flow synthesized TiO2 microspheres, while utilizing precursor concentrations up to an order of magnitude higher than those used previously (5 wt% vs. 50 wt%).31–33 These concentrations enable synthesis of up to 8.2 g of calcined titania microparticles per day in a single-channel flow reactor. Furthermore, a wide range of particle sizes can be reached, ranging from <10 μm to 250 μm, greater than a 25-fold variation in particle diameter (Fig. S1†). Finally, the synthesized microspheres possessed exceptionally high specific surface areas (up to 362 m2 g−1) and a wide variety of morphologies, including hollow, yolk–shell, macroporous, and dense microspheres.
Experimental
Materials
Titanium(IV) butoxide (97%, reagent grade), ethoxylated trimethylolpropane triacrylate (ETPTA) (average Mn ∼ 428), Pluronic F108 (average Mn ∼ 14![[thin space (1/6-em)]](https://www.rsc.org/images/entities/char_2009.gif) 600), and Sudan Blue II were purchased from Sigma-Aldrich. Toluene (certified ACS) and molecular sieves (4A) were purchased from Fisher Scientific. Formamide (99.5+%, ACS reagent, nitrogen flushed) was purchased from Alfa Aesar. Darocur 4265 (Omnirad 4265) was purchased from IGM Resins USA, Inc. Deionized (DI) water was produced using a PURELAB Flex purification system (Elga). All chemicals were used as received.
600), and Sudan Blue II were purchased from Sigma-Aldrich. Toluene (certified ACS) and molecular sieves (4A) were purchased from Fisher Scientific. Formamide (99.5+%, ACS reagent, nitrogen flushed) was purchased from Alfa Aesar. Darocur 4265 (Omnirad 4265) was purchased from IGM Resins USA, Inc. Deionized (DI) water was produced using a PURELAB Flex purification system (Elga). All chemicals were used as received.
Precursor preparation
The dispersed phase precursor was prepared immediately before use in each experiment, where 3 mL batches were prepared for individual composition tests and a single 12 mL batch was prepared for the calcination tests to eliminate batch-to-batch variability. Titanium(IV) butoxide (97%, reagent grade, Sigma-Aldrich), ethoxylated trimethylolpropane triacrylate (ETPTA) (average Mn ∼ 428, Sigma-Aldrich), and toluene (certified ACS, Fisher Scientific) were mixed utilizing the volumes required to reach the desired precursor composition. Darocur 4265 (Omnirad 4265, IGM Resins USA, Inc.) was then added with an ETPTA![[thin space (1/6-em)]](https://www.rsc.org/images/entities/char_2009.gif) :
:![[thin space (1/6-em)]](https://www.rsc.org/images/entities/char_2009.gif) Darocur molar ratio of 2
Darocur molar ratio of 2![[thin space (1/6-em)]](https://www.rsc.org/images/entities/char_2009.gif) :
:![[thin space (1/6-em)]](https://www.rsc.org/images/entities/char_2009.gif) 1. As the precursor was utilized immediately, no Schlenk line or other special chemical handling methods were used other than storing the titanium(IV) butoxide reagent under inert gas. Dyed toluene was prepared by adding 40 mg of Sudan Blue II (Sigma-Aldrich) to 40 mL of toluene. The continuous phase was prepared by mixing 1 kg anhydrous formamide (99.5+%, ACS reagent, nitrogen flushed, Alfa Aesar) and 10.1 g of Pluronic F108 (average Mn ∼ 14
1. As the precursor was utilized immediately, no Schlenk line or other special chemical handling methods were used other than storing the titanium(IV) butoxide reagent under inert gas. Dyed toluene was prepared by adding 40 mg of Sudan Blue II (Sigma-Aldrich) to 40 mL of toluene. The continuous phase was prepared by mixing 1 kg anhydrous formamide (99.5+%, ACS reagent, nitrogen flushed, Alfa Aesar) and 10.1 g of Pluronic F108 (average Mn ∼ 14![[thin space (1/6-em)]](https://www.rsc.org/images/entities/char_2009.gif) 600, Sigma-Aldrich) in a 1 L glass bottle with FEP lines for venting and withdrawing the formamide + 1 wt% Pluronic F108 mixture in the cap. Molecular sieves (4A, Fisher Scientific) were added, the bottle was sealed, and the mixture was sparged with argon for 2 h by attaching a Schlenk line to the withdrawal tube. The mixture was then sonicated and left overnight to permit the Pluronic F108 to dissolve. When withdrawing the continuous phase, care was taken to prevent the introduction of moisture to the continuous phase by ensuring an inert atmosphere was maintained.
600, Sigma-Aldrich) in a 1 L glass bottle with FEP lines for venting and withdrawing the formamide + 1 wt% Pluronic F108 mixture in the cap. Molecular sieves (4A, Fisher Scientific) were added, the bottle was sealed, and the mixture was sparged with argon for 2 h by attaching a Schlenk line to the withdrawal tube. The mixture was then sonicated and left overnight to permit the Pluronic F108 to dissolve. When withdrawing the continuous phase, care was taken to prevent the introduction of moisture to the continuous phase by ensuring an inert atmosphere was maintained.
Microreactor
The flow-focusing microreactor was constructed by cutting the outer borosilicate glass capillary (1.5 mm outer diameter (OD), 1.12 mm inner diameter (ID), Friedrich and Dimmock) to 6 cm and fitting both ends with flexible Tygon sleeves (1/8′′ OD, 1/16′′ ID, McMaster-Carr) and 1/8′′ PEEK nuts and ferrules (IDEX). The capillary was then attached at each end to PEEK or ETFE T-junctions (0.05′′ ID, IDEX). Next, one end of two smaller capillaries (1 mm OD, 0.75 mm ID, Friedrich and Dimmock) were thermally constricted down to ∼400 μm using a Narishige PC-10 capillary puller. The inlet capillary was cut down to 4.5 cm in length and inserted into a section of 0.04′′ ID 1/16′′ OD FEP tubing (Microsolv), was fitted with a 1/16′′ PEEK nut and ferrule (IDEX) and inserted into one end of the reactor assembly. The other end of the FEP tubing was attached to a 4-way valve. Next, the outlet capillary was inserted into a 1 cm FEP sheath (1/16′′ OD, 0.04′′ ID, Microsolv) and was inserted into the reactor assembly until its constricted end was ∼400 μm from the tip of the inlet capillary. It was then tightened into place using a 1/16′′ PEEK nut and ferrule. Then, two sections of FEP tubing (0.02′′ ID, 1/16′′ OD, IDEX) were attached to the remaining ports of the T-junctions, and the other ends were fitted with Luer-lock fittings (IDEX) for attachment to stainless steel syringes (Harvard Apparatus). Finally, two FEP feed lines (0.02′′ ID, 1/16′′ OD, IDEX) with Luer-lock attachments and an FEP purge line (0.02′′ ID, 1/16′′ OD, IDEX) were attached to the remaining ports of the 4-way valve.Characterization
The in-flow synthesized titania microparticles were characterized using (i) scanning electron microscopy (FEI Verios 460L) to conduct size measurements post-calcination and study monodispersity and morphology, (ii) X-ray diffraction (Rigaku SmartLab X-Ray Diffractometer) to characterize crystallinity and crystal phase composition as a function of calcination time and temperature, and (iii) Brunauer–Emmett–Teller characterization (Micromeritics ASAP 2020) to evaluate specific surface area for microspheres synthesized using different precursor compositions, calcination temperatures, and calcination times.Results and discussion
Fig. 1 illustrates the developed microfluidic platform consisting of a collimated UV LED integrated with an axisymmetric flow-focusing microfluidic reactor.34,35,42 The flow reactor is constructed with two constricted capillaries oriented tip-to-tip sheathed by an outer capillary, creating an annulus (Fig. S2†). The titania precursor (i.e., dispersed phase) was prepared with four components: (i) titanium(IV) butoxide (TBT) as the titanium precursor, (ii) ethoxylated trimethylolpropane triacrylate (ETPTA) as a photocurable polymer to provide rigidity and ensure particle survival during calcination, (iii) toluene as a diluent to reduce the precursor viscosity and ensure precursor homogeneity, and (iv) a photoinitiator for UV initiated crosslinking of the sacrificial scaffold (ETPTA). During the flow synthesis of titania microparticles, the dispersed phase was fed through the inner channel of the upper constricted capillary, while the continuous phase, formamide containing 1 wt% surfactant, was introduced through both the upper and lower annuli. Droplets were formed as the continuous phase stretched the precursor jet through the lower constriction, with the droplets and continuous phase exiting through the lower constricted exit capillary under ambient temperature and pressure (Movie M1†).36–39 The collimated UV LED light source was precisely aligned with the exit capillary, offset from the droplet formation zone, thereby enabling the photocurable polymer in the formed microdroplets to rapidly crosslink inside the flow reactor (Fig. S3†). The photocured microparticles and the continuous phase were collected in a collection vessel containing deionized (DI) water.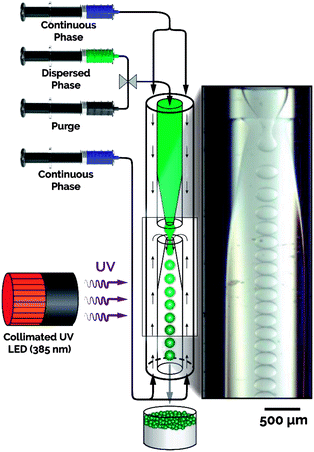 | ||
| Fig. 1 Schematic of the microfluidic platform integrated with a collimated UV LED for continuous synthesis of highly monodisperse titania microspheres. | ||
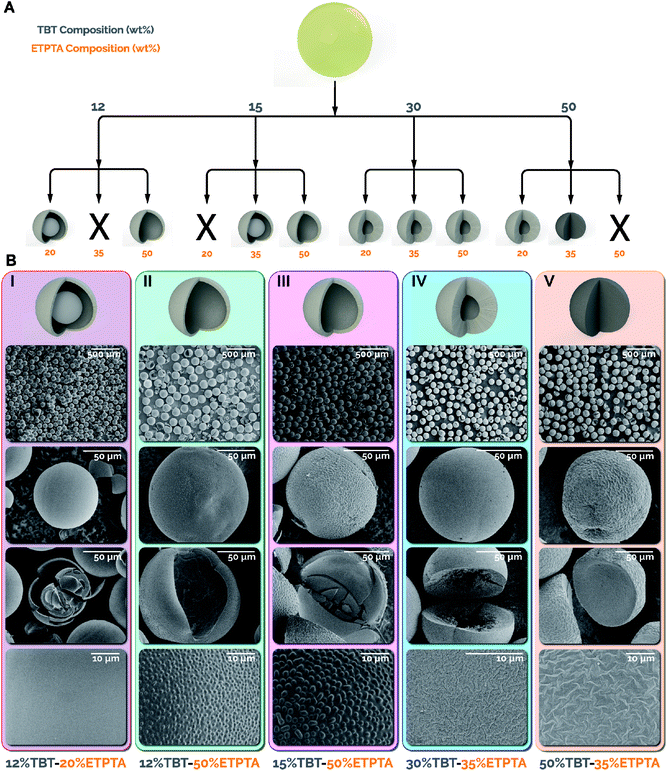
Initiating the photo crosslinking of the sacrificial scaffold in the microreactor prior to any exposure to water enables, for the first time, a dramatic increase in the TBT concentration (up to 50 wt%) while also varying the composition of the ETPTA. In this work, TBT compositions of 12, 15, 30, and 50 wt% were utilized, with the remaining dispersed phase for each TBT composition tested with 20, 35, and 50 wt% ETPTA. For simplicity, the combinations tested will be referred to by the weight composition of TBT in the precursor and the weight composition of ETPTA in the remaining dispersed phase separated by a hyphen (i.e. 12–20 corresponds to 12 wt% TBT in the precursor and 20 wt% ETPTA/80 wt% toluene in the remaining dispersed phase). Fig. 2A summarizes the conditions tested and the accessible titania particle morphologies via the intensified continuous flow synthesis strategy, including yolk–shell, hollow, macroporous, and dense spheres. Yolk–shell and hollow sphere morphologies were both observed at lower TBT compositions (12 and 15 wt%), while macroporous and dense sphere morphologies were only observed at 30 and 50 wt% TBT. As expected, higher TBT concentrations result in thicker/more dense shells or fully dense microparticles, while lower TBT concentrations result in thinner shells.
In the case of the 12 and 15 wt% TBT microspheres, it was surprising to observe the formation of hollow spheres at 50 wt% ETPTA (Fig. 2B II & III), while yolk–shell morphologies were formed at lower ETPTA compositions. The formation of the hollow shells at 50 wt% ETPTA is attributable to high ETPTA concentration and rapid in-reactor photo crosslinking. These factors result in spinodal decomposition, as evidenced by the patterns observed in Fig. 2B II & III (fourth row), making the TBT partially insoluble in the crosslinked polymer, forcing it to the surface, thereby resulting in a hollow sphere morphology. By comparison, yolk–shell morphologies were formed due to the low polymer network density caused by lower ETPTA and photoinitiator concentrations. The relatively low network density of the crosslinked sacrificial scaffold (ETPTA) results in faster formation of a thin titania shell due to interfacial hydrolysis, while trapping the remaining TBT present in the microparticles within the core. Once the dried microparticles were calcined, the combustion of the ETPTA and TBT in the core resulted in the formation of the observed yolk–shell particles (Fig. 2B I and S4†).34
The microspheres synthesized utilizing 30 and 50 wt% TBT and varying ETPTA compositions resulted in fewer morphological differences compared to the 12 and 15 wt% particles. All tested 30 and 50 wt% TBT compositions resulted in thick-shell macroporous morphologies except for the 50–35, which produced dense microspheres. However, the different TBT–ETPTA compositions resulted in drastically different shapes depending on the ETPTA composition, and thus the network density of the crosslinked ETPTA after photo crosslinking in the flow reactor. The less dense ETPTA networks were present in the 30–20 and 50–20 resulted in “popcorn-like” or “raisin-like” morphologies (Fig. S4†), while the increased density of the networks in the 30–35 and 50–35 microparticles resulted in spherical macroporous (Fig. 2B IV) and dense microspheres (Fig. 2B V), respectively. The network density and the total amount of the crosslinked ETPTA combusted during calcination of the 30–50 microparticles resulted in a ruptured “fig-like” morphology (Fig. S4†).
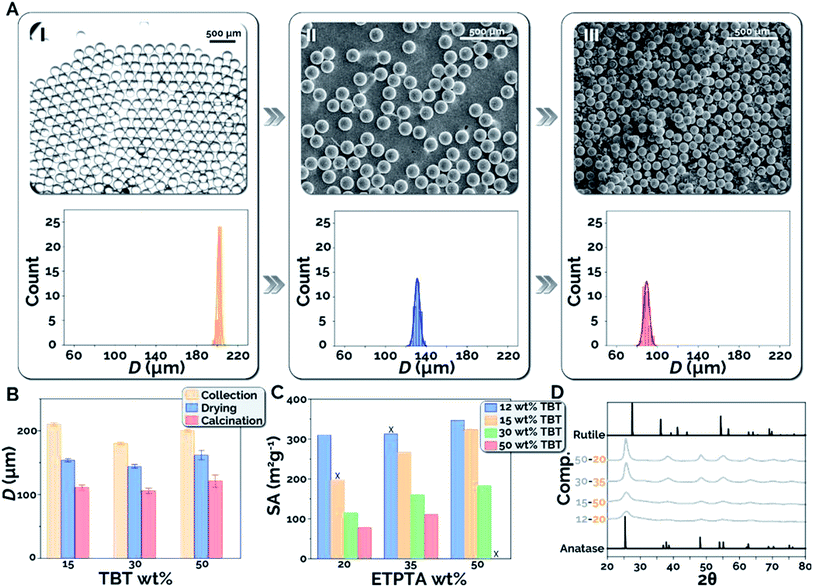
To better understand the effect of each processing step, including collection, drying, and calcination, on the size and morphology of the titania microparticles, we systematically studied the effects of the dispersed phase composition on microparticle shrinkage and specific surface area. Microparticle shrinkage (i.e., the reduction in microparticle diameter) during the drying and calcination steps, is expected due to varying quantities of toluene and ETPTA present in the different precursor compositions tested. Toluene evaporates during the drying stage, while the sacrificial scaffold (ETPTA) combusts during the calcination stage, resulting in decreasing microsphere diameter. Fig. 3A presents bright-field microscopy and scanning electronic microscopy (SEM) images for 12–20 microparticles after collection (I), drying (II), and calcination (III), as well as microparticle diameter (D) histograms for each condition (see ESI S6 and Fig. S5† for microparticle diameter measurement).40 The precise process control and flow stability within the microfluidic reactor resulted in coefficients of variation (CV = σD/〈D〉 × 100, where σD is the standard deviation of microparticle diameters and 〈D〉 is the average microparticle diameter) of 0.8% after collection, 2.0% after drying, and 3.1% after calcination, respectively, for the in-flow synthesized titania microparticles. Microparticle shrinkage was then examined as a function of precursor composition (Fig. 3B). It was observed that the average diameters decreased by 47%, 41%, and 39% between collection and calcination for 15–35, 30–35, and 50–35 microparticles, respectively. As expected, increasing TBT concentration results in decreased quantities of ETPTA and toluene in the precursor and the formed microdroplets, which decreases the overall microparticle shrinkage.
Precursor composition was also expected to exhibit substantial effects on the specific surface areas of the synthesized titania microparticles. Higher TBT concentrations were expected to increase the TiO2 density in the microspheres, resulting in lower specific surface areas. By comparison, it was anticipated that higher ETPTA concentrations would inhibit nanocrystal sintering and result in higher specific surface areas. Fig. 3C presents the experimentally measured specific surface areas (SA) of calcined titania microparticles for each precursor composition tested. As expected, increasing TBT concentration at the same composition of ETPTA decreases the obtained specific surface area post calcination (500 °C, 1 h), while increasing ETPTA composition at a constant TBT concentration results in increasing specific surface area of the synthesized titania microparticles. For example, at 35 wt% ETPTA, the microparticles were found to possess specific surface areas of 313, 267, 160, and 111 m2 g−1 at TBT compositions of 12, 15, 30, and 50 wt% TBT, respectively. At 15 wt% TBT, the particles possessed specific surface areas of 197, 267, and 324 m2 g−1 at 20, 35, and 50 wt% ETPTA, respectively. Using this method, it is also possible that other photocurable polymers (i.e. other polyacrylates, longer/shorter chain ETPTA) could be used. It would be expected that diacrylate compounds and longer chain ETPTAs (Mn > 428) would result in lower density polymer networks, decreased interruption of TiO2 formation, and lower surface areas. In contrast, tetraacrylates and shorter chain ETPTAs (Mn < 428) would be expected to have the opposite effect. Finally, XRD spectra are presented for particles synthesized at each TBT concentration (Fig. 3D). As the microparticles were calcined at 500 °C, the presence of the anatase phase (2θ = 25°) and the absence of the rutile phase (2θ = 27°) is expected. The increased peak intensity at higher TBT concentrations is attributable to increased crystallite growth enabled by the greater density and quantity of TiO2.
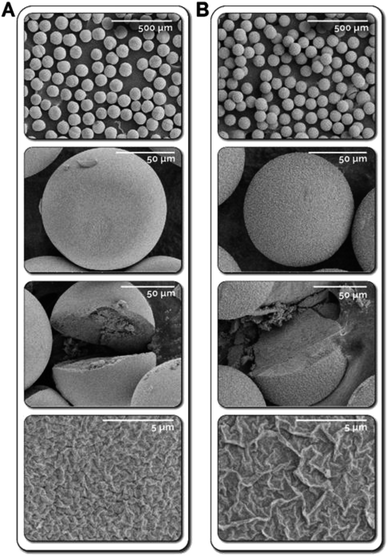
Utilizing the developed continuous flow synthesis strategy, we also explored the effect of collection solvent on the morphology of the synthesized microparticles. Employing formamide instead of DI water as the collection solvent completely eliminates interfacial hydrolysis occurring in the collection vessel following in-reactor photo crosslinking. Fig. 4 shows titania microparticles synthesized using 30 and 50 wt% TBT with 30 wt% ETPTA, collected in formamide (i.e., without any interfacial hydrolysis). Due to the elimination of the interfacial hydrolysis in the collection vessel, the synthesized microparticles possess dense sphere morphologies with uniform density throughout the microparticle. BET was then used to characterize the microspheres, with resulting measurements of 81 m2 g−1 and 36 m2 g−1 for the 30 and 50 wt% microparticles, which are substantially lower than the measured surface areas of microparticles at comparable compositions collected in DI water. This is attributable to the uniformity and density of the TiO2 network throughout the microparticles, which likely results in inaccessible interior pores at the center of the microsphere, causing lower surface areas.
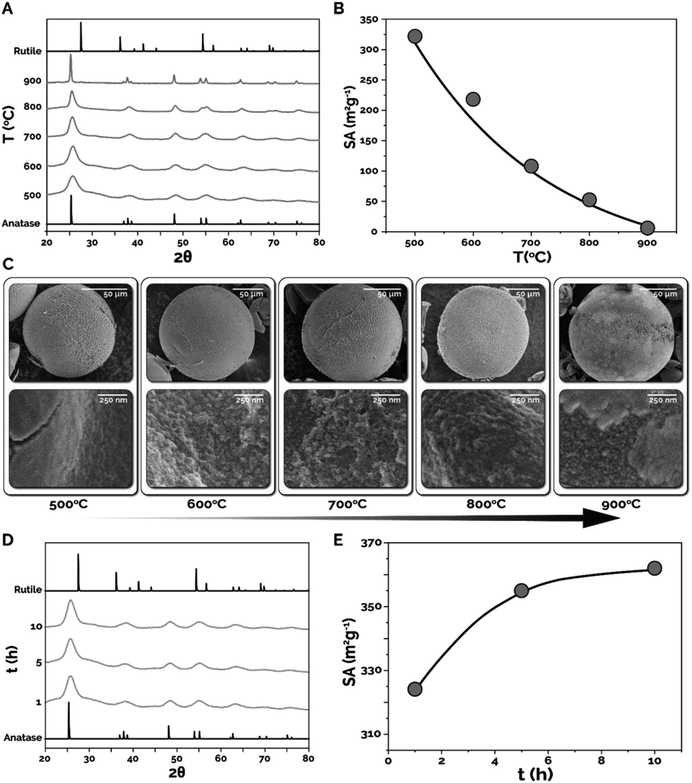
In the next set of experiments, the effects of different calcination temperatures (T) and times (t) on the crystallinity/crystalline phase and specific surface area were explored. Microparticles synthesized using 15 wt% TBT and 50 wt% ETPTA were first calcined at 500, 600, 700, 800, and 900 °C for 1 h and were characterized using X-ray diffraction (XRD), Brunauer–Emmett–Teller characterization (BET), and SEM. Fig. 5A presents normalized XRD spectra (see Fig. S6† for spectra without normalization) collected for microparticles calcined at each temperature, as well as the representative XRD spectra for the two primary TiO2 phases, anatase and rutile. As expected, increasing calcination temperature results in narrowing of the XRD peaks and increasing peak intensity, indicating an increase in crystallinity and nanocrystal size within the synthesized microparticles. The XRD peak at 2θ = 25° corresponds to the anatase phase in each of the synthesized samples. What is surprising, however, is the absence of a peak at 2θ = 27°, corresponding to the rutile phase transition, in any of the XRD spectra from 500–900 °C. According to previous studies, the formation of the rutile phase is typically expected at temperatures above ∼600 °C.41 Thus, the microparticles synthesized in-flow utilizing the intensified continuous flow microreactor demonstrate excellent resistance to phase transition, even at temperatures well above the expected phase transition temperature for titania microparticles synthesized using all other synthesis strategies. Next, the calcination temperature effects on specific surface area were characterized using BET (Fig. 5B). As expected, increasing calcination temperature resulted in decreasing specific surface area due to sintering and nanocrystal growth within the titania microparticles. The in-flow synthesized titania microparticles calcined at 500 °C possessed specific surface areas of 324 m2 g−1 compared to 6 m2 g−1 at 900 °C. The sintering effect can be seen in SEM images presented in Fig. 5C, where increased crystal size with respect to temperature is observed, particularly at 900 °C, where large, well-defined crystal grains are visible.
The effect of varying calcination time was studied by calcining the 15–50 microspheres at 500 °C for 1, 5, and 10 h. The XRD spectra of these samples showed no significant difference in the phase composition of the calcined titania microparticles, though the amount of amorphous TiO2 present in the microparticles decreased (flattening baseline) (Fig. 5D). However, substantial differences were observed in the surface areas as calcination time was increased. Surprisingly, Fig. 5E shows that as calcination time was increased from 1 h to 10 h, the specific surface area of the microparticles increased by 12% from 324 m2 g−1 to 362 m2 g−1. While the increase in surface area seems to contradict the expectation of either constant or reduced surface area due to nanocrystal sintering, this observation is attributable to more complete combustion of residual carbonaceous species (from ETPTA) trapped in interior pores inside the microsphere, thus resulting in higher specific surface areas. SEM images of these samples shows no significant variation in morphology of the synthesized titania microparticles (Fig. S7†).
Conclusions
In conclusion, we demonstrated a facile, highly effective microfluidic strategy for synthesizing titania microparticles with no detectable rutile across a wide variety of unique morphologies, including hollow, yolk–shell, macroporous, and dense spheres, and breadth of sizes (5 μm to 250 μm) enabled by the use of an in-line photocuring approach integrated with a flow synthesis reactor. The implementation of a collimated UV LED, coupled with the use of formamide as the continuous phase in the microreactor, enabled the use of exceptionally high titanium precursor compositions, ranging from 12 wt% to 50 wt%, which represents an increase of as much as an order of magnitude compared to commonly utilized compositions. Titanium precursor and sacrificial scaffold (ETPTA) compositions were varied systematically, and their effects on titania microparticle morphology, shrinkage, and surface area were explored. With these compositions, exceptionally high surface areas up to 362 m2 g−1 were achieved with microparticle sizes ∼2 orders of magnitude larger than other particles with comparable surface areas. Furthermore, the effect of varying the collection solvents on microparticle morphology, as well as calcination time/temperature effects on microparticle surface area and crystallinity/phase composition, were assessed. The synthesized microspheres were demonstrated to possess excellent phase stability, with no detectable rutile even at calcination temperatures up to 900 °C, while increasing calcination time was demonstrated to increase specific surface area. The in-flow synthesized titania microparticles thus possess unique attributes that make them intriguing candidates for a wide variety of applications, including catalysis and photocatalysis, photovoltaics, contaminant adsorption and separation, and electrochemistry. Finally, the developed continuous flow synthesis strategy represents a generalizable method for synthesizing inorganic microparticles with tunable morphologies and characteristics from a wide variety of organometallic precursors.Conflicts of interest
There are no conflicts to declare.Acknowledgements
The authors would like to acknowledge the financial support provided by North Carolina State University, the University of North Carolina System Research Opportunities Initiative, and National Science foundation (CBET, award number 1803428). This work was also performed in part at the Analytical Instrumentation Facility (AIF) at North Carolina State University, which is supported by the State of North Carolina and the National Science Foundation (award number ECCS-1542015). The AIF is a member of the North Carolina Research Triangle Nanotechnology Network (RTNN), a site in the National Nanotechnology Coordinated Infrastructure (NNCI).Notes and references
- V. Likodimos, Appl. Catal., B, 2018, 230, 269–303 CrossRef CAS.
- L. Torrente-Murciano, A. A. Lapkin, D. V. Bavykin, F. C. Walsh and K. Wilson, J. Catal., 2007, 245, 272–278 CrossRef CAS.
- D. V. Bavykin, A. A. Lapkin, P. K. Plucinski, L. Torrente-Murciano, J. M. Friedrich and F. C. Walsh, Top. Catal., 2006, 39, 151–160 CrossRef CAS.
- C. Bottecchia, N. Erdmann, P. M. A. Tijssen, L. G. Milroy, L. Brunsveld, V. Hessel and T. Noël, ChemSusChem, 2016, 9, 1781–1785 CrossRef CAS PubMed.
- G. Wu, G. L. Brett, E. Cao, A. Constantinou, P. Ellis, S. Kuhn, G. J. Hutchings, D. Bethell and A. Gavriilidis, Catal. Sci. Technol., 2016, 6, 4749–4758 RSC.
- S. Ma, Y. Lan, G. M. J. Perez, S. Moniri and P. J. A. Kenis, ChemSusChem, 2014, 7, 866–874 CrossRef CAS PubMed.
- C. Xu, P. R. Anusuyadevi, C. Aymonier, R. Luque and S. Marre, Chem. Soc. Rev., 2019, 48, 3868–3902 RSC.
- L. Kavan, Curr. Opin. Electrochem., 2017, 2, 88–96 CrossRef CAS.
- Z. Lin, M. Zheng, B. Zhao, G. Wang, L. Pu and Y. Shi, J. Solid State Electrochem., 2014, 18, 1673–1681 CrossRef CAS.
- F. Sauvage, D. Chen, P. Comte, F. Huang, L. Heiniger, Y. Cheng, R. A. Caruso and M. Graetzel, ACS Nano, 2010, 4, 4420–4425 CrossRef CAS PubMed.
- C. H. Weng, J. H. Wang and C. P. Huang, Water Sci. Technol., 1997, 35, 55–62 CrossRef CAS.
- E. Vassileva, K. Hadjiivanov, T. Stoychev and C. Daiev, Analyst, 2000, 125, 693–698 RSC.
- D. D. Dunuwila, C. D. Gagliardi and K. A. Berglund, Chem. Mater., 1994, 6, 1556–1562 CrossRef CAS.
- D. Chen, L. Cao, F. Huang, P. Imperia, Y. Cheng and R. A. Caruso, J. Am. Chem. Soc., 2010, 132, 4438–4444 CrossRef CAS PubMed.
- T. Zhao, W. Luo, Y. Deng, Y. Luo, P. Xu, Y. Liu, L. Wang, Y. Ren and W. Jiang, Nano Energy, 2016, 26, 16–25 CrossRef CAS.
- E. F. Rodriguez, D. Chen, A. F. Hollenkamp, L. Cao and R. A. Caruso, Nanoscale, 2015, 7, 17947–17956 RSC.
- H. Zheng, H. Svengren, Z. Huang, Z. Yang, X. Zou and M. Johnsson, Microporous Mesoporous Mater., 2018, 264, 147–150 CrossRef CAS.
- T. Nakashima and N. Kimizuka, J. Am. Chem. Soc., 2003, 125, 6386–6387 CrossRef CAS PubMed.
- R. A. Caruso, A. Susha and F. Caruso, Chem. Mater., 2001, 13, 400–409 CrossRef CAS.
- R. L. Hartman and K. F. Jensen, Lab Chip, 2009, 9, 2495–2507 RSC.
- H. Song, D. L. Chen and R. F. Ismagilov, Angew. Chem., Int. Ed., 2006, 45, 7336–7356 CrossRef CAS PubMed.
- S. Xu, Z. Nie, M. Seo, P. Lewis, E. Kumacheva, H. A. Stone, P. Garstecki, D. B. Weibel, I. Gitlin and G. M. Whitesides, Angew. Chem., Int. Ed., 2005, 44, 724–728 CrossRef CAS PubMed.
- S. Marre and K. F. Jensen, Chem. Soc. Rev., 2010, 39, 1182–1202 RSC.
- M. Chau, M. Abolhasani, Y. Li, Y. Wang, D. Velasco, E. Tumarkin, A. Ramachandran and E. Kumacheva, Biomacromolecules, 2014, 15, 2419–2425 CrossRef CAS PubMed.
- A. Kumachev, J. Greener, E. Tumarkin, E. Eiser, P. W. Zandstra and E. Kumacheva, Biomaterials, 2011, 32, 1477–1483 CrossRef CAS PubMed.
- T. Gendrineau, S. Marre, M. Vaultier, M. Pucheault and C. Aymonier, Angew. Chem., 2012, 124, 8653–8656 CrossRef.
- R. Ameloot, F. Vermoortele, W. Vanhove, M. B. J. Roeffaers, B. F. Sels and D. E. De Vos, Nat. Chem., 2011, 3, 382–387 CrossRef CAS PubMed.
- S. Duraiswamy and S. A. Khan, Small, 2009, 5, 2828–2834 CrossRef CAS PubMed.
- V. Sebastian Cabeza, S. Kuhn, A. A. Kulkarni and K. F. Jensen, Langmuir, 2012, 28, 7007–7013 CrossRef CAS PubMed.
- S. A. Khan, A. Günther, M. A. Schmidt and K. F. Jensen, Langmuir, 2004, 20, 8604–8611 CrossRef CAS PubMed.
- X. Gong, L. Wang and W. Wen, Chem. Commun., 2009, 4690 RSC.
- T. H. Eun, S.-H. Kim, W.-J. Jeong, S. Jeon, S. Kim and S. Yang, Chem. Mater., 2009, 21, 201–203 CrossRef CAS.
- H. Eskandarloo, M. Zaferani, A. Kierulf and A. Abbaspourrad, Appl. Catal., B, 2018, 227, 519–529 CrossRef CAS.
- Z. S. Campbell, M. Parker, A. Bennett, S. Yusuf, A. K. Al-Rashdi, J. Lustik, F. Li and M. Abolhasani, Chem. Mater., 2018, 30, 8948–8958 CrossRef CAS.
- B. R. Benson, H. A. Stone and R. K. Prud'homme, Lab Chip, 2013, 13, 4507–4511 RSC.
- Z. Nie, M. Seo, S. Xu, P. C. Lewis, M. Mok, E. Kumacheva, G. M. Whitesides, P. Garstecki and H. A. Stone, Microfluid. Nanofluid., 2008, 5, 585–594 CrossRef CAS.
- S. L. Anna, N. Bontoux and H. A. Stone, Appl. Phys. Lett., 2011, 82, 364–366 CrossRef.
- S. L. Anna and H. C. Mayer, Phys. Fluids, 2006, 18, 121512 CrossRef.
- P. Garstecki, I. Gitlin, W. DiLuzio, G. M. Whitesides, E. Kumacheva and H. A. Stone, Appl. Phys. Lett., 2004, 85, 2649–2651 CrossRef CAS.
- J. A. Bennett, A. J. Kristof, V. Vasudevan, J. Genzer, J. Srogl and M. Abolhasani, AIChE J., 2018, 64, 3188–3197 CrossRef CAS.
- C. Byrne, R. Fagan, S. Hinder, D. E. McCormack and S. C. Pillai, RSC Adv., 2016, 6, 95232–95238 RSC.
- J. Bennett, React. Chem. Eng., 2019, 4(2), 254–260 RSC.
- J. Bennett, Curr. Opin. Chem. Eng., 2019, 26, 9–19 CrossRef.
- K. Abdel-Latif, Adv. Funct. Mater., 2019, 29(23), 1900712 CrossRef.
- R. W. Epps, Lab Chip, 2017, 17(23), 4040–4047 RSC.
Footnote |
| † Electronic supplementary information (ESI) available. See DOI: 10.1039/d0ra01442g |
| This journal is © The Royal Society of Chemistry 2020 |

