 Open Access Article
The construction of the novel magnetic prodrug Fe3O4@DOX and its antagonistic effects on hepatocarcinoma with low toxicity
Jun Li†
ab,
Liang Li†c,
Yang Lv†ab,
Hao Zoud,
Yanping Weic,
Fei Nieb,
Wanli Duanb,
Maidinamu Sedikea,
Liang Xiao*b and
Mei Wang *a
*a
aCollege of Traditional Chinese Medicine, Xinjiang Medical University, Wulumuqi 830011, China. E-mail: wm630@163.com
bFaculty of Naval Medicine, Second Military Medical University (Naval Medical University), Shanghai 200433, China. E-mail: hormat830713@hotmail.com
cNational Center for Liver Cancer, Shanghai, China, International Co-operation Laboratory on Signal Transduction, Eastern Hepatobiliary Surgery Institute, Second Military Medical University, Shanghai, 200438, China
dDepartment of Pharmaceutical Sciences, School of Pharmacy, Second Military Medical University (Naval Medical University), Shanghai 200433, China
First published on 5th August 2020
Abstract
Doxorubicin (DOX) is widely used as a chemotherapeutic agent for liver cancer. However, its clinical applications are greatly restricted by its nonselective cytotoxicity. A novel magnetic prodrug, Fe3O4@DOX, was designed, synthesized and characterized, and Fe3O4 and DOX were connected by the peptide CGGAAN. The magnetic prodrug Fe3O4@DOX was successfully synthesized with average sizes of 95 nm and 322.5 nm by TEM (transmission electron microscopy) and Malvern Zetasizer instrument respectively. The maximum emission wavelength shifted from 594 nm for free DOX to 615 nm for conjugated DOX in the synthesized Fe3O4@DOX. Both free DOX and Fe3O4@DOX show strong cytotoxicity to legumain overexpressing PLC through apoptosis. Similarly, Fe3O4@DOX and DOX equally reduced tumor volume and induced cell apoptosis in tumor tissues, while the former significantly maintained body weight and extended the life of nude mice, therefore serving as a promising nanocarrier for liver cancer treatment.
1. Introduction
According to GLOBOCAN data, liver cancer is largely a problem in the less developed regions with an estimated 841![[thin space (1/6-em)]](https://www.rsc.org/images/entities/char_2009.gif) 000 new cases and 782
000 new cases and 782![[thin space (1/6-em)]](https://www.rsc.org/images/entities/char_2009.gif) 000 deaths annually.1–4 Its mortality ranks second in tumor-related deaths worldwide. In China, there were 466
000 deaths annually.1–4 Its mortality ranks second in tumor-related deaths worldwide. In China, there were 466![[thin space (1/6-em)]](https://www.rsc.org/images/entities/char_2009.gif) 100 new cases and 422
100 new cases and 422![[thin space (1/6-em)]](https://www.rsc.org/images/entities/char_2009.gif) 100 deaths from liver cancer in 2015, both occupying more than half of those all over the world.5,6 Since the majority of patients with liver cancer are already in an advanced stage, the rate of surgical resection, which is the most thorough treatment, is only 20–30%.7 Alternatively, hepatic artery intervention is commonly used and particularly preferred in patients who cannot undergo surgery. However, liver cancer is prone to both intrahepatic and extrahepatic metastasis, making it difficult to control distant metastasis through local treatments. Therefore, it is extremely important to improve the targeting of drugs to tumor cells as well as to decrease the toxicity of the targeted drugs.
100 deaths from liver cancer in 2015, both occupying more than half of those all over the world.5,6 Since the majority of patients with liver cancer are already in an advanced stage, the rate of surgical resection, which is the most thorough treatment, is only 20–30%.7 Alternatively, hepatic artery intervention is commonly used and particularly preferred in patients who cannot undergo surgery. However, liver cancer is prone to both intrahepatic and extrahepatic metastasis, making it difficult to control distant metastasis through local treatments. Therefore, it is extremely important to improve the targeting of drugs to tumor cells as well as to decrease the toxicity of the targeted drugs.
The primary task of the drug delivery system is to specifically exert the anti-cancer effects in a therapeutic dose without large toxic effects or side effects. Recent advances have confirmed the value of nanocomposite drugs or nanomaterials for tumor targeted diagnosis and therapy.8–11 For example, the porous nano-gold embedded cellulose grafted polyacrylamide (PAM/C/Au) nanocomposite hydrogel were assembled, which enhanced the thermal and rheological properties make it an ideal carrier for ciprofloxacin.12 Meanwhile, the technologies including focused magnetic field, laser, and radio frequency and microwave are also widely implemented in the drug delivery systems, among which the magnetic nanoparticles (MNPs) are of particular interest due to its harmless and can be specifically manipulated and localized in the tumor issue by remote magnetic fields.13–16 Compared to other kinds of nanoparticles, the advantages of MNPs such as pure metals (Fe, Co, Ni, etc.), alloys (FeCo, alnico, permalloy, etc.), and oxides (γ-Fe2O3, CoFe2O4, Fe3O4, etc.) include small volume, large specific surface area, chemical modification on the surface, and good biocompatibility.17–20 Moreover, the MNPs e.g. Fe3O4 can actively accumulate in tumor tissues through a pathway known as the enhanced permeability and retention (EPR) effect due to the hyperpermeable and dynamic opening of vasculature (vascular bursts) and the poor lymphatic drainage from tumor tissues.21,22
Legumain (LGMN), also referred to as asparaginyl endopeptidase (AEP),23 is a protease that participates in many physiological and pathological processes,24 involved in protein turnover for maintenance of homeostasis and protein activation or inactivation for cell signaling,25 such as antigen processing, cell migration and proliferation. It specifically recognizes the AAN motif and hydrolyzes proteins or peptide chains from the carboxy terminus of asparagine (Asn). In mammals, LGMN is widely localized to the endolysosome, cell surface, cytosol or nucleus with endopeptidase, carboxy peptidase, and ligase activities.26,27 Several studies have reported that tumor cells as well as their stromal cells express higher levels of LGMN, thereby exhibiting enhanced migratory and invasive capabilities via the activation of pro-MMP2 and cathepsins.29,30 As the specially recognized motif by LGMN, AAN is a commonly used segment of linked peptide that has widely been used in the field of nanodrug delivery systems with several advantages, including the fast release of target drugs, good biocompatibility, low immunogenicity and no restriction on the size of all substances.31
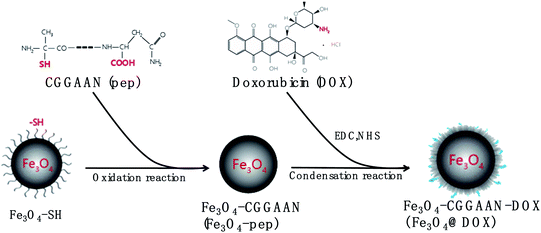
Doxorubicin (DOX) is a highly hydrophilic drug derived by chemical semisynthesis from a bacterial species that is widely used as a chemotherapeutic agent for liver cancer.32 However, its clinical application is greatly restricted by its strong nonselective cytotoxicity. In terms of the functional properties of the Fe3O4 and LGMN, a novel magnetic prodrug Fe3O4@DOX was designed and synthesized where Fe3O4 and DOX were connected by the designated peptide CGGAAN (Fig. 1). DOX in the magnetic prodrug is supposed to be released from the nanoparticles by LGMN that is usually over-experessed in tumor, thereby reducing its toxicity while maintaining its antagonistic effects on liver cancer.32,33
2. Materials and methods
2.1. Chemicals and materials
The reagents and kits commonly used in this study induclude doxorubicin (Solarbio, USA), 1-(3-dimethylaminopropyl)-3-ethylcarbodiimide hydrochloride (Yeyuan Biotech, Shanghai), Fe3O4-SH (Ruixi Biotech, Shanxi), N-hydroxysuccinimide (Yeyuan Biotech, Shanghai), Anti-LGMN antibody (ABclonal, USA), DMEM medium (Gibco, USA), fetal bovine serum (Gibco, USA), FITC Annexin V Apoptosis Detection Kit with 7-AAD (BioLegend, USA), and TUNEL Apoptosis Kit (RuiBo, Shanghai). The PGMLV-CMV-H_LGMN-3 × Flag-EF1-ZsGreen1-T2A-Puro plasmid was constructed by Jiman Biological Company (Shanghai, CN). Human liver cancer cells (PLCs) were kindly provided by National Liver Cancer Science Center of China (Shanghai, CN). BABL/c male nude mice were purchased from the Animal Experimental Center of Naval Military Medical University (Shanghai, CN). All animal procedures were performed in accordance with the Guidelines for Care and Use of Laboratory Animals of “Naval Military Medical” University and approved by the Animal Ethics Committee of “Naval Military Medical.2.2. Fe3O4@DOX synthesis
The Fe3O4-pep (Fe3O4-CGGAAN) particles were first synthesized by mixing with 5 mg mL−1 of Fe3O4-SH (Rui Xi Inc., China) with the linked peptide CGGAAN (1, 2.5, 5, and 10 mg) to a final volume![[thin space (1/6-em)]](https://www.rsc.org/images/entities/char_2009.gif) :
:![[thin space (1/6-em)]](https://www.rsc.org/images/entities/char_2009.gif) mass ratio of 1
mass ratio of 1![[thin space (1/6-em)]](https://www.rsc.org/images/entities/char_2009.gif) :
:![[thin space (1/6-em)]](https://www.rsc.org/images/entities/char_2009.gif) 1, 1
1, 1![[thin space (1/6-em)]](https://www.rsc.org/images/entities/char_2009.gif) :
:![[thin space (1/6-em)]](https://www.rsc.org/images/entities/char_2009.gif) 2.5, 1
2.5, 1![[thin space (1/6-em)]](https://www.rsc.org/images/entities/char_2009.gif) :
:![[thin space (1/6-em)]](https://www.rsc.org/images/entities/char_2009.gif) 5 or 1
5 or 1![[thin space (1/6-em)]](https://www.rsc.org/images/entities/char_2009.gif) :
:![[thin space (1/6-em)]](https://www.rsc.org/images/entities/char_2009.gif) 10 at room temperature for 2 h. The unconjugated polypeptides were removed by dialysis overnight. After screening the particle size and homogeneity, the 1
10 at room temperature for 2 h. The unconjugated polypeptides were removed by dialysis overnight. After screening the particle size and homogeneity, the 1![[thin space (1/6-em)]](https://www.rsc.org/images/entities/char_2009.gif) :
:![[thin space (1/6-em)]](https://www.rsc.org/images/entities/char_2009.gif) 2.5. The Fe3O4-pep sample (1 mL) was ultrasonically dispersed into 5 mL of 4-morpholineethanesulfonic acid hydrate buffer (0.01 M, pH 6.0), followed by the addition of 40 mg of 1-(3-dimethylaminopropyl)-3-ethylcarbodiimide hydrochloride (EDC) and 60 mg of N-hydroxysuccinimide (NHS) at room temperature, playing roles in protecting and re-activating the carboxyl group, respectively. The solution was then ultrasonicated for 15 s, shaken at 37 °C for 15 min, and centrifuged at 12
2.5. The Fe3O4-pep sample (1 mL) was ultrasonically dispersed into 5 mL of 4-morpholineethanesulfonic acid hydrate buffer (0.01 M, pH 6.0), followed by the addition of 40 mg of 1-(3-dimethylaminopropyl)-3-ethylcarbodiimide hydrochloride (EDC) and 60 mg of N-hydroxysuccinimide (NHS) at room temperature, playing roles in protecting and re-activating the carboxyl group, respectively. The solution was then ultrasonicated for 15 s, shaken at 37 °C for 15 min, and centrifuged at 12![[thin space (1/6-em)]](https://www.rsc.org/images/entities/char_2009.gif) 000 × g for 10 min. The pellets were resuspended in 5 mL of PBS solution with 5 mg mL−1 DOX, rapidly sonicated for 30 s, and shaken at 37 °C overnight. The synthesized Fe3O4@DOX samples were centrifuged, washed three times, and resuspended in 4.5 mL of PBS. Finally, the coupling rate of DOX was calculated under the standard curve of DOX established by measuring the absorbance at 485 nm with a microplate reader. The formula is as follows: coupling rate (%) = 100 × (mamount of drug invested − mfree drug)/mamount of drug invested.
000 × g for 10 min. The pellets were resuspended in 5 mL of PBS solution with 5 mg mL−1 DOX, rapidly sonicated for 30 s, and shaken at 37 °C overnight. The synthesized Fe3O4@DOX samples were centrifuged, washed three times, and resuspended in 4.5 mL of PBS. Finally, the coupling rate of DOX was calculated under the standard curve of DOX established by measuring the absorbance at 485 nm with a microplate reader. The formula is as follows: coupling rate (%) = 100 × (mamount of drug invested − mfree drug)/mamount of drug invested.
2.3. Characterization of the magnetic nanoparticles
The relationship between the standing time and the precipitation of Fe3O4-pep with different volume![[thin space (1/6-em)]](https://www.rsc.org/images/entities/char_2009.gif) :
:![[thin space (1/6-em)]](https://www.rsc.org/images/entities/char_2009.gif) mass ratios was first compared by determining the precipitation (%) and turbidity (%) with naked eyes, where the samples with full of diaphaneity were considered as 100% precipitation and 0% turbidity while the solutions were homogeneous without any precipitation were recognized as 0% precipitation and 100% turbidity. Then, the morphologies and particle sizes were observed by transmission electron microscopy (TEM, JEOL-1230, Japan) 1–2 weeks after particle synthesis. The particle solutions were blended before the preparation of TEM samples. The particle size was tested by the TEM automatic image analysis software whereas the ratio of dispersity was also calculated by counting the adhesive particles. Then, the optimal ratio of 1
mass ratios was first compared by determining the precipitation (%) and turbidity (%) with naked eyes, where the samples with full of diaphaneity were considered as 100% precipitation and 0% turbidity while the solutions were homogeneous without any precipitation were recognized as 0% precipitation and 100% turbidity. Then, the morphologies and particle sizes were observed by transmission electron microscopy (TEM, JEOL-1230, Japan) 1–2 weeks after particle synthesis. The particle solutions were blended before the preparation of TEM samples. The particle size was tested by the TEM automatic image analysis software whereas the ratio of dispersity was also calculated by counting the adhesive particles. Then, the optimal ratio of 1![[thin space (1/6-em)]](https://www.rsc.org/images/entities/char_2009.gif) :
:![[thin space (1/6-em)]](https://www.rsc.org/images/entities/char_2009.gif) 2.5 Fe3O4-pep particles were selected to further test the size and zeta potential with a Malvern Zetasizer instrument (Malvern Zetasizer Nano ZS, UK). The disulfide bond between Fe3O4-SH and CGGAAN was confirmed by Raman spectroscopy (Renishaw, in Via, UK), whereas the specific bonds, including Fe–O, C–H, C
2.5 Fe3O4-pep particles were selected to further test the size and zeta potential with a Malvern Zetasizer instrument (Malvern Zetasizer Nano ZS, UK). The disulfide bond between Fe3O4-SH and CGGAAN was confirmed by Raman spectroscopy (Renishaw, in Via, UK), whereas the specific bonds, including Fe–O, C–H, C![[double bond, length as m-dash]](https://www.rsc.org/images/entities/char_e001.gif) O and O–H, were observed by Fourier transform infrared spectroscopy (FT-IR, MEXUS, USA). After coupling Fe3O4-SH with CGGAAN, X-ray diffraction (XRD, Kratos, Japan) was used to detect whether crystal form was changed. In addition to transmission electron microscopy and the Malvern Zetasizer instrument, which were utilized to test the morphology, size and zeta potential, the fluorescence spectrum of Fe3O4@DOX was screened by a fluorophotometer (Thermo Fisher, Lumina, USA).
O and O–H, were observed by Fourier transform infrared spectroscopy (FT-IR, MEXUS, USA). After coupling Fe3O4-SH with CGGAAN, X-ray diffraction (XRD, Kratos, Japan) was used to detect whether crystal form was changed. In addition to transmission electron microscopy and the Malvern Zetasizer instrument, which were utilized to test the morphology, size and zeta potential, the fluorescence spectrum of Fe3O4@DOX was screened by a fluorophotometer (Thermo Fisher, Lumina, USA).
2.4. Construction of the LGMN-overexpressing lentivirus
The target LGMN gene was first amplified by polymerase chain reaction (PCR) from the original pUC57 plasmid that contains only the LGMN sequence with the sense primer 5ʹ-GCGAATTCGAAGTATACCTCGAGGCCACCATGGTTTGGAAAGTAGCTGTATTCCT-3ʹ and antisense primer 3ʹ-GTCATGGTCTTTGTAGTCGGATCCGTAGTGACCAAGGCACACGTG-5ʹ. The LGMN segment was inserted into the plasmid PGMLV-CMV through a specific digestion site (XhoI and BamHI) contained at both ends of the primers to construct the overexpression core plasmid PGMLV-CMV-H_LGMN-3 × Flag-EF1-ZsGreen1-T2A-Puro of the lentivirus, which was then cotransfected with three auxiliary packaging plasmids, VSV-G, GAG, and REV, into HEK293T cells with the HG transfection reagent. Enhancing buffer was added after 10–12 h of transfection and changed to fresh medium after 8 h. After 48 h of incubation, the supernatants of the cells enriched with the lentivirus particles were collected. The obtained viruses were verified by fluorescence microscopy (Olympus Co., Japan) and western blot analysis.2.5. Construction of stable LGMN-overexpressing PLCs
PLCs obtained from the Naval Medical University (Shanghai, China) were incubated in DMEM containing 10% fetal bovine serum (FBS) and 1% penicillin/streptomycin, in a 5% CO2 incubator at 37 °C. Stable LGMN-overexpressing PLCs were constructed through transfection with the successfully constructed lentivirus carrying the LGMN segment. Briefly, the negative control (NC) lentivirus at a final titer of 16 × 106 TU per mL (transfection unit) and a series of LGMN-overexpressing lentiviruses to final titers of 4 × 10⁶, 8 × 10⁶, 12 × 106 and 16 × 106 TU per mL were added to different six-well dishes that were plated with PLCs at the same density of 3 × 10⁵ cells per mL. Polybrene (10 μg mL−1) was also added to improve the infection efficiency on the following day. After 24 h, puromycin (0.5 μg mL−1) was added and changed once every two days for a period of 15 days. The treated cells (Olympus Co, Japan) were observed with a fluorescence microscope, and the expression of LGMN was verified by western blot analysis.2.6. Western blot analysis
PLCs with and without overexpressing LGMN at the same density of 2 × 10⁶ cells per mL were seeded and cultured for 24 h in 10 cm dishes (Corning Inc, NY, USA). The cells were harvested in RIPA lysis buffer (Beyotime), and the total protein was quantitated with the BCA assay (Thermo Fisher, USA). The protein samples (30 μg per well) were loaded and separated by 12% SDS-PAGE and transferred to a nitrocellulose filter membrane at 230 mA for 72 min. After blocking with 5% skimmed milk powder, it was incubated with the primary antibody (1![[thin space (1/6-em)]](https://www.rsc.org/images/entities/char_2009.gif) :
:![[thin space (1/6-em)]](https://www.rsc.org/images/entities/char_2009.gif) 1000) at 4 °C overnight and then with the secondary antibody (1
1000) at 4 °C overnight and then with the secondary antibody (1![[thin space (1/6-em)]](https://www.rsc.org/images/entities/char_2009.gif) :
:![[thin space (1/6-em)]](https://www.rsc.org/images/entities/char_2009.gif) 1000). The complexes were detected by enhanced chemiluminescence (ECL, 4A Biotech Co, Shanghai) and visualized using ChemiDoc XRS (Bio-Rad, USA). The intensity of the band for each protein was normalized to the internal reference GAPDH.
1000). The complexes were detected by enhanced chemiluminescence (ECL, 4A Biotech Co, Shanghai) and visualized using ChemiDoc XRS (Bio-Rad, USA). The intensity of the band for each protein was normalized to the internal reference GAPDH.
2.7. Cellular uptake
LGMN-overexpressing PLCs at a density of 5 × 10³ cells per well were first plated in six-well plates overnight. After the cells were successfully attached, DOX and Fe3O4@DOX at the same final concentration of 10 μg mL−1 were added for 0, 0.5, 1 and 3 h. The DOX fluorescence in each well was observed by confocal laser scanning microscopy (Zeiss LSM 710, Germany) with excitation and emission wavelengths of 485 nm and 585 nm, respectively.2.8. Cytotoxicity and apoptosis
After the PLCs with or without LGMN overexpression were attached at a density of 5 × 10³ cells per well, different concentrations of free DOX and Fe3O4@DOX were added to the well at a final volume of 100 μL and then incubated at 37 °C and 5% CO2 for 24 h. Then, MTT solution (20 μL, 5 mg mL−1) was added, and the incubation was continued for another 4 h. After removing the culture solution, 200 μL of dimethyl sulfoxide was added to each well, and the plates were shaken at a low speed for 10 s to fully dissolve the crystals. The absorbance was finally measured at 480 nm.The LGMN-overexpressing PLCs were seeded in six-well plates at a density of 2 × 10⁵ cells per well in 2 mL of complete DMEM and cultured for 24 h for attachment. The medium was then removed and replaced by fresh medium containing free DOX (10 μg mL−1) or Fe3O4@DOX (containing DOX 10 μg mL−1) and incubated for 24 h. The treated cells were collected and washed three times with ice-cold PBS and stained with FITC-Annexin V and 7-amino-actinomycin D (7-AAD). Quantitative measurements of apoptosis and necrosis were performed by flow cytometry (BD FACS Calibur, USA).
2.9. In vivo antitumor assessment
After resuspension in a mixture of matrigel (Corning Inc., NY, USA) and DMEM (v/v = 1/9), the cultured PLCs (0.1 mL, 1 × 10⁷ cells per mL) were injected into the subcutaneous part of the left thigh to produce the liver cancer model in nude mice. When the tumor volume reached approximately 130 mm3, the nude mice were randomly divided into four groups (n = 6). Free DOX (5 mg kg−1), Fe3O4@DOX (containing 5 mg kg−1 DOX) and equivalent amounts of Fe3O4-SH and PBS were then administered intravenously every other day for a total of ten days. During this period, the mouse weights and tumor sizes were measured with a Vernier caliper. The tumor volumes were calculated by the equation: volume = 0.5 × L × W2, where L and W represent the length and width of the tumor, respectively. At the same time, the time to death of each mouse was recorded, and a survival curve was drawn. The mice were then sacrificed, and the tumors and livers were extracted. Liver and tumor tissues in the PBS group were taken to verify the expression of legumain. Hematoxylin and eosin staining (H&E) was performed on paraffin sections of the tumors. In addition, paraffin sections of the tumors were subjected to terminal deoxynucleotidyl transferase dUTP nick end labeling (TUNEL) staining.2.10. Statistical analysis
Values are represented as the mean ± standard deviation. Student's t-test between two groups and ANOVA among multiple groups were used to evaluate the statistical significance of differences by the Sofare GraphPad Prism 8.0.2. Data were considered statistically significant at *p < 0.05, **p < 0.01.3. Results
3.1. Construction of Fe3O4@DOX and its characterization
Using the sulfhydryl nanoparticle Fe3O4-SH, we first synthesized a series of Fe3O4-CGGAAN (Fe3O4-pep) with different mass ratios of Fe3O4-SH to CGGAAN (1![[thin space (1/6-em)]](https://www.rsc.org/images/entities/char_2009.gif) :
:![[thin space (1/6-em)]](https://www.rsc.org/images/entities/char_2009.gif) 1, 1
1, 1![[thin space (1/6-em)]](https://www.rsc.org/images/entities/char_2009.gif) :
:![[thin space (1/6-em)]](https://www.rsc.org/images/entities/char_2009.gif) 2.5, 1
2.5, 1![[thin space (1/6-em)]](https://www.rsc.org/images/entities/char_2009.gif) :
:![[thin space (1/6-em)]](https://www.rsc.org/images/entities/char_2009.gif) 5 and 1
5 and 1![[thin space (1/6-em)]](https://www.rsc.org/images/entities/char_2009.gif) :
:![[thin space (1/6-em)]](https://www.rsc.org/images/entities/char_2009.gif) 10). Under standing conditions, the Fe3O4-peps produced dose-dependent and time-dependent precipitation, where the 1
10). Under standing conditions, the Fe3O4-peps produced dose-dependent and time-dependent precipitation, where the 1![[thin space (1/6-em)]](https://www.rsc.org/images/entities/char_2009.gif) :
:![[thin space (1/6-em)]](https://www.rsc.org/images/entities/char_2009.gif) 1 and 1
1 and 1![[thin space (1/6-em)]](https://www.rsc.org/images/entities/char_2009.gif) :
:![[thin space (1/6-em)]](https://www.rsc.org/images/entities/char_2009.gif) 2.5 Fe3O4-peps were evenly dispersed after 24 h, which was similar to that of the blank Fe3O4-SH, while the 1
2.5 Fe3O4-peps were evenly dispersed after 24 h, which was similar to that of the blank Fe3O4-SH, while the 1![[thin space (1/6-em)]](https://www.rsc.org/images/entities/char_2009.gif) :
:![[thin space (1/6-em)]](https://www.rsc.org/images/entities/char_2009.gif) 5 and 1
5 and 1![[thin space (1/6-em)]](https://www.rsc.org/images/entities/char_2009.gif) :
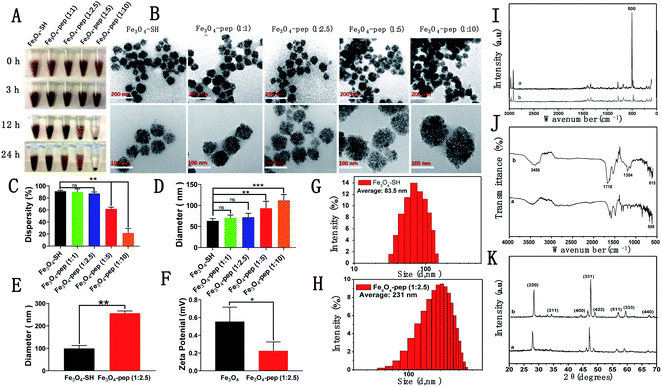
:![[thin space (1/6-em)]](https://www.rsc.org/images/entities/char_2009.gif) 10 Fe3O4-pep solutions showed substantial precipitation after 24 h and their supernatants became obviously transparent (Fig. 2A).
10 Fe3O4-pep solutions showed substantial precipitation after 24 h and their supernatants became obviously transparent (Fig. 2A).
Then, the morphologies and particle sizes of the Fe3O4-peps were investigated by TEM (Fig. 2B). All the Fe3O4-peps were circular, and the particle sizes increased from less than 60 nm for Fe3O4-SH to approximately 120 nm for 1![[thin space (1/6-em)]](https://www.rsc.org/images/entities/char_2009.gif) :
:![[thin space (1/6-em)]](https://www.rsc.org/images/entities/char_2009.gif) 10 Fe3O4-pep. The Fe3O4-peps tended to adhere and agglomerate, and the sample dispersity (%) decreased dose-dependently (Fig. 2C). Similar results were obtained by using a Malvern Zetasizer instrument, in which the average particle sizes obtained ranged from 83.5 nm in Fe3O4-SH to 231 nm in Fe3O4-pep with a ratio of 1
10 Fe3O4-pep. The Fe3O4-peps tended to adhere and agglomerate, and the sample dispersity (%) decreased dose-dependently (Fig. 2C). Similar results were obtained by using a Malvern Zetasizer instrument, in which the average particle sizes obtained ranged from 83.5 nm in Fe3O4-SH to 231 nm in Fe3O4-pep with a ratio of 1![[thin space (1/6-em)]](https://www.rsc.org/images/entities/char_2009.gif) :
:![[thin space (1/6-em)]](https://www.rsc.org/images/entities/char_2009.gif) 2.5 (Fig. 2E); the larger sizes measured compared with those by TEM can be reasonably attributed to the adhesion and agglomeration tendencies that were supported by the zeta potential that decreased from 0.628 mV to 0.266 mV (Fig. 2F). Additionally, the S–S stretching between Fe3O4-SH and CGGAAN was successfully confirmed with the obvious absorption peak at approximately 500 cm−1 in the Raman spectrum of the sample Fe3O4-pep (Fig. 2I). Similarly, CGGAAN contains cysteine, glycine, alanine and asparaginate, significant variations in the absorption peaks Vmax/cm−1 615 (FeO), 1354 (CH), 1718 (CO), and 3456 (OH) from Fourier transform infrared spectroscopy (FT-IR) measurements (Fig. 2J) indicated the successful synthesis of Fe3O4-pep by the connection between Fe3O4-SH and CGGAAN.24 The structure and chemical composition of Fe3O4-SH and Fe3O4-peps were revealed from the XRD analysis (Fig. 2K), where the peaks of both samples were indexed to the 220, 311, 400, 331, 422, 511, 440, and 533 planes, which are attributed to the 2θ of 30.46°, 35.76°, 43.51°, 56.69°, 53.24°, 56.88°, 63.32°, and 71.41°, respectively, with the standard diffraction spectrum (ref. code Fe3O4: 01-088-0315),34 indicating no phase change of Fe3O4 by the conjugation of the polypeptide CGGAAN.
2.5 (Fig. 2E); the larger sizes measured compared with those by TEM can be reasonably attributed to the adhesion and agglomeration tendencies that were supported by the zeta potential that decreased from 0.628 mV to 0.266 mV (Fig. 2F). Additionally, the S–S stretching between Fe3O4-SH and CGGAAN was successfully confirmed with the obvious absorption peak at approximately 500 cm−1 in the Raman spectrum of the sample Fe3O4-pep (Fig. 2I). Similarly, CGGAAN contains cysteine, glycine, alanine and asparaginate, significant variations in the absorption peaks Vmax/cm−1 615 (FeO), 1354 (CH), 1718 (CO), and 3456 (OH) from Fourier transform infrared spectroscopy (FT-IR) measurements (Fig. 2J) indicated the successful synthesis of Fe3O4-pep by the connection between Fe3O4-SH and CGGAAN.24 The structure and chemical composition of Fe3O4-SH and Fe3O4-peps were revealed from the XRD analysis (Fig. 2K), where the peaks of both samples were indexed to the 220, 311, 400, 331, 422, 511, 440, and 533 planes, which are attributed to the 2θ of 30.46°, 35.76°, 43.51°, 56.69°, 53.24°, 56.88°, 63.32°, and 71.41°, respectively, with the standard diffraction spectrum (ref. code Fe3O4: 01-088-0315),34 indicating no phase change of Fe3O4 by the conjugation of the polypeptide CGGAAN.
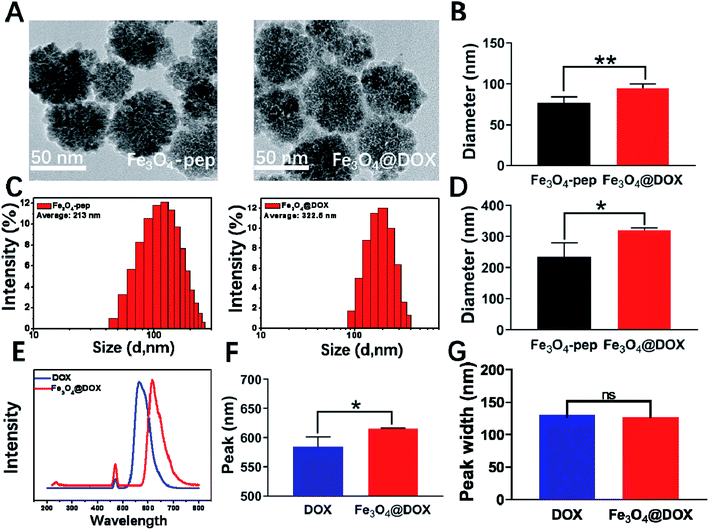
After the connection of DOX to Fe3O4-CGGAAN, the diameter of the synthesized Fe3O4@DOX by TEM was 95 nm (Fig. 3A), which was much smaller than the 322.5 nm (Fig. 3C) measured by the Malvern Zetasizer instrument. This difference can also be explained by the existence of partial adhesion and the appearance of white flocculent substances on the surface of the nanoparticles (Fig. 3A). The spontaneous fluorescence spectrum of DOX was also scanned, and the maximal emission wavelength of DOX was obviously right-shifted from 550 nm for free DOX to 615 nm in the synthesized Fe3O4@DOX without any change in the wave width, implying that DOX was successfully coupled to the Fe3O4-pep particles (Fig. 3E–G). Moreover, the coupling rate of 85% was obtained by calculating the variation in the fluorescence intensity of the free DOX before and after coupling.
3.2. Construction of LGMN-overexpressing PLCs
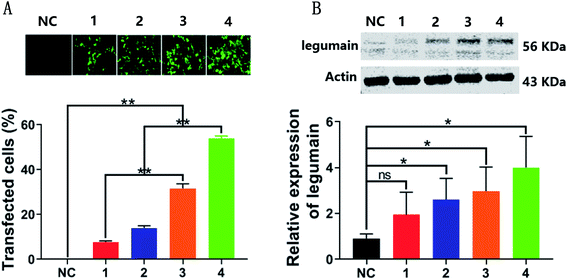
Previous studies have reported that the expression level of LGMN in PLCs is not high when compared with the high expression of LGMN in tumor tissues, therefore, a PLC cell line with a stable and high expression level of LGMN was constructed by using lentivirus infection to assess the in vitro effects of Fe3O4@DOX on tumor cells. The LGMN-overexpressing lentivirus was successfully constructed and harvested with a titer of 5 × 10⁸ TU per mL by cotransfection of the core plasmid PGMLV-CMV-H_LGMN-3 × Flag-EF1-ZsGreen1-T2A-Puro expressing LGMN-GFP and three helper plasmids (VSV-G, GAG, and REV) in HEK293T cells. Then, the PLCs were infected with lentivirus at a series of diluted titers of 4 × 10⁶, 8 × 10⁶, 12 × 106 and 16 × 106 TU per mL. After 15 days of screening with puromycin, four PLCs stably expressing LGMN were obtained where both GFP and LGMN increased dose-dependently. Among them, the number of GFPs in PLCs infected with lentivirus at a titer of 16 × 106 TU per mL reached a maximum of 50%, which was almost 10 times that of the PLCs with the lowest lentivirus titer of 4 × 10⁶ TU per mL. The expression of LGMN was directly proportional to the lentiviral titer of PLCs infected and the expression of LGMN in the control group was very low, which was consistent with previous reports.26 The relative expression of LGMN in PLCs with a lentivirus titer of 16 × 106 TU per mL was approximately 4 times that of negative control. Therefore, we successfully constructed several LGMN-overexpressing PLCs, of which the cell line with the maximum lentiviral titer of 16 × 106 TU per mL was used for subsequent cell uptake and cytotoxicity studies (Fig. 4).3.3. Cellular uptake
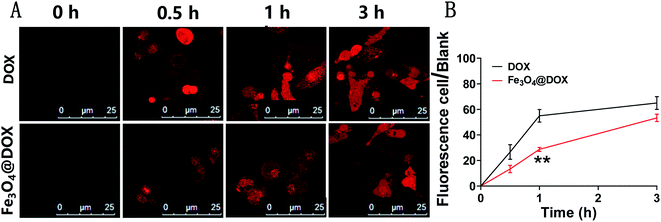
Using the method of scanning the autofluorescence of DOX by laser confocal microscopy, we comparatively studied the cellular uptake of free DOX and Fe3O4@DOX in LGMN-overexpressing PLCs. Free DOX was able to quickly enter LGMN-overexpressing PLCs, approached saturation at approximately 1 h (Fig. 5A), and a high level was maintained for 3 h. In contrast, the entry of DOX from Fe3O4@DOX into cells can be divided into two distinct stages, the fast entry period within 1 h followed by a slow entry period between 1–3 h. Although it is called the fast entry period within 1 h, the speed of DOX from Fe3O4@DOX was much slower than that of free DOX, which is probably due to the slow process of Fe3O4@DOX entering into the cells. After another 2 h of the slow entry period, the amount of intracellular DOX from Fe3O4@DOX in LGMN-overexpressing PLCs was close to that in the free DOX group. In short, Fe3O4@DOX significantly delays the entry of DOX into the cells and has an obvious slow-release effect.3.4. In vitro cytotoxicity and cell apoptosis
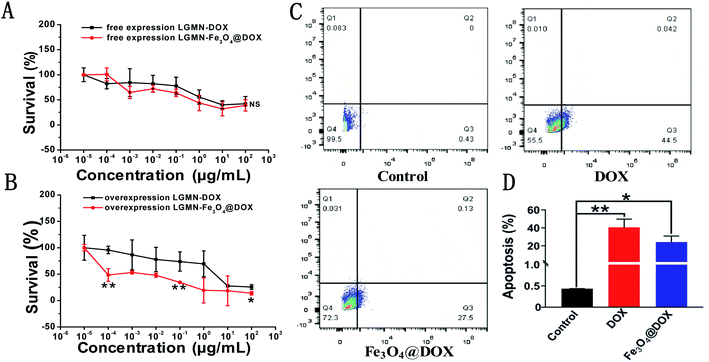
We further studied the cytotoxic effects of free DOX and Fe3O4@DOX on both PLCs and LGMN-overexpressing PLCs using the 3-(4,5-dimethylthiazol-2-yl)-2,5-diphenyltetrazolium bromide (MTT) method. In the range of 10−5 to 100 μg mL−1, we observed that free DOX and Fe3O4@DOX can produce significant toxic effects on both PLCs and LGMN-overexpressing PLCs. Among them, free DOX and Fe3O4@DOX showed considerable toxic effects on PLCs at various concentrations, and there was no significant difference between the two groups (Fig. 6A). In LGMN-overexpressing PLCs, Fe3O4@DOX had a stronger killing effect, especially at low concentrations of 10−5 to 1 μg mL−1, with significant differences (Fig. 6B). The stronger cytotoxicity is probably related to the fact that Fe3O4@DOX is more likely to accumulate in cells by endocytosis, magnetic targeting and natural settlement. We further tested the effects of free DOX and Fe3O4@DOX on cells by flow cytometry and found that both free DOX and Fe3O4@DOX at the same concentration of 10 μg mL−1 can significantly induce apoptosis in LGMN-overexpressing PLCs rather than necrosis (Fig. 6C and D), which is consistent with previous reports.3.5. In vivo antitumor assessment of Fe3O4@DOX
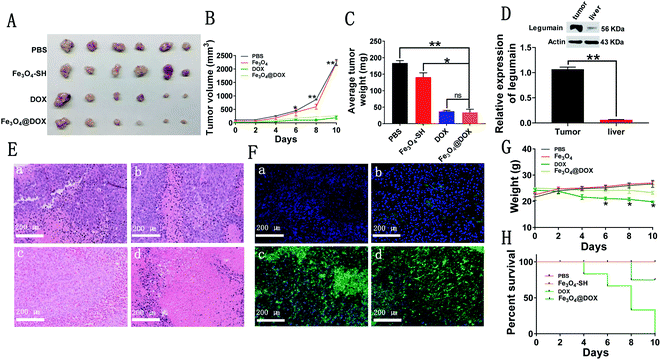
Finally, we implanted PLCs subcutaneously in the left lower extremity of nude mice and successfully generated subcutaneous liver tumor models, which were further used to evaluate the in vivo effects of free DOX and Fe3O4@DOX on liver cancer in nude mice. When the subcutaneous liver tumor grew to approximately 130 mm3, we injected PBS, Fe3O4-SH, free DOX or Fe3O4@DOX into the each group every two days. Compared with the PBS and Fe3O4-SH groups, free DOX and Fe3O4@DOX at the same DOX dose of 5 mg kg−1 i.v. significantly inhibited the growth of the subcutaneous liver tumor volume (Fig. 7A and B). After the administration period of 10 days, we sacrificed the mice and found that the tumors in the free DOX and Fe3O4@DOX groups were significantly smaller and lighter than those in the PBS and Fe3O4-SH groups, and there was no significant difference between the two groups (Fig. 7C). We also confirmed the increase in LGMN in the subcutaneous liver tumor tissues compared with liver tissues by western blot (Fig. 7D). In addition, H&E staining showed that the number of tumor cells in the tumor tissues treated with free DOX and Fe3O4@DOX significantly decreased, whereas the number of dead cells significantly increased (Fig. 7E). TUNEL staining showed that the number of apoptotic cells in tumor tissues increased significantly after treatment with free DOX and Fe3O4@DOX (Fig. 7F), which is consistent with the results from the in vitro flow cytometric experiments. Remarkably, the weights of the nude mice after treatment with free DOX were much lighter than those with Fe3O4@DOX treatment, and all the tested mice were dead within 10 days in the free DOX-treated group; only one mouse died after treatment with Fe3O4@DOX at the same dose of 5 mg kg−1 i.v. All the results indicated that Fe3O4@DOX maintains an equal antagonistic effect to free DOX on subcutaneous liver tumors but significantly reduces the in vivo toxicity of DOX.4. Discussion
Frontier nanobiotechnology research confirms that nanomedicine carriers have great potential for drug delivery, targeted diagnosis, and treatment of cancer.27,35–37 In this study, we produced the magnetic nanoparticle Fe3O4@DOX with three functional elements, Fe3O4-SH, CGGAAN and DOX. Fe3O4-SH is the core magnetic nanoparticle with a diameter of approximate 60 nm as tested by TEM, which has the potential to take drugs to the tumor tissue through the EPR effect and to further enter the cells through endocytosis.38–40 For instances, a multifunctional Janus nanocomposite M-MSNs-DOX was previously engineered with a head of magnetic Fe3O4 and a body of mesoporous SiO2 containing DOX as ‘nano-bullets’, which was determined to induce selective growth inhibition to the cancer cell under magnetic field rather than human normal cells due to its preferable endocytosis by the tumor cells and pH-promoted DOX release in the interior of cancer cells. Park B. J. et al., acquired in vitro MR images of cancer cells (PC-3) and confirmed the good biocompatibility of another magnetic nanoparticle CoFe2O4@HP in both normal and cancer cells, and its potential as an agent for photodynamic therapy (PDT).28 CGGAAN is the short connective peptide between the magnetic particle Fe3O4-SH and the effective antagonistic drug DOX. The AAN motif can be specifically recognized and cut by LGMN, which is highly expressed in solid tumors but not normal tissues. The connection of antitumor drugs to AAN can be specifically cleaved, thereby releasing the drug to kill the tumor.41 Cheng L. et al. used the AAN motif to chemically couple with DOX as a legubicin prodrug, which was proven to reduce the side effects of DOX and to enhance its antitumor effects.29The diameter of the synthesized Fe3O4@DOX was 95 nm as tested by TEM. The larger size of 322.5 nm tested by the Malvern Zetasizer instrument is probably because of the partial adhesion to form tiny unstable particles that cannot be distinguished with naked eyes. XRD is a widely used technique to analyze the crystalline/amorphous nature of nanoparticles along with its phase and purity of sample, in our study, there was no distinct change in structure of Fe3O4@DOX before and after being coupled with CGGAA.30,42 By using LGMN-overexpressing PLCs, we found that Fe3O4@DOX has a slow-release effect, where the entry of DOX from Fe3O4@DOX into cells is much slower than that of free DOX, which can be easily explained by the process of endocytosis and is specifically cut by LGMN. Moreover, the in vitro MTT and flow cytometric experiments showed that Fe3O4@DOX can induce similar cell apoptosis to that of free DOX and has more sensitive toxicity to PLCs at low DOX concentrations, indicating the maintenance of DOX cytotoxicity and magnetic targeting. The most important results came from the in vivo antitumor assessment, where Fe3O4@DOX maintains an equal antagonistic effect to free DOX on subcutaneous liver tumors but significantly reduces the in vivo toxicity of DOX.
Eva K. Schlachter et al., used Magnetic Resonance Imaging Technology to evaluate the in vivo degradation of iron oxide magnetic nanoparticle patches, and carried out iron content localization and biodistribution. None of the histological examinations showed that the ferromagnetic nanoparticles degraded or aggregated outside the reticuloendothelial system. TEM observed local uptake of ferromagnetic nanoparticles by macrophages and reticuloendothelial cells. Apoptosis staining of caspase cells showed no significant increase in toxicity. The ferromagnetic nanoparticle patch in animals is relatively inert within 6 months, and local degradation is slow. No distant structural changes were observed in the tissues studied. Therefore, Fe3O4 used in this study is predicted to be of low toxicity and has no effect on the use of Fe3O4@DOX as the ferromagnetic DOX carrier.
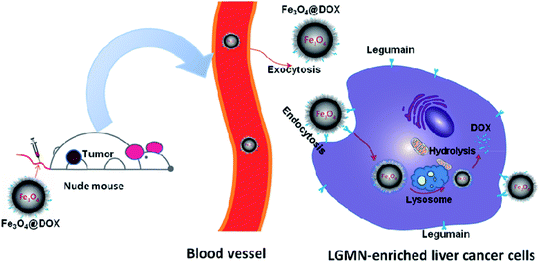
All the above investigations draw the conclusion that we have successfully synthesized a novel magnetic nanoparticle Fe3O4@DOX that maintains the antagonistic effects of DOX on a subcutaneous liver cancer model while reducing the in vivo toxicity. The inhibitory process is hypothesized as follows (Fig. 8). When intravenous Fe3O4@DOX reach the tumor and contact the liver tumor cells through the EPR effect in nude mice, the AAN motif in Fe3O4@DOX will first be recognized and cut by the LGMN on the surface of the tumor or cells, thereby releasing DOX to start the effect of killing tumor cells. Meanwhile, the unreleased DOX in Fe3O4@DOX will then enter the tumor cells through endocytosis, and be released by intracellular LGMN to further kill the tumor cells. Because the Fe3O4@DOX can accumulate in tumor through the EPR effect and the LGMN is highly expressed in solid tumor than that in normal tissues, DOX in Fe3O4@DOX is supposed to be specifically targeted to the solid tumor and therefore reduces the in vivo toxicity while maintains its antagonistic effects. In an all, we have successfully synthesized the magnetic nanoparticle Fe3O4@DOX as a promising prodrug of DOX for liver cancer treatment.
Conflicts of interest
The authors declare no conflicts of interest.Acknowledgements
This work was supported by the Regional Science Foundation (2017D01C207).References
- L. Che, M. G. Pilo, A. Cigliano, G. Latte, M. M. Simile, S. Ribback, F. Dombrowski, M. Evert, X. Chen and D. F. Calvisi, Cell Cycle, 2017, 16, 499–507 CrossRef CAS.
- J. A. Gingold, D. Zhu, D. F. Lee, A. Kaseb and J. Chen, Trends Mol. Med., 2018, 24, 395–411 CrossRef CAS.
- L. A. Torre, F. Bray, R. L. Siegel, J. Ferlay, J. Lortet-Tieulent and A. Jemal, Ca-Cancer J. Clin., 2015, 65, 87–108 CrossRef.
- F. Bray, J. Ferlay, I. Soerjomataram, R. L. Siegel, L. A. Torre and A. Jemal, Ca-Cancer J. Clin., 2018, 68, 394–424 CrossRef.
- K. N. Lokesh, T. Chaudhuri, K. C. Lakshmaiah, K. G. Babu, L. Dasappa, L. A. Jacob, M. C. Suresh Babu, A. H. Rudresha and L. K. Rajeev, Indian J. Cancer, 2017, 54, 526–529 CrossRef CAS.
- J. Ferlay, I. Soerjomataram, R. Dikshit, S. Eser, C. Mathers, M. Rebelo, D. M. Parkin, D. Forman and F. Bray, Int. J. Cancer, 2015, 136, E359–E386 CrossRef CAS.
- I. Labgaa, N. Demartines and E. Melloul, Hepatology, 2019, 69, 923 CrossRef.
- S. Mura, J. Nicolas and P. Couvreur, Nat. Mater., 2013, 12, 991–1003 CrossRef CAS.
- O. Tredan, C. M. Galmarini, K. Patel and I. F. Tannock, J. Natl. Cancer Inst., 2007, 99, 1441–1454 CrossRef CAS.
- P. C. Lyon, M. D. Gray, C. Mannaris, L. K. Folkes, M. Stratford, L. Campo, D. Y. F. Chung, S. Scott, M. Anderson, R. Goldin, R. Carlisle, F. Wu, M. R. Middleton, F. V. Gleeson and C. C. Coussios, Lancet Oncol., 2018, 19, 1027–1039 CrossRef CAS.
- H. Cabral, K. Miyata, K. Osada and K. Kataoka, Chem. Rev., 2018, 118, 6844–6892 CrossRef CAS PubMed.
- K. Prusty and S. K. Swain, Int. J. Biol. Macromol., 2019, 126, 765–775 CrossRef CAS PubMed.
- C. Ash, G. Town, R. Whittall, L. Tooze and J. Phillips, Lasers Med. Sci., 2017, 32, 1927–1933 CrossRef.
- H. J. Lee and Y. Y. Lee, Pharmazie, 2010, 65, 520–522 Search PubMed.
- X. Chen, L. Tan, T. Liu and X. Meng, Curr. Drug Delivery, 2017, 14, 307–322 CrossRef CAS.
- S. Kwiatkowski, B. Knap, D. Przystupski, J. Saczko, E. Kedzierska, K. Knap-Czop, J. Kotlinska, O. Michel, K. Kotowski and J. Kulbacka, Biomed. Pharmacother., 2018, 106, 1098–1107 CrossRef CAS.
- J. L. Corchero and A. Villaverde, Trends Biotechnol., 2009, 27, 468–476 CrossRef CAS PubMed.
- C. Shen, X. Wang, Z. Zheng, C. Gao, X. Chen, S. Zhao and Z. Dai, Int. J. Nanomed., 2019, 14, 101–117 CrossRef CAS.
- L. Mohammed, D. Ragab and H. Gomaa, Curr. Pharm. Des., 2016, 22, 3332–3352 CrossRef CAS.
- P. A. Kotelnikova, V. O. Shipunova, U. F. Aghayeva, O. A. Stremovskiy, M. P. Nikitin, I. A. Novikov, A. A. Schulga, S. M. Deyev and R. V. Petrov, Dokl. Biochem. Biophys., 2018, 481, 198–200 CrossRef CAS PubMed.
- R. Hao, R. Xing, Z. Xu, Y. Hou, S. Gao and S. Sun, Adv. Mater., 2010, 22, 2729–2742 CrossRef CAS PubMed.
- J. Park, N. R. Kadasala, S. A. Abouelmagd, M. A. Castanares, D. S. Collins, A. Wei and Y. Yeo, Biomaterials, 2016, 101, 285–295 CrossRef CAS PubMed.
- B. Manoury, E. W. Hewitt, N. Morrice, P. M. Dando, A. J. Barrett and C. Watts, Nature, 1998, 396, 695–699 CrossRef CAS.
- C. Liu, C. Sun, H. Huang, K. Janda and T. Edgington, Cancer Res., 2003, 63, 2957–2964 CAS.
- V. Andrade, M. Guerra, C. Jardim, F. Melo, W. Silva, J. M. Ortega, M. Robert, M. H. Nathanson and F. Leite, J. Hepatol., 2011, 55, 626–635 CrossRef CAS.
- W. Sun, Y. Lin, L. Chen, R. Ma, J. Cao, J. Yao, K. Chen and J. Wan, Gene, 2018, 652, 16–24 CrossRef CAS PubMed.
- E. Dall and H. Brandstetter, Biochimie, 2016, 122, 126–150 CrossRef CAS.
- B. J. Park, K. H. Choi and K. C. Nam, J. Nanosci. Nanotechnol., 2015, 15, 7900–7906 CrossRef CAS PubMed.
- C. Liu, C. Sun and K. Janda, Cancer Res., 2003, 63, 2957–2964 CAS.
- P. Guo, Z. Zhu, Z. Sun, Z. Wang, X. Zheng and H. Xu, PLoS One, 2013, 8, e73090 CrossRef CAS.
- M. Poreba, Biol. Chem., 2019, 400, 1529–1550 CAS.
- S. Shabalala, C. J. F. Muller, J. Louw and R. Johnson, J. Life Sci., 2017, 180, 160–170 CrossRef CAS PubMed.
- A. M. Meredith and C. R. Dass, J. Pharm. Pharmacol., 2016, 68, 729–741 CrossRef CAS.
- K. Kalantari, M. Bin Ahmad, K. Shameli and R. Khandanlou, Int. J. Nanomed., 2013, 8, 1817–1823 Search PubMed.
- W. Hu, M. Ying, S. Zhang and J. Wang, J. Biomed. Nanotechnol., 2018, 14, 1359–1374 CrossRef CAS.
- H. Wang, W. Zhu, J. Liu, Z. Dong and Z. Liu, ACS Appl. Mater. Interfaces, 2018, 10, 14475–14482 CrossRef CAS PubMed.
- S. Laurent, D. Forge, M. Port, A. Roch, C. Robic, L. Vander Elst and R. N. Muller, Chem. Rev., 2008, 108, 2064–2110 CrossRef CAS PubMed.
- E. K. Schlachter, H. R. Widmer, A. Bregy, T. Lönnfors-Weitzel, I. Vajtai, N. Corazza, V. J. Bernau, T. Weitzel, P. Mordasini, J. Slotboom, G. Herrmann, S. Bogni, H. Hofmann, M. Frenz and M. Reinert, Int. J. Nanomed., 2011, 6, 1793–1800 CAS.
- Y. N. Zhang, W. Poon, A. J. Tavares, I. D. McGilvray and W. C. W. Chan, J. Controlled Release, 2016, 240, 332–348 CrossRef CAS PubMed.
- D. Kalyane, N. Raval, R. Maheshwari, V. Tambe, K. Kalia and R. K. Tekade, Mater. Sci. Eng., C, 2019, 98, 1252–1276 CrossRef CAS.
- D. Shao, J. Li, X. Zheng, Y. Pan, Z. Wang, M. Zhang, Q. X. Chen, W. F. Dong and L. Chen, Biomaterials, 2016, 100, 118–133 CrossRef CAS PubMed.
- S. Parveen, A. H. Wani, M. A. Shah, H. S. Devi, M. Y. Bhat and J. A. Koka, Microb. Pathog., 2018, 115, 287–292 CrossRef CAS PubMed.
Footnote |
| † These authors contributed equally to this work. |
| This journal is © The Royal Society of Chemistry 2020 |

