 Open Access Article
Room temperature ferromagnetism in D–D neutron irradiated rutile TiO2 single crystals
Huan Liua,
Gongping Li *a,
Dejun Ea,
Nannan Xub,
Qiaolu Lina,
Xudong Gaoa,
Changlin Lana,
Jingsheng Chen
 c,
Canglong Wangb,
Xuwen Zhana and
Kai Zhangd
aSchool of Nuclear Science and Technology, Lanzhou University, Lanzhou, Gansu 730000, China. E-mail: ligp@lzu.edu.cn
bInstitute of Modern Physics, Chinese Academy of Sciences, Lanzhou, Gansu 730000, China
cDepartment of Materials Science and Engineering, National University of Singapore, Singapore 117608, Singapore
dChina Institute of Atomic Energy, Beijing 102413, China
First published on 18th May 2020
Abstract
Room temperature ferromagnetism (RTFM) was observed in unirradiated rutile TiO2 single crystals prepared by the floating zone method due to oxygen vacancy (VO) defects. D–D neutrons mainly collide elastically with TiO2, producing VO, titanium vacancies (VTi) and other point defects; the density and kind of defect is related to the neutron irradiation fluence. D–D neutron irradiation is used to regulate the concentration and type of defect, avoiding impurity elements. As the irradiation fluence increases, the saturation magnetization (Ms) first increases, then decreases and then increases. To verify the origin of RTFM, the CASTEP module was used to calculate the magnetic and structural properties of point defects in TiO2. VO induces a 2.39 μB magnetic moment, Ti3+ and F+ induce 1.28 μB and 1.70 μB magnetic moments, respectively, while VTi induces a magnetic moment of ∼4 μB. Combining experimental and theoretical results, increases in VO concentration lead to Ms increases; more VO combine with electrons to form F+, inducing a smaller magnetic moment. VO and VTi play a key role and Ms changes accordingly with larger fluence. VO, F+ and VTi are the most likely origins of RTFM.
1 Introduction
TiO2 is a versatile functional material that has important applications1–3 in the fabrication of spintronics, optical coatings and solar cells. TiO2 doped with different ions has been synthesized4–6 to modify its ferromagnetic and optical properties. TiO2 also has outstanding magnetic properties, showing RTFM in both ion-doped and undoped states. However, there is no consensus on the origin of magnetism of TiO2, and some experimental results contradict each other. Kaspar et al.7 pointed out that extended structural defects appear to be necessary to promote ferromagnetic ordering in Cr:TiO2. Saadaoui et al.8 found that the ferromagnetism is intrinsic and controlled by oxygen vacancies. Zheng et al.9 reported that oxygen defects can be the dominating factor for increasing the saturation moment of Cu-doped TiO2 film. Zhou et al.10 found that ferromagnetism was related to a lower level of VO defects. Parras et al.11 pointed out that the magnetic moment is indeed due to the Ti3+ ions induced by reduction. Wang et al.12 reported that VTi could be the origin of RTFM.Defects play an important role in the structural, magnetic and optical properties of semiconductor materials; in particular, the intrinsic defects of TiO2 have the potential to induce spintronic properties at room temperature. Magnetic semiconductors with high Curie temperatures are expected to be used in spintronic materials with great potential applications because they can utilize both charge and spin degrees of freedom in a single component. Venhatesan and Coey et al.13 reported that HfO2 films have high-temperature ferromagnetism and first proposed the concept of d0 magnetism. They avoided the interference of the second phase of magnetic elements in dilute magnetic semiconductors (DMS) and only studied the effect of intrinsic defects. Since then, many research groups have studied defects causing RTFM in TiO2-based DMS materials.
In our previous work, the magnetic properties of Cu-doped TiO2 were investigated14,15 by theoretical and experimental studies. RTFM may be induced by VO or Cu2+–VO; the effects of intrinsic defects and Cu-doping are ambiguous. The effects of γ-ray and D–D neutron irradiation16,17 on the RTFM of TiO2 single crystals were initially explored. RTFM was observed, and VO was the main origin of room temperature ferromagnetism. D–D neutrons mainly scatter with TiO2 single crystals; they have the right energy to cause vacancy defects, but not to produce a nuclear reaction at a higher energy or capture neutrons at a lower energy. Furthermore, because D–D neutron fluence could regulate the concentration and kind of defect, it is beneficial to explore the effect of intrinsic defects on RTFM properties. The effects of different defect concentrations and types on ferromagnetism can be obtained by adjusting the neutron fluence. Using D–D neutron irradiation has significant advantages over doping with other magnetic elements to clarify the origin of RTFM.
In this study, to illustrate the effect of intrinsic defects on magnetic and structural properties and optical band gap, D–D neutron irradiation was carried out to verify the effect of intrinsic defects in rutile TiO2 single crystals. In addition, we use the CASTEP module based on a density functional theory (DFT) method to calculate the magnetic properties of intrinsic vacancy defects. This lays a foundation for the application of TiO2 in photocatalysis and spintronics.
2 Materials and methods
Pure TiO2 single crystals from MaTeck prepared by the floating zone method with one side polished were cut to 5 × 10 × 0.5 mm3. D–D neutron irradiation with fluences of 0 n cm−2, 2 × 10⁹ n cm−2, 5 × 10⁹ n cm−2, 1 × 10¹⁰ n cm−2, and 2.5 × 10¹⁰ n cm−2 was used.X-ray diffraction (XRD, D/Max-2400) with Cu Kα radiation (λ = 0.15406 nm) was used to characterize the structure of TiO2. The working voltage is 40 kV, the working current is 60 mA, the step length is 0.02°, the scanning speed is 20° min−1, and the scanning range is 20–80°. The excitation wavelength of the Raman spectrum is 532 nm, the laser power of the backscattering mode is 10 mW, and the spot size is 2 μm. The Raman displacement range is 100–1000 cm−1 and the integral time is 10 s. Three points were selected from each sample for testing. A superconducting quantum interferometer (SQUID) was used to measure the M–H curves under an external magnetic field parallel to the surface of the sample. X-ray photoelectron spectroscopy (XPS) was conducted using a PHI-5702 multi-functional electronic spectrometer. A conductive adhesive was used to stick the sample to the sample rack, with the polished surface facing out. The wide spectra (0–1000 eV), Ti (450–468 eV) and O (525–537 eV), and C (274–296 eV) fine spectra were tested, respectively. The photon energy of the X-ray source with Al as the anode material is 1486.6 eV. The photoluminescence (PL) source is a xenon lamp with an excitation source wavelength of 415 nm and a spectral range of 450–750 nm. Electron spin resonance (ESR) spectra were tested on a Bruker EMX plus at 2 K at the Steady High Magnetic Field Facilities, High Magnetic Field Laboratory, CAS. The samples were cut to 2 mm × 2 mm for testing. The magnetic field range is 2900–3900 G and the microwave frequency is 9.4 GHz. The ultraviolet visible (UV-vis) spectra were obtained in reflection mode with the measurement range of 300–700 nm.
3 Results and discussion
Fig. 1 represents the XRD patterns after neutron irradiation. There are TiO2 (002) and Cu Kα peaks in the spectra. The full width at half maximum (FWHM) of the (002) peak is very small, indicating that the single crystals have high crystallinity. The (002) peak shows a small shift toward a small angle, which means that the lattice expands a little due to the repulsion force between the oxygen vacancies. Fig. 1(b) shows two small peaks at 56.4° and 60.7°, corresponding to Ti2O3 and Ti3O5, which indicates that TiO2 is non-stoichiometric.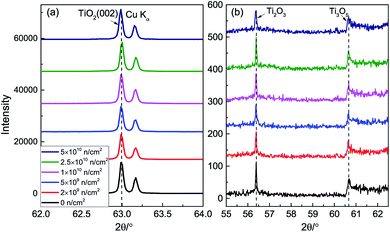 | ||
| Fig. 1 XRD patterns; (a) (002) peak and (b) drawing of partial enlargement of TiO2 before and after neutron irradiation. | ||
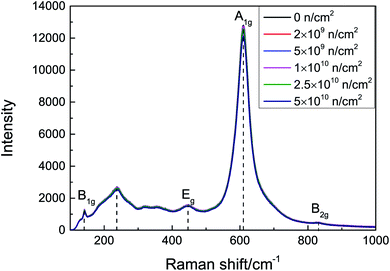
The space group18 of rutile TiO2 is D4h14, and the Raman-active vibrational energy levels are B1g (143 cm−1), Eg (447 cm−1), A1g (611 cm−1), and B2g (828 cm−1). The scattering intensity is proportional to the number of corresponding molecules and is related to the smoothness of the surface and diffuse reflection. The Raman spectra of the samples before and after irradiation are presented in Fig. 2. There is an asymmetrical broad peak at 235 cm−1, corresponding to the second-order scattering of phonons or internal disorder. The damage can be described by the FWHM of the A1g peaks; as the irradiation fluence increases, the A1g peak still maintains a good FWHM. No peak shift or new vibration level was observed, which indicates that no obvious lattice damage was caused by neutron irradiation.
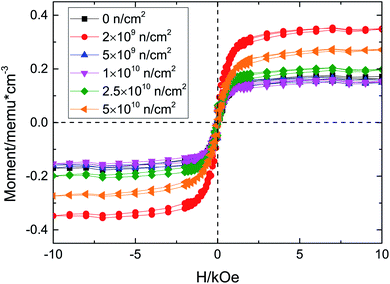
Fig. 3 illustrates the M–H curves before and after D–D neutron irradiation. All the samples exhibit RTFM, including the unirradiated sample, which agrees with the experimental results19 and our preliminary work.17 Oxygen deficiencies are inevitably introduced in the preparation by the floating zone method;20,21 VO would induce a magnetic moment. Santara et al.19 reported that VO induced strong ferromagnetism at and above room temperature in undoped TiO2 nanoporous nanoribbons. Furthermore, Kim et al.22 pointed out that oxygen vacancy defects play an important role in the ferromagnetism of undoped rutile TiO2. Moreover, our previous work,17 using γ-ray irradiated TiO2, also found that the origin of RTFM of unirradiated TiO2 single crystals was VO; thus the RTFM of unirradiated TiO2 is due to VO. D–D neutron irradiation has advantages in regulating the concentrations and kinds of defect; because of its energy it only collides with atoms in elastic scattering and the nuclear reaction cross section is 0, so no nuclear reaction occurs. Therefore, D–D neutron irradiation has been used to regulate defect concentration and type to study changes of RTFM.
The maximum saturation magnetization (Ms) is in the 2 × 10⁹ n cm−2 sample, while the Ms of the 5 × 10⁹ n cm−2 and 1 × 10¹⁰ n cm−2 samples are almost equal to that of the unirradiated sample. Then, the Ms increased with the irradiation fluence, which means that there is an optimal value for VO defect concentration. D–D neutron irradiation mainly causes point vacancy defects. Considering the XRD and Raman results and the physical process of D–D neutron irradiation of TiO2, the ferromagnetism may due to vacancy defects, such as VO, VTi, and so on. In our previous work, we found that VO could induce ∼2 μB magnetic moment, while VTi could introduce ∼4 μB magnetic moment, which we will verify below. After D–D neutron irradiation, VO and VTi are induced due to the elastic collisions between neutrons and Ti and O atoms; these defects increase Ms. For the 5 × 10⁹ n cm−2 and 1 × 10¹⁰ n cm−2 samples, Ms decreases on account of the compound defects that VO make up with other defects,10 e.g., F+, VO–Ti3+; these defects provide a smaller magnetic moment, so the total magnetic moment of the system is decreased. We preliminarily studied the Doppler broadening and positron annihilation spectroscopy16,23,24 of Cu-doped and D–D neutron irradiated TiO2, and VTi was found after spectral analysis. VTi would certainly be generated after D–D neutron irradiation of TiO2 single crystals. Below, we will further investigate the increase due to the VTi and VO defects produced when the fluence increased for the 2.5 × 10¹⁰ n cm−2 and 5 × 10¹⁰ n cm−2 samples.
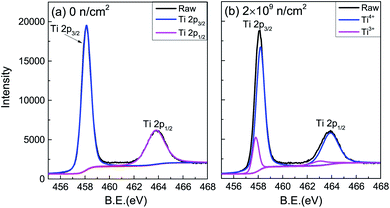
The valence of Ti after irradiation was characterized by XPS spectra.25–27 Only Ti, O and C could be detected. Using C 1 s (284.6 eV) for charge correction, the Ti 2p core electron spectra of the unirradiated and 2 × 10⁹ n cm−2 samples are shown in Fig. 4. The peak separation fitting of the Ti 2p spectra was performed by the Gauss–Lorentz function. The Ti4+ 2p3/2 and 2p1/2 binding energies were 458.5 eV and 464.2 eV, respectively, and the energy level spacing28,29 was 5.7 eV for Ti4+ and 5.2 eV for Ti3+. After peak-differentiation and imitation, the unirradiated sample still showed +4 valence. Ti3+ was produced in irradiated TiO2, proving that VO was indirectly generated after irradiation. Ti3+ contributes a paramagnetic signal,30 and the Ti3+ peak area shows no obvious change with the increased irradiation dose, which is inconsistent with the change of Ms.
To investigate the defect type after neutron irradiation, PL spectra are displayed in Fig. 5(a). After peak separation, the three main peaks are centered at 473 nm (2.62 eV), 600 nm (2.07 eV) and 820 nm (1.51 eV), as shown in Fig. 5(b). As the PL spectra are similar, we choose the 2 × 10⁹ n cm−2 sample for detailed analysis. In TiO2, the electron trap state caused by VO is about 0.5–1 eV below the bottom of the conduction band.31 Therefore, the band peak at 473 nm is assigned to VO and the deep level emission32,33 of VO, which is consistent with the first principles calculation below. The 600 nm luminescence peak is attributed to the consequence of polarization of the lattice ions surrounding the vacancy.34 The peak at 818 nm might be a consequence of Ti3+ or F+ defects. Table 1 shows the area of the peaks after normalization. The area of the 473 nm peak is found to vary according to the change of Ms; this is direct evidence that VO causes RTFM. With the increase of neutron injection, VO gradually forms an extinction center; more and more VO combine with electrons to form F+.35 F+ induce a smaller magnetic moment, leading to a decrease in Ms. In a word, VO was produced after neutron irradiation of TiO2.
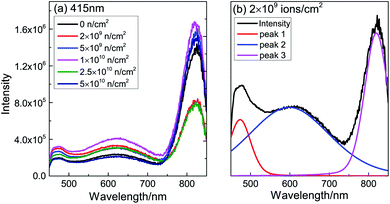 | ||
| Fig. 5 (a) Raw PL spectra of TiO2 before and after neutron irradiation and (b) normalized PL spectra for 2 × 10⁹ n cm−2. | ||
| Sample (n cm−2) | 473 nm | 600 nm | 820 nm |
|---|---|---|---|
| 0 | 0.0777 | 0.3424 | 0.5798 |
| 2 × 10⁹ | 0.1195 | 0.5308 | 0.3496 |
| 5 × 10⁹ | 0.0889 | 0.3729 | 0.5382 |
| 1 × 10¹⁰ | 0.0871 | 0.4241 | 0.4888 |
| 2.5 × 10¹⁰ | 0.0970 | 0.5195 | 0.3835 |
| 5 × 10¹⁰ | 0.0751 | 0.2944 | 0.6305 |
The CASTEP module was used to calculate the density of states (DOS) of TiO2, which is based on a plane wave pseudo-potential method and DFT. The electron exchange correlation function is treated using a generalized gradient approximation (GGA) exchange-correlation functional in the form of Perdew–Bruke–Ernzerhof (PBE). GGA+U methods36,37 were considered to give a proper description of the strong correlation effects. The Hubbard U was employed as UTi,d = 6.47 eV, UO,p = 4.3 eV. The Monkhorst–Pack scheme k-point mesh was 2 × 2 × 3 for the 2 × 2 × 2 supercell. The calculation ensured an energy convergence of 1 × 10⁻⁶ eV per atom and the cut-off energy was 340 eV.
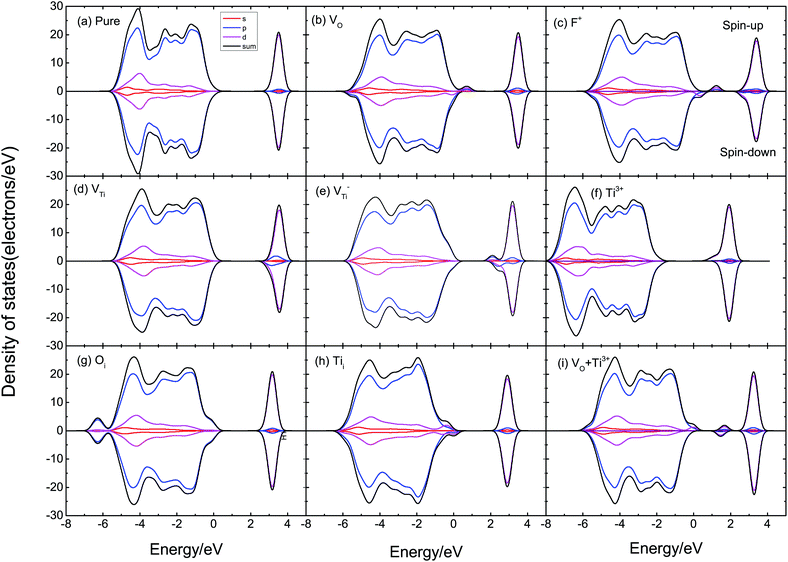
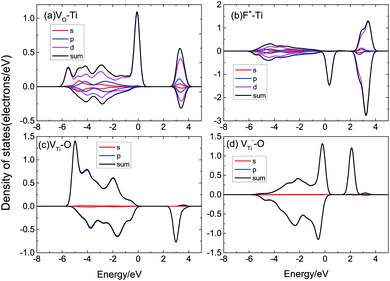
According to Fig. 6, we can find that the DOS of supercells with VO, VTi, and F+ defects are asymmetric, indicating that supercells with these defects have a magnetic moment. As displayed in Fig. 6(a), pure TiO2 has symmetric DOS and spin-zero ground states; it does not show magnetism. VO defects could induce a magnetic moment in TiO2, as shown in Fig. 6(b). We also calculated F+, VTi, V−Ti, Ti3+, Oi, Tii, VO–Ti3+, as shown in Fig. 6(c)–(i). The supercells with F+ and Ti3+ are found to have lower magnetic moments of 1.28 μB and 1.70 μB, respectively, while the supercell with Oi could not induce a magnetic moment. When there is VTi or Tii, its DOS is spin-polarized and the system has a magnetic moment of ∼4 μB. The supercell with VO–Ti3+ induces a magnetic moment about the same as that of VO.
The magnetic moment of the VO system is 2.39 μB. The partial densities of states (PDOS) of Ti with VO are shown in Fig. 7(a); the magnetic moment arises from the 3d orbital electrons of the Ti atoms around VO. When there is VO, the Ti atoms around VO are repelled by the VO, then the electron population of the Ti 3d orbital varies, causing spin-polarization in the system. It can be seen that F+ induces a 1.28 μB magnetic moment. F+ provides a lower magnetic moment than VO, as shown in Fig. 7(b); its magnetic moment is also due to the asymmetric PDOS of the Ti 3d orbital. VTi can induce a 4.53 μB magnetic moment due to the O 2p orbital hybridization, as shown in Fig. 7(c). Fig. 7(d) shows the PDOS of O 2p of V−Ti. For Ti vacancies with various valence states, the titanium vacancy with negatively monovalent charge (V−Ti) is more stable under different conditions.38 According to our calculations, V−Ti induces ∼4 μB magnetic moment, which is almost consistent with the magnetic moment introduced by the neutral VTi.
Combining the above experimental and theoretical calculation results, we infer that the magnetism in TiO2 after D–D neutron irradiation is caused by VO, VTi and F+. Besides, we also calculated the defect formation energies of these kinds of point and compound defects, as shown in Table 2. We used the following formula to calculate defect formation energy (Ef):39–41
| Ef = E(D) − E(TiO2) + n1μ(O) + n2μ(Ti) + qEF | (1) |
| E(TiO2) = μ(Ti) + 2μ(O) | (2) |
| Ef/eV | VO | VTi | Oi | Tii |
|---|---|---|---|---|
| O-rich | 7.00 | 0.57 | 0.58 | 11.89 |
| O-poor | 2.41 | 8.62 | 5.17 | 2.71 |
The results were different in the O-rich and O-poor cases. VO is more easily formed than VTi in terms of the energy of dislocation threshold and defect formation. Therefore, it is easier to form VO, VTi, F+, Ti3+ and VO–Ti3+ than Tii defects in the atmosphere, and the most likely origin of magnetism in TiO2 is VO, VTi, F+ and Ti3+. For unirradiated TiO2, native VO defects induced RTFM. After D–D neutron irradiation, the defect concentration increases with the irradiation fluence, and the defect type also changes. More and more VO and VTi provide conditions for the formation of other defects; Ti3+, F+ and other compound defects (VO + Ti3+ and so on) are produced, and the density of these defects becomes higher and higher with the increase of neutron irradiation fluence. We also found that VO can induce a 2.39 μB magnetic moment. Ti3+ and F+ defects introduce smaller magnetic moments that cause the RTFM of the 5× 10⁹ n cm−2 and 1 × 10¹⁰ n cm−2 samples to decrease. Bao et al.42 proposed that the RTFM may be due to the formation of VTi from the substitution of Ga for Ti, and VTi was verified by positron annihilation spectroscopy. Qin et al.43 reported that the RTFM is attributed to VTi and NO defects in the rutile structure. Then, more VTi and VO play a key role in increasing the RTFM of the 2.5 × 10¹⁰ n cm−2 and 5 × 10¹⁰ n cm−2 samples.
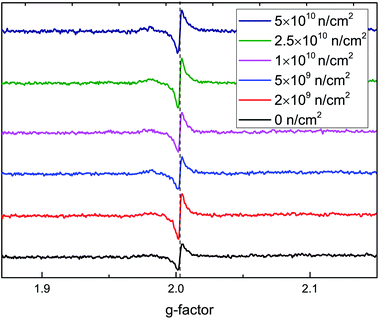
To further verify that the RTFM is caused by VO defects, ESR spectra at 2 K are shown in Fig. 8. A peak was found around a g-factor of 2.003, which was assigned to an oxygen vacancy binding a single electron44 in rutile TiO2. The signal intensity first increases and then decreases, then increases with the increase in irradiation fluence, which is in accordance with the M–H curves. From the above analysis, the highest concentration of VO is induced by 2 × 10⁹ n cm−2; it also causes the greatest changes in magnetism.
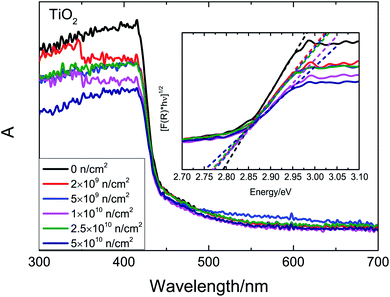
The UV-Vis absorption spectra after irradiation are shown in Fig. 9. According to first-principles calculations, a strong absorption at 420 nm is inherent. The optical band gap (Eg) is estimated by the K–M function. The Eg decreases gradually with the increase in fluence. Based on our previous analysis and theoretical research,14,45 VO, VTi and VO–Ti3+ defects introduce unpaired states in the band gap, which could narrow the band gap. As the fluence increases, ever larger concentrations of defects and ever thicker defect states imply an ever narrower band gap. With the increase in irradiation fluence, the total defect concentration increases, and the change of defect types causes the Ms to change.
4 Conclusion
In summary, we found that the origin of RTFM of unirradiated TiO2 is VO. D–D neutron irradiation was used to engineer the defect concentration and type. After D–D neutron irradiation, the Ms increases with the increasing concentration of VO and VTi. As the neutron irradiation fluence increases, more and more VO combine electrons to form F+. F+ induce a smaller magnetic moment, leading to a decrease in Ms. With further increases of the irradiation fluence, VTi and VO play an important role in increasing the magnetic moment. Therefore, RTFM is caused by VO, F+, and VTi. The optimal fluence of D–D neutron irradiation remains to be further explored.Conflicts of interest
There are no conflicts to declare.Acknowledgements
This work was supported by the National Natural Science Foundation of China (11575074, 11975006, 11905089), the Key Laboratory of Special Function Materials and Structure Design, Ministry of Education, Lanzhou University (lzujbky-2018-kb06), the Fundamental Research Funds for the Central Universities of Ministry of Education of China (lzujbky-2017-it39, lzujbky-2018-it38), the DSTI Foundation of Gansu (2018ZX-07). A portion of this work was performed at the Steady High Magnetic Field Facilities, High Magnetic Field Laboratory, CAS.Notes and references
- U. Bach, D. Lupo, P. Comte, J. E. Moser, F. Weissörtel, J. Salbeck, H. Spreitzer and M. Grätzel, Nature, 1998, 395, 583–585 CrossRef CAS.
- R. Asahi, T. Morikawa, T. Ohwaki, K. Aoki and Y. Taga, Science, 2001, 293, 269–271 CrossRef CAS PubMed.
- H. Yaghoubi, N. Taghavinia and E. K. Alamdari, Surf. Coat. Technol., 2010, 204, 1562–1568 CrossRef CAS.
- V. R. Singh, K. Ishigami, V. K. Verma, G. Shibata, Y. Yamazaki, T. Kataoka, A. Fujimori, F. H. Chang, D. J. Huang and H. J. Lin, Appl. Phys. Lett., 2012, 100, 242404 CrossRef.
- S. K. S. Patel, S. Kurian and N. S. Gajbhiye, AIP Adv., 2012, 2, 012107 CrossRef.
- A. R. Barman, A. Annadi, K. Gopinadhan, W. M. Lu and T. Venkatesan, AIP Adv., 2012, 2, 1883 Search PubMed.
- T. C. Kaspar, T. C. Droubay, V. Shutthanandan, S. M. Heald and S. A. Chambers, Phys. Rev. B: Condens. Matter Mater. Phys., 2006, 73, 155327 CrossRef.
- H. Saadaoui, X. Luo, Z. Salman, X. Y. Cui, N. N. Bao, P. Bao, R. K. Zheng, L. Tseng, Y. H. Du and T. Prokscha, Phys. Rev. Lett., 2016, 117, 227202 CrossRef CAS PubMed.
- J. Y. Zheng, S. H. Bao, Y. H. Lv and P. Jin, ACS Appl. Mater. Interfaces, 2014, 6, 22243–22249 CrossRef CAS PubMed.
- Z. Zhou, H. Wang, Z. Zou, D. Meng, J. Guo and Z. Yang, Mater. Res. Bull., 2017, 86, 287–297 CrossRef CAS.
- M. Parras, A. Varela, R. Cortes-Gil, K. Boulahya, A. Hernando and J. M. Gonzalez-Calbet, J. Phys. Chem. Lett., 2013, 4, 2171–2176 CrossRef CAS.
- W. Songbo, P. Lun, S. Jia-Jia, M. Wenbo, Z. Ji-Jun, W. Li and Z. Xiangwen, J. Am. Chem. Soc., 2015, 137, 2975–2983 CrossRef PubMed.
- M. Venkatesan, C. B. Fitzgerald and J. M. D. Coey, Nature, 2004, 430, 630 CrossRef CAS PubMed.
- Q. L. Lin, G. P. Li, N. N. Xu, H. Liu and C. L. Wang, Acta Phys. Sin., 2017, 66, 302–315 CrossRef.
- H. Liu, G. P. Li, N. N. Xu, Q. L. Lin, L. Yang and C. L. Wang, Acta Phys. Sin., 2016, 65, 185–193 CrossRef PubMed.
- N. N. Xu, G. P. Li, X. D. Pan and L. M. Bao, Chin. Phys. B, 2014, 23, 10610 Search PubMed.
- H. Liu, G. P. Li, Q. L. Lin, D. J. E, X. D. Gao, X. B. Wei, X. D. Pan, S. X. Zhang, J. J. Ding and W. Lan, J. Supercond. Novel Magn., 2019, 32, 3557–3562 CrossRef CAS.
- S. P. S. Porto, P. A. Fleury and T. C. Damen, Phys. Rev., 1967, 154, 522–526 CrossRef CAS.
- S. Batakrushna, P. K. Giri, I. Kenji and F. Minoru, Nanoscale, 2013, 5, 5476–5488 RSC.
- M. Higuchi, T. Hosokawa and S. Kimura, J. Cryst. Growth, 1991, 112, 354–358 CrossRef CAS.
- J. Rodrigues, M. Peres, A. J. S. Fernandes, M. P. F. Graca, N. A. Sobolev, F. M. Costa and T. Monteiro, Appl. Surf. Sci., 2012, 258, 9143–9147 CrossRef CAS.
- D. Kim, J. Hong, Y. R. Park and K. J. Kim, J. Phys.: Condens. Matter, 2009, 21, 195405 CrossRef PubMed.
- N. N. Xu, G. P. Li, Q. L. Lin, H. Liu and L. M. Bao, J. Supercond. Novel Magn., 2017, 30, 1–6 CrossRef.
- N. N. Xu, G. P. Li, Q. L. Lin, H. Liu and L. M. Bao, Chin. Phys. B, 2016, 25, 106101 CrossRef.
- X. Wang, Y. Song, L. L. Tao, J. F. Feng, Y. Sui, J. Tang, B. Song, Y. Wang, Y. Wang and Y. Zhang, Appl. Phys. Lett., 2014, 105, 262402 CrossRef.
- B. Anitha and M. A. Khadar, J. Nanopart. Res., 2016, 18, 1–14 CrossRef CAS.
- J. Li, F. Li, Y. Zhuang, L. Jin, L. Wang, X. Wei, Z. Xu and S. Zhang, J. Appl. Phys., 2014, 116, 074105 CrossRef.
- F. Wang, H. Li, Q. Wu, J. Fang, Y. Huang, C. Yin, Y. Xu and Z. Luo, Electrochim. Acta, 2016, 202, 1–7 CrossRef CAS.
- Z. Zhao, X. Zhang, G. Zhang, Z. Liu, D. Qu, X. Miao, P. Feng and Z. C. Sun, Nano Res., 2015, 8, 1–11 CrossRef.
- E. C. Buck, Radiat. Eff. Defects Solids, 1995, 133, 141–152 CrossRef CAS.
- M. A. Henderson, W. S. Epling, C. H. F. Peden and C. L. Perkins, J. Phys. Chem. B, 2003, 107, 534–545 CrossRef CAS.
- X. Q. Cheng, C. Y. Ma, X. Y. Yi, F. Yuan, Y. Xie, J. M. Hu, B. C. Hu and Q. Y. Zhang, Thin Solid Films, 2016, 615, 13–18 CrossRef CAS.
- M. Memesa, S. Lenz, S. G. J. Emmerling, S. Nett, J. Perlich, P. Muller-Buschbaum and J. S. Gutmann, Colloid Polym. Sci., 2011, 289, 943–953 CrossRef CAS PubMed.
- D. Li, H. Haneda, N. K. Labhsetwar, S. Hishita and N. Ohashi, Chem. Phys. Lett., 2005, 401, 579–584 CrossRef CAS.
- L. Kernazhitsky, V. Shymanovska, V. Naumov, L. Fedorenko, V. Kshnyakin, N. Shcherban, S. Filonenko and J. Baran, J. Lumin., 2017, 187, 521–527 CrossRef CAS.
- B. J. Morgan and G. W. Watson, J. Phys. Chem. C, 2010, 114, 2321 CrossRef CAS.
- M. Wang, M. Feng and X. Zuo, Appl. Surf. Sci., 2014, 292, 475–479 CrossRef CAS.
- Y. Zhang, N. Ma, M. Zhou, E. Cao, S. Li, W. Hao and Z. Yang, J. Phys. Chem. Solids, 2018, 121, 276–284 CrossRef CAS.
- S. Naphattalung, M. F. Smith, K. Kim, M. H. Du, S. H. Wei, S. B. Zhang and S. Limpijumnong, Phys. Rev. B: Condens. Matter Mater. Phys., 2006, 73, 125205 CrossRef.
- A. Janotti, J. B. Varley, P. Rinke, N. Umezawa, G. Kresse and C. G. Van de Walle, Phys. Rev. B: Condens. Matter Mater. Phys., 2010, 81, 085212 CrossRef.
- G. Mattioli, P. Alippi, F. Filippone, R. Caminiti and A. Amore Bonapasta, J. Phys. Chem. C, 2010, 114, 21694–21704 CrossRef CAS.
- N. N. Bao, J. B. Yi, H. M. Fan, X. B. Qin, P. Zhang, B. Y. Wang, J. Ding and S. Li, Scr. Mater., 2012, 66, 821–824 CrossRef CAS.
- X. B. Qin, D. X. Li, R. Q. Li, P. Zhang, Y. X. Li and B. Y. Wang, Chin. Phys. B, 2014, 23, 067502 CrossRef.
- Q. Jin, Y. Shen, S. Zhu, X. Li and M. Hu, Chin. J. Catal., 2016, 37, 1521–1528 CrossRef CAS.
- J. Li, S. Meng, L. Qin and H. Lu, Chin. Phys. B, 2017, 26, 370–375 Search PubMed.
| This journal is © The Royal Society of Chemistry 2020 |

