 Open Access Article
Discovering active sites in peptide Ala–Val–Thr–Phe that counter 2,2-azobis(2-methylpropanimidamidine)dihydrochloride-induced oxidative stress in HepG2 cells†
Jiaxi Liang‡
 a,
Qin Wang‡
 a,
Jianliang Liub,
Guozhong Huanga,
Churong Lianga,
Huifan Liu*a and
Lukai Ma
 *a
*a
aCollege of Light Industry and Food, Zhongkai University of Agriculture and Engineering, Guangzhou, Guangdong 510225, China. E-mail: lm_zkng@163.com; m1991lk@163.com; Tel: +86 13600008265 Tel: +86 15257075377
bModern Agriculture Research Center, Zhongkai University of Agriculture and Engineering, Guangzhou, Guangdong 510225, China
First published on 26th June 2020
Abstract
The Ala–Val–Thr–Phe (AVTF) peptide derived from edible Dendrobium aphyllum was co-incubated with Lactobacillus amylolyticus in a previous study. The aim of the present study was to further examine the antioxidative and protective effects of the AVTF peptides through the analysis of free-radical quenching in HepG2 cells subjected to 2,2-azobis(2-methylpropanimidamidine)dihydrochloride (AAPH)-induced oxidative stress and to determine the active sites within the peptide. Variations in intracellular malondialdehyde levels indicated that these peptides protect HepG2 cells by preventing ROS attack and lipid peroxidation. Antioxidant enzymes and Nrf2 were downregulated in AVTF-treated but not in AAPH-treated HepG2 cells, whereas the electrically sensitive Keap1 was not susceptible to free radical-induced damage after AVTF treatment. However, this did not result in the activation of the Nrf2/Keap1 signaling pathway, thus indicating that one potential mechanism by which AVTF maintains homeostasis in HepG2 cells is by directly scavenging free radicals. Furthermore, quantum chemical calculations and the assessment of electronic-related properties associated with antioxidant activity revealed that the active sites of AVTF included N9–H11, which was further confirmed by the assessment of ROS levels in methylated AVTF-treated cells. The results of this study provide valuable insights into the active site N9–H11 in the Ala residue of AVTF, which influences the antioxidant activity of the peptide.
1. Introduction
Numerous studies are currently focused on the development of functional foods to scavenge free radicals; accordingly, antioxidant peptides have been receiving increasing attention as potential ingredients in such foods.1 Antioxidant peptides scavenge free radicals and prevent lipid peroxidation.2 Thus, studies have attempted to extract antioxidant peptides from natural products. The antioxidant peptide Met–Asn–Asn from corn germ meal is potentially effective in preventing intracellular oxidative stress.3 Ser–Asp–Ile–Thr–Arg–Pro–Gly–Gly–Asn–Met from Palmaria palmata reportedly has the highest oxygen radical absorbance capacity (ORAC) and ferric-reducing antioxidant power (FRAP).4 We previously extracted the peptide Ala–Val–Thr–Phe (AVTF) from edible Dendrobium aphyllum after L6 solid state-optimized fermentation with Lactobacillus amylolyticus,5 and analyzed its antioxidant capacity in vitro. Although we previously elucidated the biochemical mechanism underlying antioxidation, the associated antioxidant mechanisms and structure–activity associations remain unclear.ROS can penetrate cell membranes and induce oxidative stress and cellular damage, potentially leading to cell death.6 The intrinsic antioxidant defense system to eliminate ROS in vivo can be divided into enzymic and non-enzymic components.7 Furthermore, the hypothesis that phenolic compounds can activate the Kelch-like ECH-associated protein 1 (Keap1)-nuclear factor erythroid 2-related factor 2 (Nrf2) pathway, thus upregulating intracellular antioxidant enzymes to counter reactive oxygen species (ROS), has been verified.8 These enzymes include superoxide dismutase (SOD), glutathione peroxidase (GSH-Px), catalase (CAT), and other antioxidant enzymes, whereas the non-enzymic component is primarily comprised of endogenous antioxidants, including glutathione (GSH), and exogenous antioxidants, including vitamins E and C.9 The mechanisms underlying their scavenging are primarily based on hydrogen atom transfer (HAT), which provides hydrogen atoms and blocks free-radical chain reactions.10
Structures at atomic resolution and information regarding system energetics can be accurately obtained through quantum chemical calculations and computational methods. Theoretical calculations serve as a cogent tool for investigating the structure–activity relationships of drugs.11 Owing to its accuracy, the density functional theory (DFT) based on quantum chemical calculations has been widely used. For quantum chemical calculations, the parameters generally include electronic structure parameters, the highest occupied molecular orbital (HOMO) energy and the lowest unoccupied molecular orbital (LUMO) energy, geometric parameters (bond length and dihedral angle), and the molecular shape parameter.12,13 For example, Cheng et al. predicted the active sites in the peptides AQIPQQ, RVF, and NRYHE by analyzing the HOMO energy and longer bond length.14
In the present study, we sought to determine the mechanisms underlying the antioxidative protective activity of AVTF. Fluorescence labeling was performed to observe the dynamic changes during the interaction between the peptides and HepG2 cells to determine whether the peptide directly penetrated the membrane. The respective cytoprotective capacities were evaluated based on markers of oxidative damage, including malondialdehyde (MDA), ROS, antioxidant enzymes, and the Nrf2/Keap1 signaling pathway. Structure–activity associations of the peptides were analyzed through quantum chemical calculations and the active sites were predicted. Through methylation of the peptide, the active sites of AVTF were predicted, which were further verified by the analysis of ROS quenching. We believe that the findings of the present study may provide valuable insights into the association between peptide structures and their free-radical scavenging activity to theoretically guide the development of certain new antioxidants with a similar structure.
2. Materials and methods
2.1 Materials
The peptides (AVTF, FITC-acp-AVTF, and methylated-AVTF) were synthesized by Shanghai Science Peptide Biological Technology Co., Ltd (Shanghai, China). Human hepatoma cells (HepG2) were obtained from the Shanghai Cell Bank/Stem Cell Bank, Chinese Academy of Sciences (Shanghai, China). 2,2-Azobis(2-methylpropionamidine)dihydrochloride (AAPH) and 6-hydroxy-2,5,7,8-tetramethylchroman-2-carboxylic acid (Trolox) were purchased from Sigma (St. Louis, MO, USA). MDA, SOD, CAT, GSH-Px, and bicinchoninic acid protein assay kits were purchased from the Nanjing Jiancheng Institute of Biotechnology (Nanjing, China). ROS and GSH/GSSG assay kits were purchased from the Beyotime Institute of Biotechnology (Shanghai, China). A cell counting kit (CCK-8) and Trizol reagent were obtained from Wuhan Hualian Biotechnology Co. Ltd. (Wuhan, China). anti-GSH-Px antibody (Ab22604) was purchased from Abcam (Cambridge, UK). anti-SOD (PAB31525), anti-CAT (PAB30815), anti-Nrf2 (PAB30175), anti-Keap1 (PAB33016), anti-p-Nrf2 (ab76026), and anti-glyceraldehyde-3-phosphate dehydrogenase (GAPDH)(PAB36269) antibodies were obtained from Wuhan Hualian Biotechnology. All other reagents were of analytical grade.2.2 Cell culture
HepG2 cells were cultured in Dulbecco's modified Eagle's medium (DMEM) (Corning, NY, USA), containing 2.5% Corning fetal bovine serum (FBS) and 50 mg mL−1 of the antibiotics gentamicin, penicillin, and streptomycin (Sigma), in a humidified atmosphere of 5% CO2 and 95% air at 37 °C. The culture medium was replenished at 2 d intervals, and the cells were sub-cultured at 80% to 90% confluency, using a solution of 0.25% trypsin and 0.02% EDTA.2.3 Evaluation of the viability of HepG2 cells
HepG2 cells were cultured in Costar 96-well plates at a density of 5 × 10³ cells per mL and treated with 10 μL fresh DMEM containing different concentrations (0.023, 0.046, 0.094, 0.188, 0.375, 0.500, 0.750, and 1.500 mg mL−1) of the peptides (AVTF and methylated AVTF), together with a control group, for 24, 48, and 72 h in a humidified atmosphere of 5% CO2 and 95% air at 37 °C. Cell viability assays were performed using the non-radioactive CCK-8 (cell counting kit-8) assay.2.4 Dynamic observation of AVTF in HepG2 cells
HepG2 cells (1 × 10⁵ cells per mL) were treated with fluorescently labeled peptides (FITC-acp-AVTF). Photographs were obtained using an inverted fluorescence microscope (DMIL LED, Leica, Wetzlar, Germany) for 0 min, 5 min, 10 min, and 20 min.2.5 Determination of ROS levels
AAPH-induced ROS levels in HepG2 cells were determined using a dichlorofluorescin-diacetate (DCFH-DA) assay. HepG2 cells (5 × 10³ cells per mL) were incubated in 96-well plates and treated with different concentrations of AVTF and methylated AVTF, with Trolox as the positive control, followed by incubation with 1 mL DCFH-DA for 20 min at 37 °C. The cells were washed thrice with PBS and treated with 200 mM AAPH or DMEM as the control group for 20 min. An ROS assay kit including DCFH-DA as a fluorescent probe was used in accordance with the manufacturer's instructions to determine the intracellular ROS levels. Photographs of the reaction plates were obtained using an inverted fluorescence microscope (DMIL LED, Leica) to analyze the results. Fluorescence intensity was recorded at 485 nm (excitation) and 525 nm (emission). An ROS assay kit with DCFH-DA as a fluorescent probe was used to determine the relative ROS levels in cells treated with methylated AVTF.2.6 Determination of MDA content and SOD, CAT, GSH-Px, GSH, and GSSG activity
HepG2 cells (5 × 10³ cells per mL) were incubated in Costar 24-well plates and treated with various concentrations of the AVTF (0, 0.375, 0.75, and 1.5 mg mL−1) for 2 h. Trolox was employed as the positive control. Then, the cells were washed twice with PBS and treated with 200 μM AAPH for 3 h.15 After three more washes with PBS, the cells were lysed with RIPA lysis buffer at 4 °C for 10 min and subsequently centrifuged to obtain the supernatants. The MDA content and the SOD, CAT, GSH-Px, GSH, and GSSG activity levels in the supernatants were determined using commercially available enzyme assay kits in accordance with the manufacturer's instructions. Cytosolic protein concentrations were determined using a commercial BCA kit with bovine serum albumin (BSA) as the standard.2.7 Reverse transcription PCR (RT-PCR) analysis
Total RNA was extracted using the Trizol method. After eliminating DNA and DNase1 from the total RNA, we reverse-transcribed RNA using a Reverse Transcriptase kit (TaKaRa, Shiga, Japan) in accordance with the manufacturer's instructions to generate cDNAs. cDNAs were amplified under the following cycling conditions: 1 cycle at 95 °C for 10 min, 40 cycles at 95 °C for 10 s and 60 °C for 1 min. GAPDH was used as the internal control. The following primers were used in this assay: GAPDH (185 bp; forward, GGTGGTCTCCTCTGACTTCAACA; reverse, GTTGCTGTAGCCAAATTCGTTGC); SOD (115 bp; forward, TGGAGATAATACAGCAGGCT; reverse, AGTCACATTGCCCAAGTCTC); CAT (97 bp; forward, CCTTCGACCCAAGCAA; reverse, CGATGGCGGTGAGTGT); GSH-Px (172 bp; forward, AGAAGTGCGAGGTGAACGGT; reverse, CCCACCAGGACTTCTCAAA); Nrf2 (172 bp; forward, AGTGTGGAGAGGTATGAGCC; reverse, CGTTCCTCTCTGGGTAGTAA); Keap1 (126 bp; forward, AGAGCGGGATGAGTGGCA; reverse, GCTGAATTAAGGCGGTTTGTC). Relative gene expression levels were normalized using the 2−ΔΔCT method.2.8 Western blotting
HepG2 cells (5 × 10³ cells per mL) were lysed using ice-cold RIPA lysis buffer and incubated on ice. Cell lysates were obtained through centrifugation at 12![[thin space (1/6-em)]](https://www.rsc.org/images/entities/char_2009.gif) 000×g for 10 min. The supernatants were subsequently boiled for 10 min and proteins were separated through SDS-PAGE (10% resolving gel) and electro-transferred onto a polyvinylidene difluoride membrane. The membranes were then blocked by incubation in 5% skim milk for 2 h at ambient temperature. Then, the membranes were probed with the indicated primary antibodies overnight at 4 °C. Subsequently, the membranes were washed thrice with PBST and incubated with horseradish peroxidase-conjugated secondary antibodies at 1
000×g for 10 min. The supernatants were subsequently boiled for 10 min and proteins were separated through SDS-PAGE (10% resolving gel) and electro-transferred onto a polyvinylidene difluoride membrane. The membranes were then blocked by incubation in 5% skim milk for 2 h at ambient temperature. Then, the membranes were probed with the indicated primary antibodies overnight at 4 °C. Subsequently, the membranes were washed thrice with PBST and incubated with horseradish peroxidase-conjugated secondary antibodies at 1![[thin space (1/6-em)]](https://www.rsc.org/images/entities/char_2009.gif) :
:![[thin space (1/6-em)]](https://www.rsc.org/images/entities/char_2009.gif) 10
10![[thin space (1/6-em)]](https://www.rsc.org/images/entities/char_2009.gif) 000 dilutions for 1 h at ambient temperature. GAPDH was considered the loading control. After the membranes were washed thrice for 5 min each, the proteins were detected using an ECL reagent. The treated membranes were placed in a fully automatic chemiluminescence analyzer (Tanon-5200; Tanon Science & Technology Co. Ltd, Shanghai, China) for detection, and TANON GIS software (Tanon Science & Technology) was used to read the grayscale values of the relevant protein bands.
000 dilutions for 1 h at ambient temperature. GAPDH was considered the loading control. After the membranes were washed thrice for 5 min each, the proteins were detected using an ECL reagent. The treated membranes were placed in a fully automatic chemiluminescence analyzer (Tanon-5200; Tanon Science & Technology Co. Ltd, Shanghai, China) for detection, and TANON GIS software (Tanon Science & Technology) was used to read the grayscale values of the relevant protein bands.
2.9 Analysis of the structure–activity relationship of the peptides
All calculations herein were performed in accordance with the density functional theory (DFT) implemented in Chemdraw Professional 16.0, GaussView 5.0, and Gaussian 09. Chemdraw software was used to model the geometries of the peptides. Preliminary geometry optimizations were performed using molecular mechanics MM+, a semi-empirical AM1 method for further configuration optimization. Optimization results were obtained from a Gaussian 09 input file. A small basis set was used to optimize the peptide conformation in the Gaussian 09 program. The geometries were extrapolated using B3LYP/6-31, and optimized geometries were obtained for the peptides. Parameters including HOMO distribution, bond length, and Mulliken charge distribution were determined to facilitate analysis of the active sites.2.10 Statistical analysis
Data are expressed as mean ± standard deviation (SD) values of triplicate experiments. Significant differences between means were determined using Tukey's test with SPSS 17.0 software (IBM, Armonk, NY, USA). A p-value <0.05 was considered to indicate statistical significance. We used Gaussian 09 and GaussView 5.0 (Gaussian Inc., Wallingford, CT, USA) to analyze the electronic-related properties of AVTF.3. Results and discussion
3.1 Cell viability
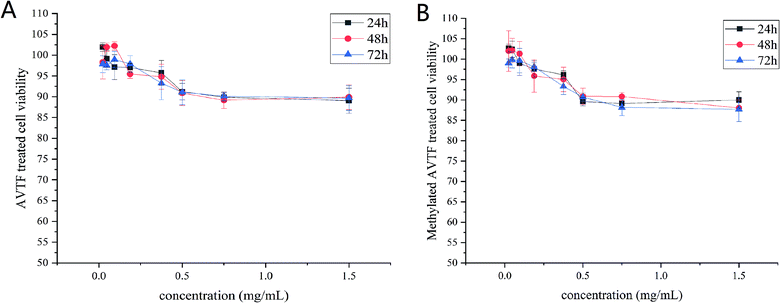
Before investigating the antioxidant effects of AVTF (purity, >98%), we assessed its potential toxic effects on HepG2 cells via the CCK-8 assay. It was determined that AVTF did not exert obvious cytotoxic effects at the different concentrations examined, and the cell viability at each concentration was greater than 90%. Upon AVTF treatment (Fig. 1A) for 24, 48, and 72 h, cell viability decreased with an increase in the peptide concentration. Therefore, AVTF concentrations of 0.375, 0.75, and 1.5 mg mL−1 were considered appropriate for further analyses. Upon treatment with methylated AVTF (Fig. 1B) for 24, 48, and 72 h, the cell viability at each concentration was greater than 90%. These methylated AVTF concentrations were also appropriate for further analyses.3.2 Dynamic observation of AVTF in HepG2 cells
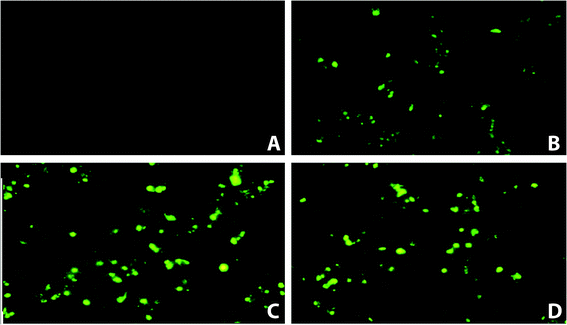
Fluorescence microscopy (Fig. 2) was performed to assess the localization of FITC-acp-AVTF in HepG2 cells. Furthermore, we investigated whether AVTF penetrates HepG2 cells during a 20 min incubation before washing the cells with PBS and AAPH. As shown in Fig. 2, the fluorescence intensity of HepG2 cells was measured at 0, 5, 10, and 20 min. These results indicated that FITC-acp-AVTF penetrated the cells. However, the molecular weight of AVTF was 436.5 Da (https://pepcalc.com/). This phenomenon may be associated with the low molecular weight of AVTF, as substances below 1 kDa can easily penetrate the cell membrane.163.3 Cytoprotective effects of the peptides
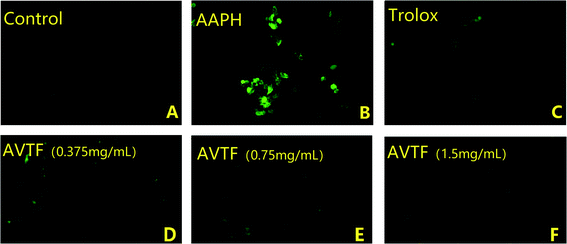
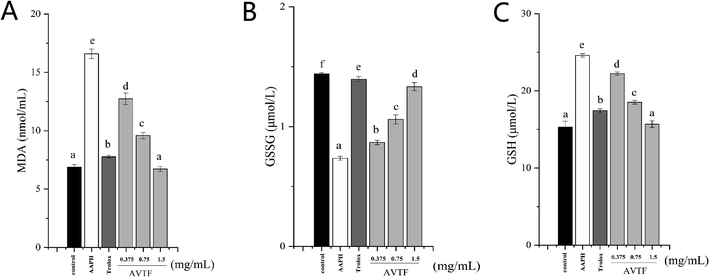
Under physiological conditions, ROS production and clearance are dynamically regulated, such that they do not exert any adverse effects on cells. Under these conditions, the DCFH-DA assay determined a low fluorescence intensity, indicating low intracellular ROS levels. Intracellular ROS levels were significantly higher in the AAPH group than in the control group (Fig. 3A and B), indicating enhanced oxidative stress. However, intracellular ROS levels were reduced in cells pretreated with AVTF at different concentrations compared to the AAPH group. The fluorescence intensity was significantly lower in the control group than in either model group (Fig. 3C). Among the different AVTF concentrations assessed, the lowest fluorescence intensities were observed with 1.5 mg mL−1 AVTF (Fig. 3F). With an EC50 value of 0.02 ± 0.01 mg mL−1 AVTF, it exerts cytoprotective effects in HepG2 cells. Similar findings were reported where AVTF significantly attenuated the increase in MDA content.17MDA, which is a product of the reaction between ROS and polyunsaturated fatty acids, is commonly considered a marker of cell membrane damage. We found that an increase in the AVTF concentration resulted in a concomitant decrease in the intracellular MDA levels. AVTF treatment decreased MDA levels by 0.87-fold, similar to those observed in the Trolox control, indicating that AVTF exerts protective effects (Fig. 4A).
3.4 Effect on GSH and GSSG
GSH is the non-enzymatic antioxidant defense in the cell. GSSG was converted to GSH by GSH-Px, indicating that the GSH level was positively correlated with the GSH-Px level, whereas GSSG was negatively correlated with the GSH-Px level.18 The levels of GSH and GSSG in the AVTF group was close to that of the control group (Fig. 3B and C). Increasing GSH levels is the cell's defense against oxidative damage.19 The results showed that the antioxidant effects of AVTF were not through increasing the GSH levels.3.5 Effect of antioxidant enzymes, Nrf2, phosphorylated Nrf2 (p-Nrf2), and Keap1
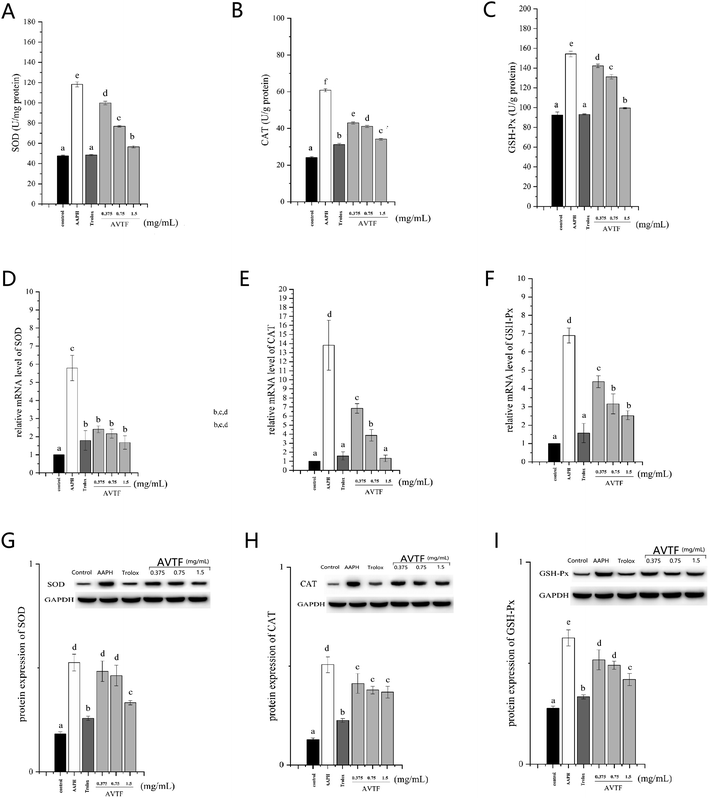
Under physiological conditions, Nrf2, the most critical transcription factor in the antioxidant defense system, is constantly degraded in a Keap1-dependent manner via the ubiquitin–proteasome pathway.20 However, oxidative stress can cause the dissociation of the Nrf2/Keap1 complex, after which Nrf2 migrates to the nucleus and activates cytoprotective genes. This accelerates the expression of phase II detoxifying/antioxidant enzymes including SOD, CAT, and GSH-Px (as free-radical quenchers), which protect cells against oxidative stress.21 Furthermore, p-Nrf2 intensifies this dissociation.22Treatment of cells in the model group with AAPH led to increased antioxidant enzyme activity. These findings were supported by similar results obtained by Pan et al. showing that cells were in a state of oxidative stress and they displayed enhanced SOD activity (Fig. 5).23 However, the cellular antioxidant system depends on quenching of O2− by SOD and further protection by CAT and GSH-Px to convert H2O2 to H2O, indicating that CAT and GSH-Px levels are related to SOD level.24 In the AVTF-treated groups, SOD, CAT, and GSH-Px activities decreased with an increase in AVTF concentration. It can be concluded that AVTF maintained enzyme activities close to normal levels. Notably, only minor differences were observed between the groups treated with Trolox and AVTF at high concentrations in the activities and expression levels of SOD, CAT, and GSH-Px, indicating that at 1.5 mg mL−1, the peptides exhibited antioxidant activity similar to Trolox.
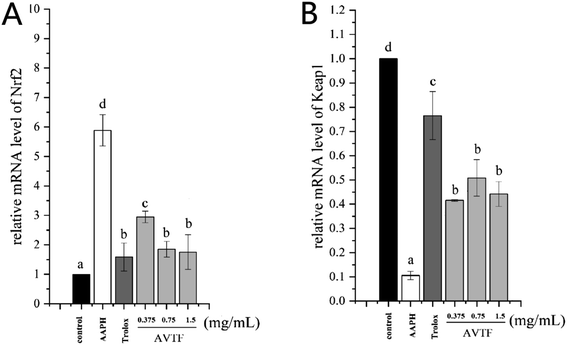
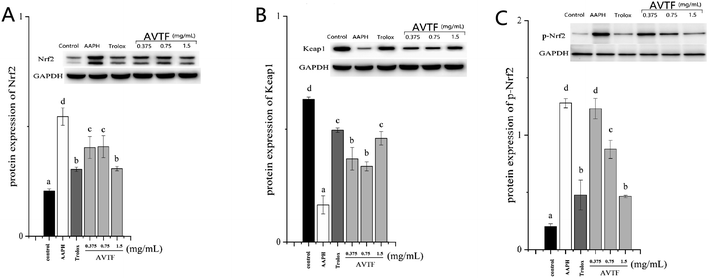
The peptide treatment influenced the mRNA and protein expression levels of Nrf2 and Keap1 (Fig. 6). RT-PCR and western blot analyses revealed similarities in the trends of mRNA and protein expression. In the AAPH group without peptide treatment, Nrf2 expression levels were the highest and Keap1 expression levels were the lowest; these findings are similar to the results obtained by Wang et al.25 These results indicated that Keap1 was slight affected in AAPH-induced HepG2 cells after AVTF and Trolox treatment. The electrically sensitive cysteine structure of Keap1 is highly susceptible to free radical-induced damage.26 These results inferred that AVTF quenches intracellular free radicals under AAPH attack.
p-Nrf2 intensified the dissociation of the Nrf2/Keap1 complex. Furthermore, p-Nrf2 displayed the same trend as Nrf2. However, p-Nrf2 and Nrf2 expression in AVTF-treated cells was lower than that in AAPH-treated cells. In cells treated with AVTF at high concentrations, Keap1, p-Nrf2, and Nrf2 expression levels were comparable to those of the Trolox group (Fig. 7). The present study shows that the AVTF did not activate the Nrf2/Keap1 pathway.
3.6 Electronic-related properties and active site prediction
According to the molecular orbital theory, the HOMO energy (EHOMO) is the highest occupied orbital energy.27 However, the higher the EHOMO, the higher the potential of a molecule to donate electrons to an electron-poor species.28 EHOMO can help characterize the potential for electron donation. An electron removed from the frontier molecular orbital of the parent molecule yields a cationic radical. Thus, EHOMO can also be considered to characterize the antioxidant potential.14 The EHOMO of AVTF was −5.70928 eV (Table 1), which concurs with a previous study.27| EHOMO (eV) | −5.70928 | |
| Mulliken charge (e) | 9N | −0.697485 |
| 10H | 0.288833 | |
| 11H | 0.282866 | |
| Bond length (Å) | N9–H10 | 1.011 |
| N9–H11 | 1.011 | |
| Active site | N9–H11 | |
Qualitative data to identify the active site of molecules involved in free-radical scavenging can be derived from HOMO composition owing to H abstraction reactions involving electron transfer.11 Electronegative atoms, including C, N, and O, attract electrons. When the hydrogen atom from a molecular fragment X–H (where X is C, N, or O) is released, it forms a proton, and a new hydrogen bond is readily formed by X− with another electronegative atom. Therefore, X–H represents the hydrogen bond donor, whereas the acceptor may be an atom or an anion (Y), which is an electron-rich species.29 Hydrogen bond donors form resonance-stable radicals and intramolecular H-bonding, thereby facilitating a higher level of antioxidant activity, and hydrogen bonds can be considered a predictive antioxidant parameter.30
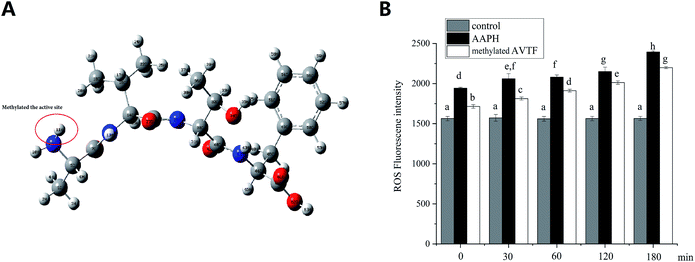
Fig. 8 shows the HOMO distribution of AVTF (Fig. 8B). Amino acid side chains, sequences, and chemical and physical characteristics play important roles in determining antioxidant activity.31 Peptides containing amino acids A, V, and F reportedly have strong free-radical scavenging capacity.32,33 The highest HOMO contribution rate in AVTF was on N9 in the Ala residue (Table 2). Ala reportedly has a high antioxidant potential.34 A previous study reported that the longer the hydrogen bond, the weaker it is,35 indicating that the attractive force between hydrogen atoms and anions is weak and H+ is more likely to be released.36 However, the N9–H11 and N9–H10 bond lengths were the same (Table 1). The attractive force between two atoms is based on Coulomb interactions,37 which is associated with a higher Coulomb's formula, a longer bond length, and weaker charge distribution.38 Furthermore, the Mulliken charge was higher for 10H than for 11H. Therefore, the most probable active site is N9–H11, where the attractive force was less than the N9–H10 bond. Therefore, 11H can be easily released and can scavenge free radicals. In brief, the HOMOs in AVTF were on N9–H11 in the Ala residue, indicating that the N9–H11 bond in the Ala residue in AVTF exerts antioxidant effects, and the Mulliken charge can affect the active site.
| Atom number | Atom | Rate | Atom number | Atom | Rate |
|---|---|---|---|---|---|
| 1 | C | 0.948731% | 32 | C | 0.000688% |
| 2 | H | 0.107419% | 33 | H | 0.000204% |
| 3 | H | 0.114163% | 34 | O | 0.000158% |
| 4 | H | 0.432111% | 35 | H | 0.000073% |
| 5 | C | 8.330117% | 36 | C | 0.001965% |
| 6 | H | 5.429117% | 37 | H | 0.000415% |
| 7 | C | 4.687527% | 38 | H | 0.001698% |
| 8 | O | 18.856930% | 39 | H | 0.000340% |
| 9 | N | 50.388840% | 40 | C | 0.001335% |
| 10 | H | 3.799288% | 41 | O | 0.003770% |
| 11 | H | 3.564056% | 42 | N | 0.000722% |
| 12 | N | 1.476460% | 43 | H | 0.000037% |
| 13 | H | 0.143014% | 44 | C | 0.000192% |
| 14 | C | 0.430196% | 45 | H | 0.000032% |
| 15 | H | 0.241152% | 46 | C | 0.000047% |
| 16 | C | 0.075618% | 47 | H | 0.000014% |
| 17 | H | 0.034514% | 48 | H | 0.000033% |
| 18 | C | 0.206614% | 49 | C | 0.000005% |
| 19 | H | 0.090981% | 50 | C | 0.000004% |
| 20 | H | 0.308204% | 51 | C | 0.000005% |
| 21 | H | 0.015596% | 52 | C | 0.000001% |
| 22 | C | 0.058145% | 53 | H | 0.000001% |
| 23 | H | 0.005409% | 54 | C | 0.000003% |
| 24 | H | 0.006190% | 55 | H | 0.000006% |
| 25 | H | 0.004888% | 56 | C | 0.000002% |
| 26 | C | 0.050241% | 57 | H | 0.000000% |
| 27 | O | 0.162189% | 58 | H | 0.000001% |
| 28 | N | 0.009627% | 59 | H | 0.000000% |
| 29 | H | 0.003188% | 60 | C | 0.000040% |
| 30 | C | 0.006341% | 61 | O | 0.000009% |
| 31 | H | 0.001317% | 62 | O | 0.000015% |
| 63 | H | 0.000005% |
3.7 Verification of active sites
To verify the active sites of cytoprotective AVTF in HepG2 cells, the ROS levels were determined. As shown in Fig. 9, ROS levels were significantly higher in the AAPH group than in the control group (P < 0.05), indicating enhanced oxidative stress. Treatment of HepG2 cells with methylated AVTF led to increased fluorescence intensity of the ROS, indicating an increase in the levels of free radicals compared with the corresponding levels in the AAPH group from 0 to 180 min. In general, treatment with methylated AVTF reduced the cytoprotective effect induced by AAPH in HepG2 cells, and a positive correlation was observed between ROS generation and time. The ability of AVTF to quench free radicals decreased upon methylation which shielded the active site, indicating that these active sites were crucial for the antioxidant capacity of peptides.4. Conclusion
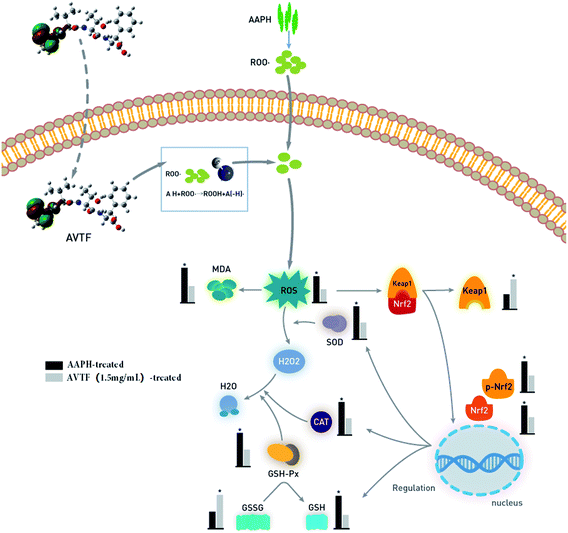
The present study shows that a peptide isolated from edible Dendrobium aphyllum protects HepG2 cells when oxidative stress was induced with AAPH. Fluorescence labeling of AVTF indicated it can penetrate the cell membrane. AVTF exhibited levels of antioxidant activity comparable to the routinely used antioxidant Trolox, as determined by measuring the cellular ROS and MDA levels. We inferred that the free radicals induced by AAPH were scavenged by AVTF, thereby preventing p-Nrf2 and Nrf2 from entering the nucleus and in turn leading to downregulation of SOD, CAT, and GSH-Px. Antioxidant mechanisms comprise enzyme-dependent and enzyme-independent components. Enzyme-independent antioxidants directly quench ROS to protect against attack by peroxide radicals.24,39 In cells treated with AVTF at high concentrations, Keap1 and Nrf2 expression levels were comparable to the Trolox group. The present study shows that one of the most plausible modes of action of AVTF is through direct action as a scavenger to quench free radicals, instead of activating the Nrf2/Keap1 pathway (Fig. 10).To experimentally verify the observed free-radical scavenging activity, we also examined the peptide's electrical properties that are potentially associated with antioxidant activity, using quantum chemical calculations based on the DFT. We determined the amino acid residue responsible for scavenging free radicals based on the quantum chemical parameters EHOMO, bond length, Mulliken charge distribution, and HOMO contribution rate. The corresponding HOMOs in AVTF were on the Ala residue, indicating that this residue exerts the antioxidant effects of AVTF. In addition, we analyzed the free-radical scavenging active sites of the peptides based on Coulomb interactions. We found that the active site of AVTF is on Ala N9–H11. In addition, the ROS content increased after methylation of the AVTF active sites. These results provide important insights into the structure–activity relationships among antioxidant peptides and constitute a foundation for further studies on antioxidant peptides. Further studies are required to elucidate the structure of peptides to contribute to the development of new types of functional foods, food additives, and drugs.
Funding
This study was funded by the Fundamental and Applied Basic Research Fund for Young Scholars of Guangdong Province (Grant no. 2019A1515011283), Guangzhou Science and Technology Commissioner Project (Project No. GZKTP201937).Conflicts of interest
There are no conflicts to declare.References
- B. D. Ding Ding, C. Zhang, F. Zamana and Y. Huang, RSC Adv., 2019, 9, 27032–27041 RSC.
- R. J. Elias, S. S. Kellerby and E. A. Decker, Crit. Rev. Food Sci. Nutr., 2008, 48, 430–441 CrossRef CAS PubMed.
- S. Zhang, M. Zhang, R. Yang, S. Zhang and S. Lin, J. Food Process. Preserv., 2019, 43, e14160 CAS.
- P. A. Harnedy, M. B. O'Keeffe and R. J. Fitzgerald, Food Res. Int., 2017, 100, 416 CrossRef CAS PubMed.
- H. Liu, J. Ma, Z. Yin and H. Wu, Int. J. Pept. Res. Ther., 2018, 1–10 Search PubMed.
- L. A. Rowe, N. Degtyareva and P. W. Doetsch, Free Radical Biol. Med., 2008, 45, 1167–1177 CrossRef CAS PubMed.
- H. Zhang, A. Peng, Y. Yu, S. Guo, M. Wang and H. Wang, J. Agric. Food Chem., 2019, 67, 1683–1690 CrossRef CAS PubMed.
- M. C. Lu, J.-A. Ji, Z.-Y. Jiang and Q.-D. You, Med. Res. Rev., 2016, 36, 924–963 CrossRef CAS PubMed.
- S. T. Uribe, L. J. López-Giraldo and E. A. Decker, J. Agric. Food Chem., 2018, 66, 4490–4502 CrossRef PubMed.
- M. C. Foti, E. R. Johnson, M. R. Vinqvist, J. S. Wright, B. Lrc and K. U. Ingold, J. Org. Chem., 2002, 67, 5190 CrossRef CAS PubMed.
- Y. Chen, H. Xiao, J. Zheng and G. Liang, PLoS One, 2015, 10, e0121276 CrossRef PubMed.
- J. R. Johns and J. A. Platts, Org. Biomol. Chem., 2014, 12, 7820 RSC.
- S. Ananda, M. Tapas Ranjan and J. Atish Dipnakar, J. Mol. Model., 2012, 18, 2621–2631 CrossRef PubMed.
- Y. Cheng, F. Luo, Z. Zeng, W. Li, Z. Xiao, H. Bu, F. Lv, X. Zhou and Q. Lin, Struct. Chem., 2015, 26, 739–747 CrossRef CAS.
- J. Wu, J. Huo, M. Huang, M. Zhao, X. Luo and B. G. Sun, J. Agric. Food Chem., 2017, 65, 10495–10594 CrossRef CAS PubMed.
- L. Gu, M. Zhao, W. Li, L. You, J. Wang, H. Wang and J. Ren, Food Chem. Toxicol., 2012, 50, 4085–4091 CrossRef CAS PubMed.
- J. Wu, J. Huo, M. Huang, M. Zhao, X. Luo and B. G. Sun, J. Agric. Food Chem., 2017, 65, 10495–10504 CrossRef CAS PubMed.
- K. Manda and A. L. Bhatia, Cell Biol. Toxicol., 2003, 19, 367–372 CrossRef CAS PubMed.
- J. Wu, B. Sun, X. Luo, M. Zhao, F. Zheng, J. Sun, H. Li, X. Sun and M. Huang, RSC Adv., 2018, 8, 10898–10906 RSC.
- I. M. Copple, C. E. Goldring, N. R. Kitteringham and B. K. Park, Toxicology, 2008, 246, 24–33 CrossRef CAS PubMed.
- W. Liao, Z. Ning, L. Chen, Q. Wei, E. Yuan, J. Yang and J. Ren, J. Agric. Food Chem., 2014, 62, 8648–8654 CrossRef CAS PubMed.
- D. Zhao, D. Shi, J. Sun, H. Li, M. Zhao and B. Sun, RSC Adv., 2018, 8, 35474–35484 RSC.
- A. Hossam, F. Mohamed, O. Samir, H. K. Da, K. Kyungsu and P. Cheol-Ho, Pharm. Biol., 2016, 54, 536–541 CrossRef PubMed.
- C. S. Yang, C. T. Ho, J. Zhang, X. Wan, K. Zhang and J. Lim, J. Agric. Food Chem., 2018, 66, 3063–3068 CrossRef CAS PubMed.
- X. Y. Wang, Z.-Y. Wang, Y.-S. Zhu, S.-M. Zhu, R.-F. Fan and L. Wang, J. Biochem. Mol. Toxicol., 2017, e22011 Search PubMed.
- T. Yamamoto, T. Suzuki, A. Kobayashi, J. Wakabayashi, J. Maher, H. Motohashi and M. Yamamoto, Mol. Cell. Biol., 2008, 28, 2758–2770 CrossRef CAS PubMed.
- C. Alaşalvar, M. S. Soylu, A. Güder, Ç. Albayrak, G. Apaydın and N. Dilek, Spectrochim. Acta, Part A, 2014, 130, 357–366 CrossRef PubMed.
- P. Thabo, L. O. Olasunkanmi, B. Indra, A. S. Adekunle, M. M. Kabanda and E. E. Ebenso, Molecules, 2015, 20, 16004 CrossRef PubMed.
- E. Arunan, G. Desiraju, R. Klein, J. Sadlej, S. Scheiner, I. Alkorta, D. Clary, R. Crabtree, J. J. Dannenberg, P. Hobza, H. G. Kjaergaard, A. Legon, B. Mennucci and D. Nesbitt, Pure Appl. Chem., 2011, 83, 1637–1641 CAS.
- A. Barzegar, M. D. Davari, N. Chaparzadeh, N. Zarghami, J. Z. Pedersen, S. Incerpi, L. Saso and A. A. Moosavi-Movahedi, J. Iran. Chem. Soc., 2011, 8, 973–982 CrossRef CAS.
- W. Liao, L. Gu, Y. Zheng, Z. Zhu, M. Zhao, M. Liang and J. Ren, MedChemComm, 2016, 7, 2193 RSC.
- T. B. Zou, T. P. He, H. B. Li, H. W. Tang and E. Q. Xia, Molecules, 2015, 21, 72 CrossRef PubMed.
- H. S. Dong, J. Y. Dong and S. S. Ji, Mar. Drugs, 2018, 16, 262 CrossRef PubMed.
- C. Sonklin, N. Laohakunjit and O. Kerdchoechuen, PeerJ, 2018, 6, 5337 CrossRef PubMed.
- V. D. Kancheva, P. V. Boranova, J. T. Nechev and I. I. Manolov, Biochimie, 2010, 92, 1138–1146 CrossRef CAS PubMed.
- R. Pingaew, A. Worachartcheewan, C. Nantasenamat, S. Prachayasittikul, S. Ruchirawat and V. Prachayasittikul, Arch. Pharmacal Res., 2013, 36, 1066–1077 CrossRef CAS PubMed.
- S. U. Son, J. A. Reingold, G. B. Carpenter, P. T. Czech and D. A. Sweigart, Organometallics, 2006, 25, 5276–5285 CrossRef CAS.
- A. Soffers, M. Boersma, W. Vaes, J. Vervoort, B. Tyrakowska, J. Hermens and I. Rietjens, Toxicol. In Vitro, 2001, 15, 539 CrossRef CAS PubMed.
- T. Niu, R. Xuan, L. Jiang, W. Wu, Z. Zhen, Y. Song, L. Hong, K. Zheng, J. Zhang and Q. Xu, J. Agric. Food Chem., 2018, 66, 1551–1559 CrossRef CAS PubMed.
Footnotes |
| † Electronic supplementary information (ESI) available. See DOI: 10.1039/d0ra02292f |
| ‡ These author contributed equally to this manuscript. |
| This journal is © The Royal Society of Chemistry 2020 |

