 Open Access Article
Polysaccharides derived from Enteromorpha prolifera for the removal of silver nanoparticle-humic acid contaminants by a coagulation-ultrafiltration process†
Shuang Zhao *a,
Peng Zhanga,
Zhangjian Zoua,
Jing Han
 *a,
Weihua Yanga and
Qianshu Sun
 b
b
aSchool of Chemistry and Materials Science, Jiangsu Normal University, Xuzhou, 221116, China. E-mail: zhaoshuang@jsnu.edu.cn; hj1986424@jsnu.edu.cn
bSchool of Environmental Science and Engineering, Ocean University of China, Qingdao, 266100, China
First published on 22nd April 2020
Abstract
Silver nanoparticles (AgNPs) pose serious health risks to humans as the adsorption between AgNPs and humic acid (HA) makes it difficult to remove them from surface water. To solve this problem, polysaccharides extracted from a marine alga, Enteromorpha prolifera (denoted as Ep), were used to eliminate the AgNP–HA composite contaminant via a coagulation-ultrafiltration (C-UF) process. The structure of Ep, AgNP–HA removal mechanism and membrane fouling were analyzed. The results indicated that the backbone of Ep was composed of (1 → 4)-linked L-rhamnopyranose, (1 → 4)-linked D-xylose and (1 → 4)-linked glucuronic acid. With the charge neutralization of PAC hydrolysates and the bridging-sweep role of Ep, AgNPs could be removed completely by the C-UF process. The coagulation performance and membrane flux were the highest when the PAC and Ep dosages were 2.0 mg L−1 and 0.3 mg L−1, respectively. In addition, when Ep was applied in the C-UF process, the flocs exhibited larger sizes, faster growth rates, better recovery ability and looser structures, which resulted in lower cake resistance and less pore blocking of the UF membrane. Consequently, the membrane flux could be improved by about 25–30% due to the addition of Ep.
1. Introduction
Silver nanoparticles (AgNPs) have been applied in a wide range of fields including medicine, clothing, catalysis, soldering and electronics.1–4 Zhang et al. prepared nano-Ag-coated Cu particles and applied them in electrically conductive adhesives.2 Wang et al. reported a mixture of silver nanowires and AgNP-coated copper for flexible electronics.5 Inevitably, AgNPs are released into surface water during their production, use and disposal processes, where they become toxic to aquatic organisms.6,7 In addition, the small diameter of AgNPs allows them to pass through human skin, potentially damaging nerve cells and causing irreversible effects on the human body.8,9 Even worse, AgNPs can adsorb humic acid (HA) in surface water to generate AgNP–HA composite contaminants. This interaction enhances the stability of the suspension system and makes it more complex to remove both AgNPs and HA from water.10,11 Therefore, there is a great need to explore effective removal techniques of AgNPs to avoid pollution events.The AgNP–HA contaminants are suspended in water in the form of colloidal particles, and coagulation is an effective means of colloid removal.12 A number of studies examining AgNP elimination by coagulation processes have been reported recently.13–15 However, the morphologies of aggregated AgNPs are directly influenced by the coagulant dosage, solution pH, HA concentration, and ionic strength, which result in unreliable removal efficiency in the coagulation process. Sun et al. reported that increasing the HA concentration would reduce the elimination efficiency of AgNPs. They found that the AgNP removal rates by polyferric sulfate were only 76%, 37% and 19% with the HA concentrations of 0, 5 and 20 mg L−1, respectively.15 Chalew et al. also reported that the conventional coagulation treatment could not remove AgNPs completely from water bodies, which resulted in 20% AgNPs remaining in the effluent water.13
By comparison, membrane filtration processes can be used to effectively remove nanoparticles. Studies have shown that the removal of nanoparticles by ultrafiltration (UF) membranes can reach 95% or higher.16 However, due to the aggregation of nanoparticles, irreversible membrane fouling occurs, which impedes the extensive applications of UF. To solve this problem, applying coagulation prior to the UF unit to form a coagulation-ultrafiltration hybrid system (C-UF) has been proposed in this paper. This hybrid system would improve the AgNP removal efficiency and reduce membrane fouling. Previous studies have indicated that membrane fouling is associated with the properties of flocs:17,18 large and porous flocs generally cause low-level membrane fouling, while the flocs generated by charge neutralization mechanisms always form more compact structures, resulting in severe fouling. Therefore, if the coagulation unit is applied in a specific way to generate large and porous flocs, it is theoretically possible that AgNPs can be completely removed by the C-UF process with low-level membrane fouling.
Applying a coagulant aid in combination with a traditional coagulant is an effective and low-cost way to obtain large and porous flocs. Liu et al. found that nanoparticles are more likely to form larger flocs under the action of polysaccharides, and applying algal polysaccharides could increase the adhesion rate of nano-boron.19 Therefore, algal polysaccharides possess great potential as coagulant aids for nanoparticle removal. Algae are abundant in China, and some species even reproduce and grow excessively to form the ‘green tides' in oceans’. Enteromorpha prolifera (E. prolifera) is a species of algae that has caused serious ecological problems due to its large-scale blooms in recent decades. The disposal and recycling of E. prolifera have since become urgent problems. Yu et al. reported that the E. prolifera polysaccharide is the main chemical component of E. prolifera (herein denoted as Ep), accounting for more than 50% of dry weight.20 The numerous carboxylic acids in Ep, nanoparticles and coagulant hydrolysates will form a chelate network structure, which will exert an electric neutralization effect and enhance the net trapping action of the cross-network to form larger flocs. Applying Ep as a coagulant aid in the C-UF process can simultaneously remove AgNPs and reduce membrane fouling in theory. Additionally, this can provide a new solution for using and recycling E. prolifera.
The objectives of this paper are as follows: (1) to prepare the coagulant aid Ep and characterize its structure; (2) determine the removal efficiency of AgNP–HA and illustrate the interaction mechanism among the alum coagulant, Ep and AgNP–HA; (3) ascertain the properties of the flocs formed with and without Ep; and (4) clarify the effect of Ep on UF membrane fouling and investigate the fouling mechanism.
2. Materials and methods
2.1 Synthetic AgNP–HA water sample
The chemicals (including HA, NaHCO3, Na2CO3, Na2B4O7·10H2O, and AlCl3·6H2O) were all purchased from Sinopharm Chemical Reagent Co. Ltd., Beijing. All reagents used were of analytical grade and deionized water was used to prepare all solutions. AgNP powder was purchased from Nanjing XFNANO Materials Tech. Co. Ltd. Its purity and specific surface area were 99.9% and 3 m2 g−1, respectively.The HA stock solution (1 g L−1) was prepared by dissolving 1.0 g of HA in sufficient deionized water and adding 4.2 g of NaHCO3 to provide a certain buffer capacity and ionic strength. The solution was stirred continuously for 2 h and then diluted to 1 L. The AgNP dispersion was prepared by dissolving 50 mg of AgNPs in 1 L deionized water followed by ultrasonic treatment for 1 h to guarantee the complete dispersion of AgNPs. The synthetic AgNP–HA water contained 10 mg HA and 5 mg AgNPs per liter. In addition, 5 mM L−1 borate buffer was added to prevent silver ion release. The properties of this water are as follows: turbidity = 32.5 ± 0.7 NTU, pH = 8.40 ± 0.05, DOC = 5.629–5.412 mg L−1 and zeta potential = −14.8 ± 0.4 mV.
2.2 Preparation of coagulant and coagulant aid
Polyaluminum chloride (PAC), with an aluminum concentration of 10.0 g L−1, was prepared as the coagulant. The preparation details are available in the study reported by Zhao et al.21Ep was applied as a coagulant aid in this study. Fresh E. prolifera was dried and mixed with deionized water at a mass ratio of 1![[thin space (1/6-em)]](https://www.rsc.org/images/entities/char_2009.gif) :
:![[thin space (1/6-em)]](https://www.rsc.org/images/entities/char_2009.gif) 70. The mixture was extracted for 30 min under ultrasonic power (700 W) and then heated in a water bath for 6 h at 90 °C. Finally, alcohol was added and the precipitates were dried by a lyophilizer to obtain Ep. The structure of Ep was determined by infrared spectroscopy (IR), nuclear magnetic resonance (NMR) spectroscopy, X-ray photoelectron spectroscopy (XPS) and energy dispersive spectroscopy (EDS). The details of instruments and testing conditions are provided in the ESI.† The concentration, viscosity, zeta potential and molecular weight of the Ep stock solution were 1 g L−1, 1.12 × 10⁻³ Pa s−1, −40.30 ± 2.04 mV and 30–500 kDa, respectively.
70. The mixture was extracted for 30 min under ultrasonic power (700 W) and then heated in a water bath for 6 h at 90 °C. Finally, alcohol was added and the precipitates were dried by a lyophilizer to obtain Ep. The structure of Ep was determined by infrared spectroscopy (IR), nuclear magnetic resonance (NMR) spectroscopy, X-ray photoelectron spectroscopy (XPS) and energy dispersive spectroscopy (EDS). The details of instruments and testing conditions are provided in the ESI.† The concentration, viscosity, zeta potential and molecular weight of the Ep stock solution were 1 g L−1, 1.12 × 10⁻³ Pa s−1, −40.30 ± 2.04 mV and 30–500 kDa, respectively.
2.3 Coagulation process and effluent analysis
Coagulation tests were conducted using a jar-test apparatus. Previous studies have shown that the optimum coagulation efficiency is achieved when an organic polymer is dosed after adding the alum coagulant.22 Therefore, PAC was first dosed under rapid stirring, followed by the addition of Ep 30 s later, and this compound was denoted as the PAC–Ep composite coagulant. The synthetic AgNP–HA water was subjected to rapid mixing (200 rpm) for 1 min, followed by slow mixing (40 rpm) for 15 min and sedimentation for 20 min. After sedimentation, the effluent was collected for measuring residual turbidity, UV254 absorbance and zeta potential by a 2100P turbidimeter (Hach, USA), TU-1810 UV/VIS spectrophotometer (Puxi, China) and Zetasizer3000 (Malvern, UK), respectively. The residual concentration of AgNPs in the effluent was analyzed by inductively coupled plasma mass spectrometry (Agilent 7900, USA) after nitric acid digestion.2.4 Coagulation kinetics and floc characteristics
Kinetic processes, including floc generation, growth, breakage and regrowth, were studied using a coagulation agitator apparatus connected to a laser diffraction instrument. Coagulation procedures were conducted as follows: PAC–Ep was added with rapid mixing for 60 s (micro-floc generation), followed by slow mixing for 15 min (floc growth); then, shear was introduced by increasing the stirring speed to 200 rpm for 5 min (floc breakage). Finally, 40 rpm was introduced for a further 15 min (floc regrowth). Dynamic floc sizes were recorded automatically and the floc property indicators, including growth rate (Gr), strength factor (Sf) and recovery factor (Rf), were calculated according to the procedure reported by Mao et al.232.5 Ultrafiltration process
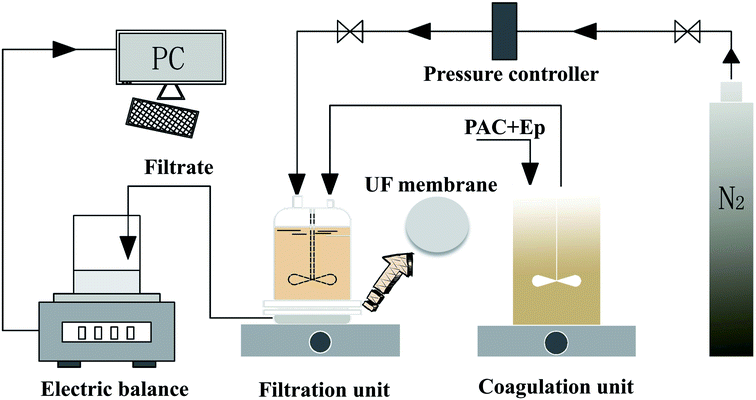
The coagulation effluent without sedimentation was decanted from the coagulation tank to a dead-end batch UF unit for ultrafiltration (under a constant pressure of 0.15 ± 0.02 MPa), which constituted the C-UF hybrid system (Fig. 1). The UF membrane with a molecular weight cutoff of 100 kDa should be immersed in deionized water for 48 h before use. An electronic balance connected to a PC was used to record the UF permeate weight every 10 s, and the flux decline was calculated to assess membrane fouling.3. Results and discussion
3.1 Ep characterization and structure analysis
EDS, IR spectroscopy, NMR spectroscopy and XPS were conducted to explore the structure of Ep (Fig. 2). In addition to carbon and oxygen, sulfur and nitrogen were found in EDS mapping (Fig. S1†), which indicated the possible existence of a sulfate group in the Ep molecule. The IR spectra of specific functional groups are presented in the ESI† (Table S1†). The bands at 3347 cm−1 and 2937 cm−1 correspond to the stretching vibrations of –OH and C–H, and the signal at 1608 cm−1 indicates the stretching vibration of the carbonyl group (C![[double bond, length as m-dash]](https://www.rsc.org/images/entities/char_e001.gif) O). The strong peaks at 1146 cm−1 and 848 cm−1 are assigned to the stretching vibrations of S
O). The strong peaks at 1146 cm−1 and 848 cm−1 are assigned to the stretching vibrations of S![[double bond, length as m-dash]](https://www.rsc.org/images/entities/char_e001.gif) O and C–O–S in C-2 of rhamnose.24,25
O and C–O–S in C-2 of rhamnose.24,25
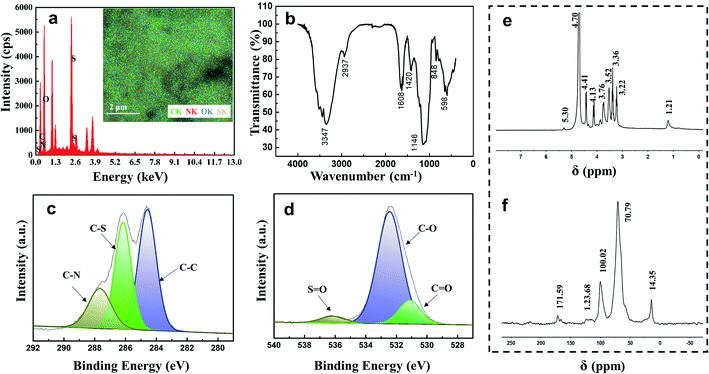 | ||
| Fig. 2 Characterization of E. prolifera polysaccharides: (a) EDS analysis; (b) FTIR spectrum; (c) XPS spectrum of C1s; (d) XPS spectrum of O1s; (e) 1H NMR spectrum; (f) 13C NMR spectrum. | ||
The 1H NMR spectrum displays a signal at 1.21 ppm, which corresponds to the proton of the –CH3 group at C-6 of rhamnose (Table S2†). The signals at 3.00–4.00 ppm are attributed to the protons at C-2–C-5 in sugar rings. The signal at 4.41 ppm corresponds to the 1 → 4 xylose anomeric proton; the signals at 4.70 ppm and 5.30 ppm are assigned to the 1 → 4 GlcUA and 1 → 4 rhamnose anomeric protons, respectively. The results mentioned above could also be confirmed from the 13C NMR spectrum: the chemical signals at 40–80 ppm correspond to the carbons at C-2–C-5 in the sugar rings, and the chemical signals at 95–105 ppm correspond to the anomeric proton region of 1 → 4 GlcUA and 1 → 4 rhamnose (Table S3†). The XPS results in Fig. 2(d) also exhibit a low-intensity peak at a binding energy of 536.3 eV, which represents the S![[double bond, length as m-dash]](https://www.rsc.org/images/entities/char_e001.gif) O bonds of the sulfate group in Ep. The intense peak at 532.5 eV is assigned to the C–O bonds, indicating the existence of alcohols and carboxylic acids. The C–C bonds were indicated by the peak at a binding energy of 284.7 eV in the XPS spectrum of C1s, and the peaks at the binding energies of 286.2 and 287.9 eV were assigned to the C–N bond and C–S bond, respectively.26 These inferences were consistent with the results of IR and NMR spectra, which demonstrated that the backbone of Ep was mainly composed of (1 → 4)-linked L-rhamnopyranose, (1 → 4)-linked D-xylose and (1 → 4)-linked GlcUA. The sulfate group and amino group were located at C-2 of (1 → 4)-linked L-rhamnopyranose and D-glucuronic acid. The corresponding structure of the Ep molecule is shown in Fig. 3.
O bonds of the sulfate group in Ep. The intense peak at 532.5 eV is assigned to the C–O bonds, indicating the existence of alcohols and carboxylic acids. The C–C bonds were indicated by the peak at a binding energy of 284.7 eV in the XPS spectrum of C1s, and the peaks at the binding energies of 286.2 and 287.9 eV were assigned to the C–N bond and C–S bond, respectively.26 These inferences were consistent with the results of IR and NMR spectra, which demonstrated that the backbone of Ep was mainly composed of (1 → 4)-linked L-rhamnopyranose, (1 → 4)-linked D-xylose and (1 → 4)-linked GlcUA. The sulfate group and amino group were located at C-2 of (1 → 4)-linked L-rhamnopyranose and D-glucuronic acid. The corresponding structure of the Ep molecule is shown in Fig. 3.
3.2 Effect of Ep on coagulation efficiency and mechanism
HA in aquatic environments can adsorb onto nanoparticle surfaces, which results in changes in the nanoparticle aggregation behavior and increases nanoparticle stability. Therefore, scanning electron microscopy (SEM) and transmission electron microscopy (TEM) were used to explore the dispersion morphology of AgNP–HA. Fig. 4 shows that the diameter of AgNPs in simulated water samples is about 30–60 nm and when 10 mg L−1 HA is added, significant adsorption between the HA macromolecules and AgNP colloids occurs uniformly. This phenomenon increases the difficulty of eliminating both AgNPs and HA. | ||
| Fig. 4 Distribution characteristics of Ep: (a) SEM image of AgNPs; (b) TEM image of AgNP–HA solution; (c) EDS analysis of AgNP–HA solution. | ||
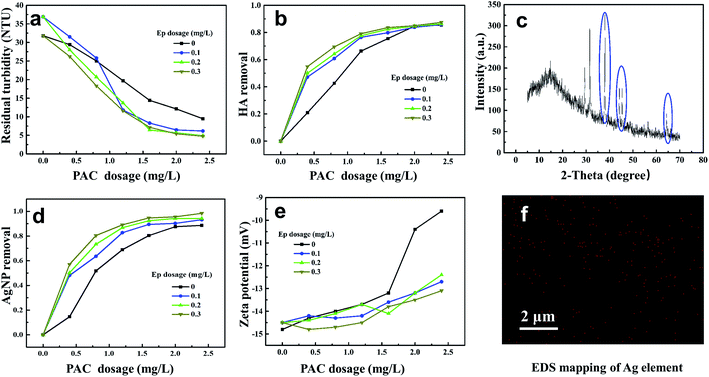
The removal efficiencies of AgNP–HA by coagulation processes were investigated under different PAC and Ep dosage conditions; the results are shown in Fig. 5. The curve for coagulation efficiency displays a distinctive camber shape and it can be divided into two regions: (1) an effective coagulation region (PAC dose < 1.6 mg L−1), where the AgNP–HA removal improved dramatically on increasing the PAC dosage; and (2) a stabilization region (1.6–2.4 mg L−1 of PAC), where the removal rate reached a plateau. The maximum AgNP and HA removal (36.64% and 40.09%, respectively) was obtained at a PAC dosage of 2.4 mg L−1. Zeta potential exhibited a gradual rising tendency as the PAC dosage increased, indicating that the negative charges of AgNP–HA could be neutralized by the positively charged hydrolysate of PAC. Therefore, charge neutralization was the dominant PAC mechanism. However, the zeta potential was only −9.5 mV at the optimum dosage, which indicated that charge neutralization was not the only PAC mechanism. Aluminum hydrolysis with different polymerization degrees and amorphous hydroxides can also play an efficient bridging role between flocs.27
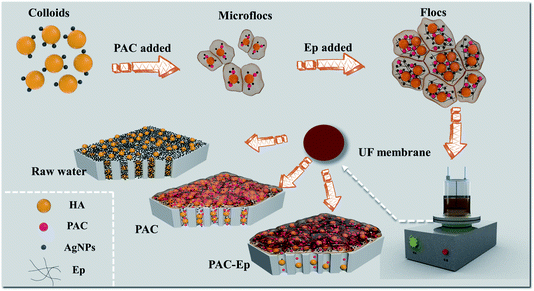
Fig. 5 shows that when Ep is used as a coagulant aid, the residual turbidity becomes lower, while the HA–AgNP removal rate becomes higher, indicating that the application of Ep is in favor of enhancing the coagulation efficiency. The AgNP and HA removal efficiency was over 90% when 1.2 mg L−1 PAC and 0.3 mg L−1 Ep were used, which was about 25–30% higher than that obtained when PAC was used alone. However, the zeta potential became lower due to the addition of negatively charged Ep. The mechanism for the reaction of PAC–Ep with AgNP–HA was inferred as follows: when PAC was dosed first, the hydrolysis reaction occurred quickly and then, various polynuclear hydrolysates neutralized the negative charges of AgNP–HA, which weakened the repulsive forces between the AgNP–HA colloids to form micro-flocs. After 30 s, Ep was used as a coagulant aid. The abundant hydroxyl, carboxyl and sulfate groups in Ep could react with the positively charged PAC hydrolysate to form an egg-box structure, which favored gel network generation through effective bridging by Ep. This gel network enhanced precipitate aggregation and swept unadsorbed AgNPs, resulting in larger flocs and better coagulation efficiency. To confirm this proposed coagulation mechanism, flocs were freeze-dried to conduct X-ray diffraction (XRD) and EDS. Fig. 5(c) shows that for the AgNP–HA water sample, three diffraction peaks at 38.041°, 44.230° and 64.410° are observed, representing the (111), (200), and (220) crystal faces belonging to the face-centered cubic crystals of silver, respectively. Moreover, elemental mapping (Fig. 5(f)) exhibited the homogeneous distribution of Ag on the surface of flocs. These results confirmed our inference that AgNPs could be removed by the sweep mechanism and then precipitation with flocs. Therefore, the PAC–Ep coagulant meets the requirements for AgNP–HA elimination. Considering the coagulation efficiency and cost factors, the optimum dosages of PAC and Ep were 2.0 mg L−1 and 0.3 mg L−1, respectively, for AgNP–HA removal.
3.3 Coagulation kinetics for AgNP–HA removal
Coagulation kinetics were studied under different PAC and Ep dosage conditions. The growth, breakage and regrowth processes of flocs were monitored. As can be seen from Fig. 6, flocs grew rapidly in a few minutes once PAC was dosed and then, a steady-state floc size distribution was observed. This indicated that the growth and breakage of flocs achieved an equilibrium condition. When shear force was introduced into the coagulation system, the floc sizes decreased sharply. However, as the shear force decreased, the broken flocs began to recover gradually. Fig. 6(a) indicates that the floc sizes in the steady-state phase increase gradually as the PAC dosage increases, achieving 268 μm when 2.4 mg L−1 PAC is dosed. According to the results presented in Section 3.2, the Ep dosages of 0.1, 0.2 and 0.3 mg L−1 were added under the optimal PAC dosage of 2.0 mg L−1. As can be seen from Fig. 6(b), the floc sizes in the steady-state phase of PAC–Ep are much larger than that for PAC. When 0.3 mg L−1 Ep was dosed, the aggregates after growth and regeneration were about 450 μm and 270 μm in size, respectively. To explore the floc characteristics quantitatively, various parameters were calculated and the results are shown in Table 1.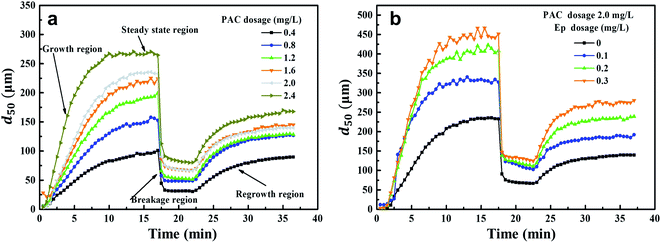 | ||
| Fig. 6 Floc formation-breakage-regrowth processes: (a) Effect of PAC dosage on floc size variation; (b) Effect of Ep dosage on floc size variation. | ||
| PAC dosage (mg L−1) | 0.4 | 0.8 | 1.2 | 1.6 | 2 | 2.4 | 2 | 2 | 2 |
| Ep dosage (mg L−1) | — | — | — | — | — | — | 0.1 | 0.2 | 0.3 |
| Equilibration time (min) | 14 | 12.5 | 12 | 11 | 11 | 10 | 10.0 | 9.0 | 7.5 |
| d50 (μm) | 96 | 146 | 180 | 198 | 208 | 267 | 323 | 381 | 384 |
| Growth rate (μm min−1) | 7 | 12 | 15 | 18 | 19 | 25 | 32 | 40 | 51 |
| Strength factor (%) | 32 | 36 | 28 | 30 | 29 | 32 | 31.6 | 27.8 | 28 |
| Recovery factor (%) | 88 | 78 | 54 | 47 | 38 | 40 | 39 | 42 | 46 |
The d50 values of flocs in the stable stage increased as the PAC dosage increased and the time required for equilibrium became shorter. This could be attributed to the effective collision between PAC hydrolysates and AgNP–HA particles. Larger floc sizes usually exhibit faster sedimentation speeds, which can enhance the coagulation effect.28 Therefore, larger floc sizes and growth rates (Table 1) were consistent with our results reported in Section 3.2. Table 1 also indicates that the flocs produced by PAC–Ep exhibited larger sizes and faster growth rates than that for PAC. Various hydrolysates of PAC with Ep polymers could form an egg-box structure and AgNP–HA could be trapped, which enlarged the collision radii of the suspended AgNPs and accelerated the aggregation rates.29 Additionally, the long carbon chain structure of Ep could adsorb more suspended AgNP–HA particles and promote effective bridging. Therefore, larger floc sizes and growth rates were observed when Ep was applied as a coagulant aid.
Floc breakage and recovery were inevitable due to the instability of the hydraulic conditions. The strength factor was basically maintained at 30% in both PAC and PAC–Ep coagulation systems, indicating strong ability to resist shear forces. However, the recovery factor of the AgNP–HA flocs formed by PAC–Ep was higher than that of the flocs formed by PAC, which indicated that Ep could promote floc regrowth in the coagulation process. This could be attributed to the following two reasons: (1) fragments could rebind after being broken due to van der Waals forces on the newly exposed floc surfaces; (2) unsaturated functional groups and the polarity of macromolecule organics in Ep could enhance the charged particles' adsorption effect. Therefore, the adsorption and bridging role of Ep resulted in better recovery ability of flocs. The particle size distributions of flocs before breakage, after breakage and regrowth were also analyzed. The volume of flocs with sizes smaller than 100 μm (shaded areas in Fig. 7) decreased significantly when Ep was applied. This is a great advantage since smaller particles always settle down more slowly and result in inferior coagulation efficiency.29,30 In different Ep dosage conditions, the shift distance from the initial peak to the peak after breakage was almost equal, which indicated that the difference in the anti-shear abilities of flocs was not significant. Comparatively, the peak after regrowth showed an apparent shift to the initial peak as the Ep dosage increased. The shortening of “S” indicates better recovery ability of the flocs produced by PAC–Ep.
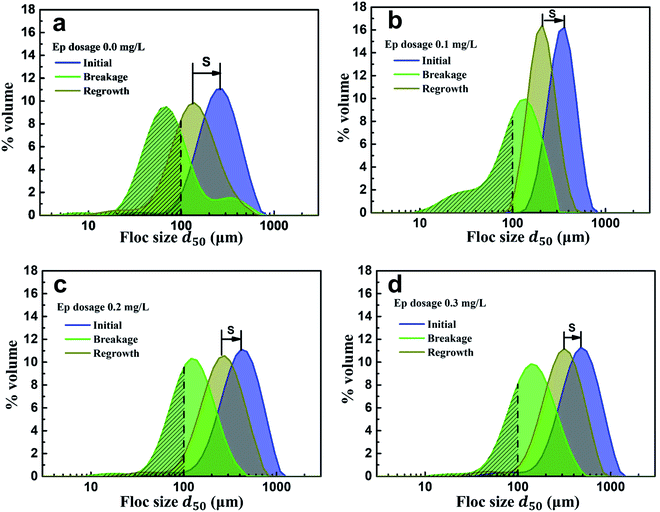 | ||
| Fig. 7 Particle size distributions of flocs generated in different Ep dosage conditions: (a) 0.0 mg L−1; (b) 0.1 mg L−1; (c) 0.2 mg L−1; (d) 0.3 mg L−1. | ||
3.4 UF efficiency and membrane fouling
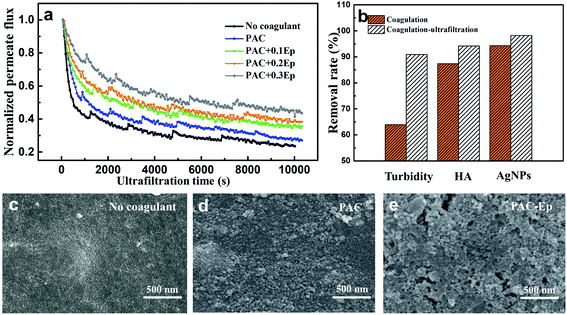
The coagulation effluent was carefully transferred to an ultrafiltration beaker to avoid breaking flocs. The UF process lasted for about 3 h until the flux was kept constant. The AgNP–HA concentration exhibited higher removal efficiency when the UF unit was applied on the basis of coagulation (Fig. 8): HA removal was about 94% in all the PAC–Ep dosage conditions, while its highest removal efficiency in the coagulation unit was only about 86%. Moreover, the removal of AgNPs after ultrafiltration exceeded 99%. Therefore, coagulation combined with ultrafiltration was effective for removing AgNP–HA in the water treatment process.Membrane fouling is the biggest barrier to the large-scale application of the UF technology. In this experiment, normalized permeate flux (J/J0) was used to represent the fouling degree of the UF membrane. The flux decline for raw water, coagulated water by PAC, and coagulated water by PAC–Ep is shown in Fig. 8(a). All the flux curves exhibited an initial dramatic decreasing trend and tended to be smoother 1 h later. The worst membrane fouling occurred when raw water was filtered, which indicated that applying coagulation as a pre-treatment measure could restrict membrane fouling caused by AgNP–HA. The UF membrane fouling mechanism includes three parts: pore size reduction due to the adsorption of the solute into the membrane channels, pore blocking due to the adsorption of the solute on the membrane surface and cake layer formation due to floc deposition.31 As shown in Fig. 9, when raw water was directly filtered through the UF membrane without coagulation, AgNPs easily entered into the membrane pores due to their small particle size, which resulted in serious pore size reduction and pore blocking both inside and on the surface of the membrane. As the coagulation unit could effectively remove AgNPs and HA particles, the membrane flux increased. Fig. 8(b) also shows that the membrane flux could be further enhanced with Ep addition, especially when 0.3 mg L−1 Ep was applied. This could be attributed to the following reasons: (1) As mentioned in Section 3.2, the coagulation efficiency of PAC–Ep was better than that of PAC, which resulted in a lower residual AgNP–HA concentration in the coagulation effluent. (2) Ep addition enlarged floc sizes and reduced the number of small aggregations. This had a significant effect on the reduction in membrane fouling since smaller flocs always contribute to higher specific cake resistance and more severe pore blocking.32 (3) Due to the gel network of Ep, the flocs produced by PAC–Ep exhibited more loose and porous structures than that produced by PAC. The compact flocs generated by PAC resulted in a remarkable increase in the specific cake resistance, while the loosely structured aggregates produced by PAC–Ep were more beneficial for membrane permeability.33 Considering coagulation efficiency, filtration performance and membrane fouling, 2.0 mg L−1 PAC and 0.3 mg L−1 Ep were selected as the optimal combination for AgNP–HA removal. With appropriate Ep addition, coagulation performance could be enhanced and UF membrane fouling could be reduced.
4. Conclusions
(1) The backbone of Ep was mainly composed of (1 → 4)-linked L-rhamnopyranose, (1 → 4)-linked D-xylose and (1 → 4)-linked glucuronic acid. Sulfate groups and amino groups were located at C-2 of (1 → 4)-linked L-rhamnopyranose and D-glucuronic acid.(2) AgNPs could be removed completely by the C-UF process when Ep was used as a coagulant aid. HA removal efficiency could also be enhanced due to the neutralization of PAC polynuclear hydrolysis products and the bridging-sweep role of the Ep gel network.
(3) The flocs generated by PAC–Ep showed larger sizes, faster growth rates and better recovery ability than those generated by PAC, which helped reduce ultrafiltration membrane fouling. The goal of simultaneously removing AgNP–HA and reducing membrane fouling could be achieved by applying Ep as a coagulant aid in the C-UF process.
Conflicts of interest
There are no conflicts to declare.Acknowledgements
This work was supported by National Natural Science Foundation of China (No. 51908256), Natural Science Foundation Youth Program of Jiangsu (BK20170238). The kind suggestions from the anonymous reviewers are highly appreciated.References
- S. Y. Zhang, X. Y. Xu, T. S. Lin and P. He, J. Mater. Sci.: Mater. Electron., 2019, 30, 13855–13868 CrossRef CAS.
- S. Y. Zhang, X. Q. Qi, M. Yang, Y. Cao, T. S. Lin, P. He and K. W. Paik, J. Mater. Sci.: Mater. Electron., 2019, 30, 9171–9183 CrossRef CAS.
- S. Y. Zhang, X. Liu, T. S. Lin and P. He, J. Mater. Sci.: Mater. Electron., 2019, 30(20), 18702–18709 CrossRef CAS.
- J. Wang, J. T. Jiu, S. Y. Zhang, T. Sugahara, S. Nagao, K. Suganuma and P. He, Nanotechnology, 2018, 29, 435701 CrossRef PubMed.
- Q. Wang, S. Y. Zhang, G. M. Liu, T. S. Lin and P. He, J. Alloys Compd., 2020, 820, 153184 CrossRef.
- Y. Liu, M. Tourbin, S. Lachaize and P. Guiraud, Powder Technol., 2014, 255, 149–156 CrossRef CAS.
- Q. Zheng, M. Zhou, W. C. Deng and X. C. Le, J. Environ. Sci., 2015, 34, 259–262 CrossRef CAS PubMed.
- J. K. Schluesener and H. J. Schluesener, Arch. Toxicol., 2013, 87, 569–576 CrossRef CAS PubMed.
- Z. H. Yuan, J. W. Li, L. Cui, B. Xu, H. W. Zhang and C. P. Yu, Chemosphere, 2013, 90, 1404–1411 CrossRef CAS PubMed.
- E. H. Jones and C. Su, Water Res., 2012, 46, 2445–2456 CrossRef CAS PubMed.
- Y. Wang, N. Xue, Y. B. Chu, Y. Y. Sun, H. Yan and Q. Han, Desalination, 2015, 367, 265–271 CrossRef CAS.
- J. Q. Jiang, Curr. Opin. Chem. Eng., 2015, 8, 36–44 CrossRef.
- T. E. A. Chalew, G. S. Ajmani, H. Huang and K. J. Schwab, Environ. Health Perspect., 2013, 121, 1161–1166 CrossRef PubMed.
- A. M. E. Badawy, T. P. Luxton, R. G. Silva, K. G. Scheckel, M. T. Suidan and T. M. Tolaymat, Environ. Sci. Technol., 2010, 44, 1260–1266 CrossRef PubMed.
- Q. Sun, Y. Li, T. Tang, Z. Yuan and C. P. Yu, J. Hazard. Mater., 2013, 261, 414–420 CrossRef CAS PubMed.
- J. Lohwacharin and S. Takizawa, J. Membr. Sci., 2009, 326, 354–362 CrossRef CAS.
- S. Zhao, F. Wang, W. L. Jia, Q. S. Sun and Z. J. Zou, RSC Adv., 2019, 9, 40316–40325 RSC.
- J. Nan, M. Yao, Q. G. Li, D. Zhan, T. Chen, Z. B. Wang and H. Y. Li, RSC Adv., 2016, 6, 163–173 RSC.
- X. Liu, M. Wazne, Y. Han, C. Christodoulatos and K. L. Jasinkiewicz, J. Colloid Interface Sci., 2010, 348, 101–107 CrossRef CAS PubMed.
- Y. Yu, Y. Li, C. Du, H. Mou and P. Wang, Carbohydr. Polym., 2017, 165, 221–228 CrossRef CAS PubMed.
- Y. X. Zhao, B. Y. Gao, Y. Wang, H. K. Shon, X. W. Bo and Q. Y. Yue, Chem. Eng. J., 2012, 183, 387–394 CrossRef CAS.
- X. Huang, B. Gao, Y. Y. Sun, Q. Y. Yue, Y. Wang, Q. Li and X. Xu, Sep. Purif. Technol., 2017, 173, 209–217 CrossRef CAS.
- R. R. Mao, Y. Wang, B. Zhang, W. Y. Xu, M. Dong and B. Y. Gao, Desalination, 2013, 314, 161–168 CrossRef CAS.
- P. Shobharani, V. H. Nanishankar, P. M. Halami and N. M. Sachindra, Int. J. Biol. Macromol., 2014, 65, 542–548 CrossRef CAS PubMed.
- M. Tabarsa, S. J. Lee and S. You, Carbohydr. Res., 2012, 361, 141–147 CrossRef CAS PubMed.
- J. Wang, Y. S. Li, W. Y. Chen, J. X. Peng, J. Hu, Z. S. Chen, T. Wen, S. S. Lu, Y. T. Chen, T. Hayat, B. Ahmad and X. K. Wang, Chem. Eng. J., 2017, 309, 445–453 CrossRef CAS.
- L. Z. Zhang, J. C. Mao, Q. Zhao, S. B. He and J. Ma, J. Environ. Sci., 2015, 38, 103–109 CrossRef CAS PubMed.
- C. H. Wu, Y. Wang, B. Y. Gao, Y. X. Zhao and Q. Y. Yue, Sep. Purif. Technol., 2012, 95, 180–187 CrossRef CAS.
- S. Zhao, Q. S. Sun, Y. Q. Gu, W. H. Yang, Y. Chen, J. Lin, M. Y. Dong, H. Y. Cheng, H. Hu and Z. H. Guo, Int. J. Biol. Macromol., 2020, 152, 576–583 CrossRef CAS PubMed.
- X. Shen, B. Y. Gao, K. Y. Guo and Q. Y. Yue, Chemosphere, 2019, 238, 124659 CrossRef PubMed.
- W. Y. Wang, Q. Y. Yue, R. H. Li, F. Bu, X. Shen and B. Y. Gao, Chemosphere, 2018, 200, 86–92 CrossRef CAS PubMed.
- P. Du, X. Li, Y. L. Yang, Z. Y. Su, H. Li, N. Wang, T. T. Guo, T. T. Zhang and Z. W. Zhou, J. Environ. Sci., 2019, 82, 82–92 CrossRef PubMed.
- X. Huang, B. Y. Gao, S. Zhao, S. L. Sun, Q. Y. Yue, Y. Wang and Q. Li, RSC Adv., 2016, 6, 49469–49477 RSC.
Footnote |
| † Electronic supplementary information (ESI) available. See DOI: 10.1039/d0ra02869j |
| This journal is © The Royal Society of Chemistry 2020 |

