 Open Access Article
Spatially-resolved uranium isotopic analysis of contaminated scrap metal using laser ablation multi-collector ICP-MS
Michael Krachler *,
Maria Wallenius,
Adrian Nicholl and
Klaus Mayer
European Commission, Joint Research Centre (JRC), Directorate for Nuclear Safety and Security, P. O. Box 2340, D-76125 Karlsruhe, Germany. E-mail: michael.krachler@ec.europa.eu
First published on 27th April 2020
Abstract
Laser ablation multi-collector inductively coupled plasma mass spectrometry (LA-MC-ICP-MS) was applied to the detailed investigation of the uranium (U) isotopic composition (234U, 235U, 236U, and 238U) of five contaminated scrap metal samples found within the European Union. Pressed pellets of the two certified U isotopic reference materials CRM U-020 and CRM U-030 were included in the measurement protocol for mass bias correction, calculation of the ion counter gains and for quality assurance. Since the investigated samples had low U content (0.15–14.3 wt%) compared to typically analysed pure U compounds (>60 wt%), the applied experimental parameters had to be adjusted. Spatially-resolved U isotopic information was obtained by line scan analysis of each sample. While other analytical techniques used typically in nuclear forensic investigations, such as γ-spectrometry and thermal ionisation mass spectrometry (TIMS) yielded average U isotopic compositions of the entire sample, LA-MC-ICP-MS provided substantial added value, highlighting the inhomogeneous distribution of U isotopes within various scrap metal samples. Analysis of individual particles via secondary ion mass spectrometry (SIMS) confirmed the large range of 235U enrichment levels in heterogeneous scrap metal samples. Four out of five scrap metal samples contained 236U (∼0.05–∼0.11 wt%), indicating the presence of reprocessed U. Taken together, LA-MC-ICP-MS analysis provided fast and accurate spatially-resolved U isotopic information without consuming or altering the scrap metal samples, a key feature for nuclear forensics investigations.
Introduction
Nuclear and other radioactive material continue to be found out of regulatory control.1–3 Illicit trafficking of such material poses a serious concern due to both its radiological hazard and proliferation risk. Nuclear forensics, the interface between law enforcement, nuclear science and non-proliferation, seeks to identify what the seized material is, how, when and where it was produced and what was its intended use.1–3Scrap metal is an important source material for the metal production industry, contributing a large fraction of the final product (in the case of steel, about 50%). Large scrapyards handle some ten million tonnes of scrap metal each year.4 The number of metal works and foundries worldwide that buy scrap to melt and refine or cast to shape is in the tens of thousands.5 Furthermore, there is substantial transboundary movement of scrap metal and other products of the metal recycling and production industries.6 As a consequence, radioactive material – being either carelessly or intentionally disposed of in an unlawful way and mixed with scrap metal – may inadvertently be transported across international borders. The number of such incidents involves up to 200 items per years in incoming loads of scrap in a single scrapyard.7 Given that radioactive sources in scrap metal have become a growing threat to the recycling industry, the International Atomic Energy Agency (IAEA) has issued guidelines for the scrap industry.4
Besides scrap metal, many nuclear forensic investigations frequently involve nuclear fuel cycle material such as uranium dioxide (UO2) pellets, U ores, U ore concentrates (UOCs or yellow cakes) or powders containing high enriched U (HEU).1,8–12 Important measurable material properties – referred to as “signatures” – include physical dimensions, chemical impurities, microstructure, and age of the material.1–3,11 In this context, the accurate and precise determination of the U isotopic composition of seized nuclear materials is a key signature. The abundance of 235U indicates whether the material contains depleted, low enriched U (LEU), HEU or natural U helping to identify its intended use. Because natural U does not comprise noteworthy amounts of 236U, the apparent presence of this U isotope indicates the exposure of the nuclear material to neutrons, i.e. its prior irradiation in a nuclear reactor.1
For the determination of the U isotopic composition of nuclear samples both non-destructive and destructive analytical procedures are routinely employed. Non-destructive γ-spectrometry analysis typically provides the first assessment of the U enrichment without altering or consuming the nuclear forensic evidence.13 The U isotopic information obtained using γ-spectrometry, however, is an average value and no information on the spatial distribution of the U isotopes within a solid sample can be acquired. At the other end of the analytical toolbox used in nuclear forensic analysis of solid samples is secondary ion mass spectrometry (SIMS), which can be used for single U particle measurements.14 To this end, items are swiped with dedicated cotton swipes removing thousands of particles having diameters typically ranging from <1 to 100 μm from their surface.
For more precise U isotopic analysis, destructive analytical techniques such as single or multiple collector (MC) inductively coupled plasma mass spectrometry (ICP-MS),9,10,15 thermal ionization mass spectrometry (TIMS),15 or even high resolution ICP-optical emission spectrometry (OES),16 are required. For the analysis of selected nuclear forensic samples having a very low abundance of 236U such as U ores or U ore concentrates (UOCs, yellow cakes), the use of accelerator mass spectrometry (AMS) can be advantageous.12 While the above mentioned solution-based, destructive methods allow the accurate determination of the U isotopic abundance, they also lack spatial information and only yield average values.
The knowledge of the spatial distribution of the abundance of the U isotopes of a seized solid sample provides added value for nuclear forensic investigations.17,18 Detailed knowledge of this characteristic gives insights into the U isotopic homogeneity of the material in question and allows drawing conclusions on the process of its production, e.g. powder blending or co-precipitation. Laser ablation (LA) combined with ICP-MS not only offers access to horizontal spatially-resolved U isotopic information of solid materials,17,18 but also to vertical spatially-resolved data, i.e. depth profiling.19 So far, however, only U bearing materials containing U as the matrix element such as U dioxide (UO2) pellets or UO2 single crystals were investigated for this characteristic.17–19
This study explored the potential of LA-MC-ICP-MS for the spatially-resolved U isotopic analysis (234U, 235U, 236U, and 238U) of contaminated scrap metal samples facing their low U concentrations and large elemental heterogeneity. Comparing LA-MC-ICP-MS data to corresponding results of bulk analysis using both γ-spectrometry and TIMS as well as to results of single U particle analysis using SIMS clearly demonstrated the added value of LA-MC-ICP-MS providing valuable information on such inhomogeneous samples.
Experimental
Instrumentation
Microscopic portions of solid samples were introduced into the plasma of the MC-ICP-MS via a ns-laser ablation (LA) system (ESI Lasers, Bozeman, MT, USA) operated at a wavelength of 213 nm. Essential operating parameters of the entire LA-MC-ICP-MS set-up were reported earlier.17,18,20
Certified reference materials
Pressed pellets of two certified U isotopic certified reference materials (CRMs) were included at regular intervals in all measurement sequences. Details of the preparation of the pressed pellets were provided earlier.17,18,20 Analysis of CRM U-020 (NBL, Argonne, IL, USA) prior to any unknown sample allowed establishing the correction factors for mass bias and to calculate the relative gain of the ion counters. CRM U-030 (NBL, Argonne, IL, USA) was analysed frequently to ascertain the quality of the U isotopic abundances established for the samples investigated throughout this study.Investigated samples
All specimens examined in this study originated from real cases having occurred in one of the European Union member states. The various contaminated objects were detected within scrap metal shipments by triggering a radiation alarm at scrap metal yards. First on-site analyses using hand-held instruments indicated the radionuclides. Some of the contaminated metal pieces were pipes containing uranium on the inside wall as a deposit. Subsequent γ-spectrometric measurement at the competent national laboratory provided an indication of the 235U enrichment. Successively, subsamples (a few g each) of this radioactive incrust found on the inner walls of the pipes and other items were removed and sent to JRC Karlsruhe for detailed nuclear forensic analysis. A fraction of <100 mg of each subsample was analysed using LA-MC-ICP-MS. They are hereafter referred to as “scrap metal 1” to “scrap metal 5”.Measurement procedures
Helium at a flowrate of 170 ml min−1 was used as a carrier gas to transport the ablated particle cloud from the LA system into the plasma of the MC-ICP-MS. Pressed pellets of the two CRMs were analysed in single spot mode. To this end, a circular laser spot of 5 μm diameter was focussed on the surface of each CRM at a frequency of 4 Hz for 5 s with a laser energy of ∼1.2 J cm−2. Line scan analysis was applied to the five scrap metal samples, thereby obtaining thousands of individual data points for each specimen investigated in this study. While the laser ablated 5 μm spots at 4 Hz, samples were moved horizontally at a speed of 20 μm s−1. Depending on the MC-ICP-MS signal response obtained for an individual sample, the laser power was varied between ∼9 J cm−2 and ∼16 J cm−2 for each line scan analysis. Because of the uneven surface of the investigated scrap metal samples, a single line scan was performed, with the laser beam following a path that allowed the sample surface always to remain within the focal plane.Prior to the measurement of the quality control sample (CRM U-030) or each actual sample, CRM U-020 was analysed, i.e. applying the standard-sample bracketing technique. This way, the mass bias correction factor as well as the efficiency of the ion counters were determined frequently in order to detect any possible drifting of the response in a timely manner.18
Data treatment
Evaluation of the raw data of the LA-MC-ICP-MS analysis was carried out using MS Excel®. To this end, data points representing instrument response of <10 mV measured on any of the two employed Faraday detectors (signals of 235U or 238U) were rejected. Additionally, any outliers, observed during the measurement of either CRM U020 or CRM U030, were eliminated from the data set using Microsoft Excel® outlier function. All U isotopic ratios reported here were corrected for mass bias.Quality control
To ensure the accuracy of the U isotopic measurements, the certified U isotopic standard reference material CRM U-030 was analysed regularly (n = 37) in between actual sample analysis. All three measured major n(235U)/n(238U) and minor abundant n(234U)/n(238U) n(236U)/n(238U) amount ratios matched well with the corresponding certified values (Table 1). The combined uncertainty (coverage factor k = 2) of the n(235U)/n(238U) amount ratio was as low as 0.07%. For the amount ratios of the minor abundant U isotopes the uncertainty amounted ∼2–3% (Table 1).| Measured | Certified | |
|---|---|---|
| n(234U)/n(238U) | 0.0001945 ± 0.0000012 | 0.0001960 ± 0.0000010 |
| n(235U)/n(238U) | 0.031474 ± 0.000021 | 0.031430 ± 0.000031 |
| n(236U)/n(238U) | 0.0002065 ± 0.0000060 | 0.0002105 ± 0.0000010 |
Results and discussion
Analytical challenges
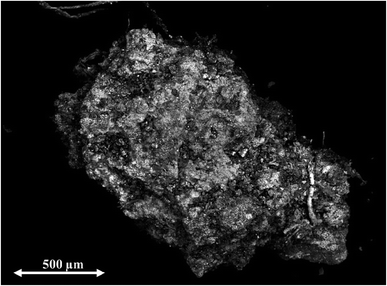
Because the five scrap metal samples had been investigated previously for their elemental composition including U content and U isotopic composition, specific information on the nature of these specimens was already at hand. Scanning electron microscope (SEM) combined with energy dispersive X-ray analysis (EDX) revealed that most of the scrap metal samples were not homogeneous at all with respect to their elemental concentrations. Uranium, for example, was only found on the white surface areas of scrap metal 3, as shown in Fig. 1. While this scrap metal contained mainly U and O, also Al, Ca, Fe, K, P, and Si were present at the wt% level.The uneven distribution of U within the contaminated scrap metal samples lead to higher signal variability in LA-MC-ICP-MS analysis as compared to homogeneous specimens, including the above mentioned certified reference material.17,18 The relatively small dynamic range of the linear response of the Faraday detectors (∼10 mV to 10 V) used to measure 235U and 238U abundances in the samples further contributed to the actual complexity because signal intensities of 235U and 238U needed to be kept within these limits. On top of that, the average U content of the investigated samples was low, ranging from 0.15 wt% in scrap metal 4 to 14.3 wt% in scrap metal 3 which is much lower than that of UO2 materials (>88 wt%), for example. Concurrently, the presence of large amounts of other elements such as Al, Be, Ca, Co, Cr, Fe, K, Mg, Ni, Ti in the scrap metal samples leads potentially to matrix effects.
The LA parameters (fluence, laser spot size) were optimised for every investigated sample to obtain high ion currents on the detectors of the MC-ICP-MS. Therefore, the laser fluence and/or the nominal diameter of the circular laser beam were increased to compensate for lower U content in a scrap metal sample, whenever necessary. This was, however, only possible within certain limits: if sample fragments were getting too small in size and too light in weight, application of laser powers higher than ∼10 J cm−2 caused movement of sample fragments within the LA chamber. Eventually, line scan analysis employing laser fluence exceeding 10 J cm−2 was impossible. The negative impact of such comparatively high laser energy on tiny samples would have required their fixation in the LA chamber. However, as the sample fragments were typically very porous, this feature did not favour fixing specimens with a glue or resin, for example. Additionally, fixation of specimens would have largely complicated their use for further nuclear forensic analysis.
Consequently, laser power was kept below 10 J cm−2 in such cases. Instead, the diameter of the circular laser beam was increased from 5 μm up to 20 μm in order to ablate sufficiently large amounts of material resulting in sufficiently high ion currents for statistically meaningful measurements. Simultaneously, the speed of sample translocation was increased from 20 μm s−1 to 80 μm s−1 to avoid overlaps between individual laser shots when scanning the sample surface with a frequency of 4 Hz.
LA-MC-ICP-MS analysis of scrap metal samples
LA-MC-ICP-MS results are summarised in Table 2. They revealed large variability of the U isotopic abundance for scrap metal samples 1–3, with somewhat more constant values found for samples 4 and 5. This can be concluded from the large standard deviations of the averaged line scan results for the U abundances. The large standard deviations are not caused by poor analytical measurements, but they reflect the inhomogeneity of the U isotopic composition in the investigated scrap metal samples. Moreover, the results indicated that the scrap metal samples 1 to 4 contained 236U (∼0.05–0.11 wt%), revealing that reprocessed U was handled in the facility, where these four scrap metal objects originate from.| LA-MC-ICP-MS | Data points | ||
|---|---|---|---|
| Average ± σ | Median | ||
| Scrap metal 1 | |||
| 234U | 0.161 ± 0.109 | 0.132 | 3495 |
| 235U | 27.6 ± 15.0 | 24.4 | |
| 236U | 0.0535 ± 0.0380 | 0.0442 | |
| 238U | 72.3 ± 15.0 | 75.3 | |
![[thin space (1/6-em)]](https://www.rsc.org/images/entities/char_2009.gif) |
|||
| Scrap metal 2 | |||
| 234U | 0.210 ± 0.184 | 0.161 | 4772 |
| 235U | 37.7 ± 20.8 | 34.7 | |
| 236U | 0.0723 ± 0.0782 | 0.0519 | |
| 238U | 62.0 ± 20.9 | 65.0 | |
![[thin space (1/6-em)]](https://www.rsc.org/images/entities/char_2009.gif) |
|||
| Scrap metal 3 | |||
| 234U | 0.312 ± 0.111 | 0.312 | 4588 |
| 235U | 34.5 ± 9.73 | 35.2 | |
| 236U | 0.114 ± 0.044 | 0.112 | |
| 238U | 65.1 ± 9.80 | 64.3 | |
![[thin space (1/6-em)]](https://www.rsc.org/images/entities/char_2009.gif) |
|||
| Scrap metal 4 | |||
| 234U | 0.128 ± 0.049 | 0.124 | 2126 |
| 235U | 16.5 ± 0.98 | 16.6 | |
| 236U | 0.114 ± 0.045 | 0.109 | |
| 238U | 83.3 ± 0.99 | 83.2 | |
![[thin space (1/6-em)]](https://www.rsc.org/images/entities/char_2009.gif) |
|||
| Scrap metal 5 | |||
| 234U | 0.0053 ± 0.0015 | 0.0052 | 3789 |
| 235U | 0.714 ± 0.012 | 0.713 | |
| 236U | <0.001 | <0.001 | |
| 238U | 99.28 ± 0.01 | 99.28 | |
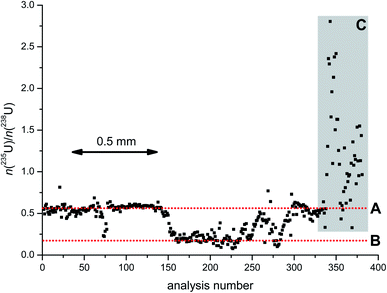
The inhomogeneity in the U isotopic composition is illustrated in detail in Fig. 2. The point-by-point line scan analysis of scrap metal 3 reveals the spatially-resolved heterogeneity of its n(235U)/n(238U) amount ratio within a distance of ∼2 mm along the sample surface, where the n(235U)/n(238U) amount ratio varied by a factor of ∼40-times, ranging from ∼0.075 to ∼2.8. Besides the pronounced isotopic heterogeneity, there were, however, also regions in which the n(235U)/n(238U) amount ratio was quite constant. The first 140 data points in Fig. 2 (dotted horizontal line A), for example, were centred around a value of ∼0.55 before dropping to ∼0.20 for the next ∼70 measurements (dotted horizontal line B). These regions of constant n(235U)/n(238U) amount ratios each indicated a single component (U isotope ratio) involved. The last ∼40 data points in Fig. 2 (grey rectangle C) indicate mixing of these two components with another one having a much higher U enrichment.
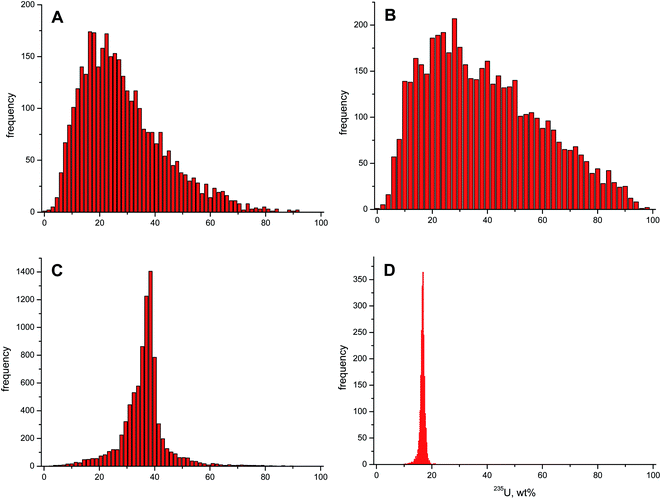
Scrap metal samples 1 and 2 originated from the same find and both contained highly enriched U. Both scrap metal samples also showed a low U content of <1 wt%. According to bulk TIMS analysis, their U isotopic composition appeared very similar, with a 235U abundance of ∼24.5 wt% and ∼25.9 wt%, respectively. The LA-MC-ICP-MS data, however, revealed contrasting average 235U enrichments of ∼27.6 wt% and ∼37.7 wt%, together with high standard deviations (Table 2). The difference between median and average 235U enrichment calculated from the LA-MC-ICP-MS data indicated an asymmetry of the corresponding frequency distribution. In fact, a distinct tailing towards higher 235U enrichments was obvious on the right side of the maximum 235U enrichment of both frequency distributions (Fig. 3A and B). This feature was more prominent for scrap metal 2. The obvious discrepancy in the 235U enrichment of bulk and spatially-resolved analysis was due to the large U isotopic inhomogeneity of these two samples. Based on the LA-MC-ICP-MS analysis, both scrap metal samples covered 235U enrichments ranging from natural to >90 wt% (Fig. 3A and B).
Scrap metal 3 had the highest U concentration among the investigated specimens in this study, i.e. ∼14 wt%. Both the average (34.5 wt%) and median (35.2 wt%) 235U enrichment found with LA-MC-ICP-MS on the surface of scrap metal 3 were almost identical. The 235U enrichment was, however, ∼10 wt% higher than the corresponding value established using TIMS (24.7 wt%). Again, spatially resolved U isotopic analysis revealed the large variability of the 235U enrichment present on a μm scale in this sample (Fig. 3C). Simultaneously, the obvious discrepancy of U isotopic information obtained by bulk and spatially-resolved analysis demonstrates the limits of the former in case of inhomogeneous samples and stresses the added value of LA-MC-ICP-MS analysis in this context. Even though the LA-MC-ICP-MS results also included low and highly enriched U, the corresponding frequency distribution of the 235U enrichment was much narrower than that of the scrap metal 1 and 2.
Scrap metal 4 had the lowest U content (∼0.15 wt%) of all specimens included in this study. This time, the average and median values obtained by LA-MC-ICP-MS (16.5 wt% and 16.6 wt%, respectively) and TIMS (16.8 wt%) matched with each other. Line scan analysis by LA showed that the 235U enrichment of scrap metal 4 consisted of a relative narrow, mono-modal frequency distribution.
Scrap metal 5 consisted of natural U, having a very narrow distribution of the abundance of all U isotopes. This sample was the only specimen in this study that contained no 236U. As for scrap metal 4, also here LA-MC-ICP-MS and TIMS results (0.714 wt% and 0.711 wt%, respectively) matched well with each other.
Comparison of spatially-resolved, bulk and particle U isotopic analysis
Analysis of sub-μm to a few-μm sized single U particles using SIMS yields additional data on sample inhomogeneity. To illustrate the impact of the different analytical approaches chosen for U isotopic analysis, the 235U enrichment of the five scrap metal samples was summarised in Table 3. Here, the results of bulk analysis, represented by γ-spectrometry and TIMS analysis, were compared to the outcome of spatially-resolved analysis employing LA-MC-ICP-MS and particle analysis using SIMS. For LA-MC-ICP-MS, the range of observed 235U enrichments is reported, whereas for SIMS the range of 235U enrichments determined for 23 to 45 individual particles, is shown.| Scrap metal | Type of Analysis | |||
|---|---|---|---|---|
| Bulk, NDAa | Bulk, DAb | Spatially-resolved | Particle | |
| γ-spectrometry | TIMS | LA-MC-ICP-MS | SIMS | |
| a Non-destructive analysis.b Destructive analysis.c Compare to Fig. 6. Dispersion of data is as low as for certified U isotopic reference materials18 and caused by the uncertainty of individual measurement points.d Not measured. | ||||
| 1 | 18.1 ± 0.4 | 24.50 ± 0.01 | 0.88–90.5 | 0.65–96.2 |
| 2 | 28.3 ± 2.5 | 25.92 ± 0.01 | 0.52–94.4 | 0.65–95.9 |
| 3 | 23.9 ± 0.5 | 24.65 ± 0.07 | 1.94–88.0 | 0.75–87.8 |
| 4 | 17.0 ± 3.5 | 16.76 ± 0.01 | 10.1–22.0 | 7.13–21.2 |
| 5 | 0.73 ± 0.03 | 0.711 ± 0.001 | 0.66–0.97c | —d |
Bulk U isotopic analysis
While uncertainties of γ-spectrometry results were ∼2 orders of magnitude higher than those obtained by TIMS, the former is a non-destructive analysis method that provided useful information on the entire sample within a couple of hours without altering/consuming the sample (Table 3).Comparison of average 235U enrichments obtained by γ-spectrometry and TIMS revealed large differences within the stated uncertainties (Table 3). This holds especially true for scrap metal samples 1 to 3 pointing to substantial inhomogeneity of their U isotopic composition. In such cases high precision analysis of the U isotopic composition of a relatively small fraction of the sample using TIMS is not necessarily representative for the entire specimen and might lead to wrong conclusions about the 235U enrichment of the sample.
Spatially-resolved U isotopic analysis
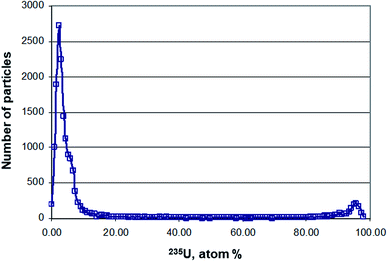
Depending on the inhomogeneity of the U isotopic composition within a scrap metal sample, the relative standard deviation of the average 235U enrichment sometimes exceeded 50% (Table 2). The obvious difference observed between average and median 235U enrichment suggested a skewed distribution, pointing to an inhomogeneous distribution of the U isotopic composition within scrap metal samples 1, 2, and 3, respectively.The large range of various 235U enrichments in scrap metal samples 1 to 3 was confirmed independently by SIMS (Table 3). One should note that LA-MC-ICP-MS and SIMS analysis utilise different sampling approaches that might lead to slightly different results. While particles were swiped off from the scrap metal samples and collected on a cotton swipe for SIMS analysis, LA-MC-ICP-MS analysis generated spatially resolved U isotopic data directly from the solid sample fragment. Despite the different sampling methods, the 235U enrichment range obtained by both techniques overlapped largely showing that the endpoints of the enrichments (i.e. lowest and highest) can be determined accurately also by LA-MC-ICP-MS (Table 3). The main difference between the LA-MC-ICP-MS and SIMS results are seen between the 235U enrichment endpoints. While LA-MC-ICP-MS results detected the entire range of 235U enrichments, i.e. also all enrichments between the endpoints (Fig. 3A), SIMS revealed two populations of 235U enrichments peaking at a few atom% and at >90 atom% (Fig. 4).
The difference of the results obtained via the two analytical approaches is not yet fully understood, however, the most reasonable explanation is that the LA-MC-ICP-MS data suffer from mixing of different 235U enrichments within a sample because of the constraints related to the temporal resolution of the measurement. As the laser was operated at 4 Hz and the signal of a single laser shot lasted for ∼1.5 s, the particle plume of several laser spots were mixed with each other. This mixing led to a smoothing of the results, and might be one of the reasons why the entire range of 235U enrichments was observable using LA-MC-ICP-MS. The use of single shot LA analysis might be advantageous in this context19 and will be tested in future studies. Depending on the particle size of the sample, also the diameter of the circular laser beam (5 μm to 20 μm in this study) may possibly influence the measured 235U enrichment obtained via LA-MC-ICP-MS. In other words, if the particle size of the uranium is smaller than the diameter of the laser beam, then the different U isotopic composition of individual particles would remain unresolved.
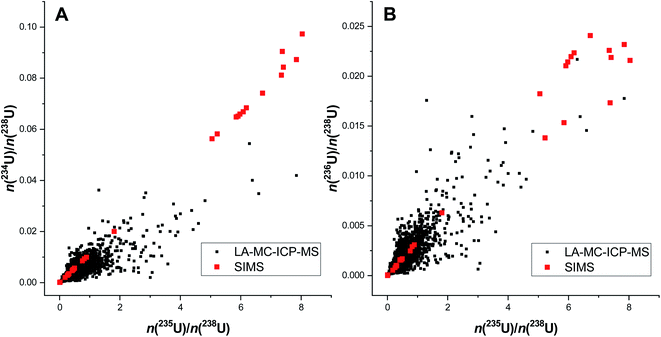
The difference in the information obtained by LA-MC-ICP-MS and SIMS is exemplified graphically for scrap metal 3 in Fig. 5. Corresponding three-isotope plots showed a reasonable correlation between both n(234U)/n(238U)/n(235U)/n(238U) amount ratios (Fig. 5A) and n(236U)/n(238U)/n(235U)/n(238U) amount ratios (Fig. 5B) obtained via LA-MC-ICP-MS. The relatively large scatter of the LA-MC-ICP-MS data comes from the fact that the data was obtained by a quick line scan, whereas the SIMS data was acquired via precise micro beam analysis. Again, this demonstrates that both techniques provide excellent information about the range of the different 235U enrichments in the samples. However, where SIMS shows mainly two clusters (low-enriched and highly enriched U), LA-MC-ICP-MS data also shows the mixtures.
Applying the statistical methodology developed earlier,18 only scrap metal 5 was considered homogeneous, while scrap metal samples 1–4 were inhomogeneous with respect to their U isotopic composition. The half width of the Gaussian distribution fitted from the frequency distribution of the 235U enrichment of scrap metal 5 revealed a value of 1.3 × 10⁻⁴ (Fig. 6) that was within the range of 0.8 × 10⁻⁴ to 1.8 × 10⁻⁴ obtained for homogenous reference materials.18 The corresponding half width of scrap metal sample 4, the next best candidate of what could potentially be considered homogeneous, was as high as 1.3 × 10⁻², hence clearly above the upper limit of the reference range indicated above. Because scrap metal 5 showed to be isotopically homogeneous, the spatially-resolved and bulk analysis results of the 235U enrichment (Table 3) were statistically not different.
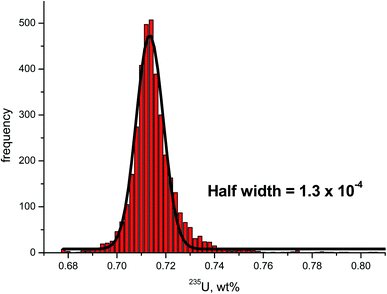 | ||
| Fig. 6 Frequency distribution of the 235U enrichment determined in scrap metal 5. The black solid line indicates the Gauss function fitted from the frequency distribution. The half width of this Gauss function is well within the range of 0.8 × 10⁻⁴ to 1.8 × 10⁻⁴ obtained earlier for certified U isotopic reference materials18 indicating that scrap metal 5 is homogeneous with respect to its U isotopic composition. | ||
Conclusions
Spatially-resolved U isotopic analysis of scrap metal samples using LA-MC-ICP-MS provided useful information on the inhomogeneity of the investigated materials which constitute the deposit on the surface of the scrap metal. Hence, this technique is complementing the nuclear forensics toolbox and is bridging the gap between bulk U isotopic analysis and particle analysis. LA-MC-ICP-MS results were available quickly, i.e. within a couple of hours, a key aspect in nuclear forensic investigations. Consequently, immediate assessment of the variability of 235U enrichments was attainable as well as quick identification of low- and highly enriched U, while the nuclear forensic sample remained virtually unchanged.Conflicts of interest
There are no conflicts to declare.Acknowledgements
Bulk U isotopic analysis employing γ-spectrometry and TIMS as well as U particle analysis using LG-SIMS performed by the Analytical Service of JRC Karlsruhe is gratefully acknowledged. This study was part of a Research Agreement between the International Atomic Energy Agency (IAEA) and JRC within IAEA's coordinated research program (CRP).References
- K. Lützenkirchen, M. Wallenius, Z. Varga, T. Wiss, A. Knott, A. Nicholl and K. Mayer, Nuclear forensics on uranium fuel pellets, Radiochim. Acta, 2019, 107, 635–643 Search PubMed.
- IAEA Incident and Trafficking Database (ITDB), Incidents of nuclear and other radioactive material out of regulatory control 2019 fact sheet, https://www.iaea.org/sites/default/files/19/04/itdb-factsheet-2019.pdf Search PubMed.
- K. Mayer, M. Wallenius and Z. Varga, Nuclear forensic science: correlating measurable material parameters to the history of nuclear material, Chem. Rev., 2013, 113, 884–900 CrossRef CAS PubMed.
- International Atomic Energy Agency, Control of Orphan Sources and Other Radioactive Material in the Metal Recycling and Production Industries, IAEA Safety Standards Series No. SSG-17, IAEA, Vienna, 2012, https://www-pub.iaea.org/MTCD/Publications/PDF/Pub1509_web.pdf Search PubMed.
- International Atomic Energy Agency, Control and Management of Radioactive Material Inadvertently Incorporated into Scrap Metal, Proc. Int. Conf. Tarragona, 2009, IAEA, Vienna, 2011 Search PubMed.
- United Nations Economic Commission For Europe, Recommendations on Monitoring and Response Procedures for Radioactive Scrap Metal: Report of an International Group of Experts convened by the United Nations Economic Commission for Europe, ECE/TRANS/NONE/2006/8, UNECE, Geneva, 2006 Search PubMed.
- Radioactivity in scrap metal – the invisible threat, Recycling International, September 2012, pp. 16-21 Search PubMed.
- N. Xu, C. Worley, J. Rim, M. Rearick, D. Labotka, L. Green and R. Walker, What's that yellow powder? A nuclear forensic case study, J. Radioanal. Nucl. Chem., 2018, 318, 17–25 CrossRef CAS.
- T. L. Spano, A. Simonetti, E. Balboni, C. Dorais and P. C. Burns, Trace element and U isotope analysis of uraninite and ore concentrate: applications for nuclear forensic investigations, Appl. Geochem., 2017, 84, 277–285 CrossRef CAS.
- E. Balboni, N. Jones, T. Spano, A. Simonetti and P. C. Burns, Chemical and Sr isotopic characterization of North America uranium ores: nuclear forensic applications, Appl. Geochem., 2016, 74, 24–32 CrossRef CAS.
- Nuclear Forensics, Scientific Analysis Supporting Law Enforcement and Nuclear Security Investigations, Anal. Chem., 2016, 88, 1496–1505 CrossRef PubMed.
- M. Srncik, K. Mayer, E. Hrnecek, M. Wallenius, Z. Varga, P. Steier and G. Wallner, Investigation of the 236U/238U isotope abundance in uranium ores and yellow cake samples, Radiochim. Acta, 2011, 99, 335–339 CrossRef CAS.
- L. Lakosi, J. Zsigrai, A. Kocsonya, T. C. Nguyen, H. Ramebäck, T. Parsons-Moss, N. Gharibyan and K. Moody, Gamma spectrometry in the ITWG CMX-4 exercise, J. Radioanal. Nucl. Chem., 2018, 315, 409–416 CrossRef CAS PubMed.
- V. Stebelkov, I. Elantyev, M. Hedberg, M. Wallenius and A.-L. Faure, Determination of isotopic composition of uranium in the CMX-4 samples by SIMS, J. Radioanal. Nucl. Chem., 2018, 315, 417–423 CrossRef CAS.
- A. Kuchkin, V. Stebelkov, K. Zhizhin, Ch. Lierse von Gostomski, Ch. Kardinal, A. H. J. Tan, B. K. Pong, E. Loi, E. Keegan, M. J. Kristo, M. Totland, I. Dimayuga and M. Wallenius, Contribution of bulk mass spectrometry isotopic analysis to characterization of materials in the framework of CMX-4, J. Radioanal. Nucl. Chem., 2018, 315, 435–441 CrossRef CAS.
- M. Krachler and P. Carbol, Validation of isotopic analysis of depleted, natural and enriched uranium using high resolution ICP-OES, J. Anal. At. Spectrom., 2011, 26, 293–299 RSC.
- M. Krachler, Z. Varga, A. Nicholl, M. M. Wallenius and K. Mayer, Spatial distribution of uranium isotopes in solid nuclear materials using laser ablation multi-collector ICP-MS, Microchem. J., 2018, 140, 24–30 CrossRef CAS.
- M. Krachler, Z. Varga, A. Nicholl and M. K. Mayer, Analytical considerations in the determination of uranium isotope ratios in solid nuclear materials using laser ablation multi-collector ICP-MS, Anal. Chim. Acta X, 2019, 2, 100018 Search PubMed.
- M. Krachler, A. Bulgheroni, A. I. Martinez Ferri, Y. Ma, A. Miard and Ph. Garcia, Single shot laser ablation MC-ICP-MS for depth profile analysis of U isotopes in UO2 single crystals, J. Anal. At. Spectrom., 2019, 34, 1965–1974 RSC.
- Z. Varga, M. Krachler, A. Nicholl, M. Ernstberger, T. Wiss, M. Wallenius and K. Mayer, Accurate measurement of uranium isotope ratios in solid materials by laser ablation multi-collector inductively coupled plasma mass spectrometry, J. Anal. At. Spectrom., 2018, 33, 1076–1080 RSC.
| This journal is © The Royal Society of Chemistry 2020 |

