 Open Access Article
Identification of xanthine oxidase inhibitors through hierarchical virtual screening†
Ying Yanga,
Lei Zhanga,
Jinying Tianb,
Fei Yeb and
Zhiyan Xiao *a
*a
aBeijing Key Laboratory of Active Substance Discovery and Druggability Evaluation, Institute of Materia Medica, Chinese Academy of Medical Sciences, Peking Union Medical College, Beijing 100050, China. E-mail: xiaoz@imm.ac.cn; Tel: +86-10-63189228
bBeijing Key Laboratory of New Drug Mechanisms and Pharmacological Evaluation Study, Institute of Materia Medica, Chinese Academy of Medical Sciences, Peking Union Medical College, Beijing 100050, China
First published on 24th July 2020
Abstract
As a critical enzyme for the uric acid production, xanthine oxidase (XO) has emerged as a primary drug target for antihyperuricemic therapy. A hierarchical virtual screening integrating both ligand-based and structure-based approaches was applied herein to identify potent XO inhibitors. Four compounds, which were previously reported as XO inhibitors, were recognized through the virtual screening protocol, and compound H3, which is distinct from the structures of known XO inhibitors, was identified as a new chemotype inhibitor with IC50 of 2.6 μM. The binding mode of H3 was further investigated by molecular docking and molecular dynamics (MD) simulation. The results suggested the feasibility to discover new chemotypes of XO inhibitors via integrated virtual screening strategies.
Introduction
Gout is a heterogeneous disease characterized by hyperuricemia and deposition of monosodium urate (MSU) crystals in joints and soft tissues. The main goal for the management of gout is to normalize the serum uric acid (SUA) level so as to prevent the formation of MSU crystals.1,2 According to the guidelines by the European League Against Rheumatism (EULAR), a target SUA level of less than 6 mg dL−1 is recommended and for those with severe gout, an even stricter requirement of less than 5 mg dL−1 is suggested.3 In addition to its close association with gout, hyperuricemia may also contribute to the pathogenesis of a series of other metabolic disorders.1,2 Therefore, maintaining an SUA level below the required threshold is critical for handling hyperuricemia-related health problems. As a result, urate-lowering therapies (ULT) to either reduce the production or increase the excretion of uric acid have been actively pursued in the recent decades.4,5As a vital enzyme for uric acid production, xanthine oxidase (XO) has been regarded as a primary target for ULT and XO inhibitors have been used as the first-line anti-hyperuricemia drugs in clinic.6–9 Currently, only three XO inhibitors, allopurinol, febuxostat and topiroxostat, are clinically available, yet their therapeutic uses are hampered by their adverse effects.6,9 The purine derivative allopurinol is the first XO inhibitor approved by FDA and has been globally prescribed for the treatment of gout and hyperuricemia since 1966. However, adverse drug hypersensitivity reactions related to allopurinol have been a major concern for its therapeutic use, especially the occurrence of rare yet life-threatening serious cutaneous adverse events (SCARs).10 Febuxostat is a non-purine XO inhibitor more potent and safer than allopurinol. As an alternative to allopurinol, it has been widely used for allopurinol-intolerant patients and asymptomatic hyperuricemia. However, adverse effects, including hypersensitivity reactions, a higher incidence of hepatotoxicity and higher cardiovascular risks, have also been reported for febuxostat.11,12 In particular, due to increased mortality risks and heart-related deaths, US FDA has required a “black box” warning for febuxostat since 2019. Another non-purine XO inhibitor, topiroxostat, was approved exclusively in Japan in 2013. Because of its short duration and confined clinical application, the adverse effects of topiroxostat are still to be fully explored.6 Obviously, there are still unmet clinical needs for effective and safe treatment of hyperuricemia and gout. Therefore, intense efforts have been devoted to the search for novel therapeutic agents targeting XO, the primary enzyme responsible for uric acid production.13–16
To identify new chemotypes of XO inhibitors, a hierarchical virtual screening integrating both ligand-based and structure-based approaches was reported herein and when applied to a commercially available chemical database, potent non-purine XO inhibitors were successfully recognized. Briefly, a predictive 3D-QSAR pharmacophore model was initially generated based on non-purine XO inhibitors collected from the literature. After rigorous validation, the model was subsequently combined with 2D-fingerprint similarity and molecular docking to screen the Specs chemical database. Notably, not only known XO inhibitors were effectively identified from the database, but also a potent XO inhibitor with a scaffold distinct from reported XO inhibitors was discovered.
Results and discussion
Analysis of XO inhibitors
Eighty-nine structurally diverse non-purine XO inhibitors with IC50 values ranging from 0.02 nM to 32 μM were gathered from the literature.17–25 The diversity sampling method described previously were utilized to rationally divide the dataset into training and test sets.26 Accordingly, a training set of twenty-six compounds was generated, and the remaining sixty-three compounds were classified into a test set. Each molecule in the whole data set was then plotted as a discrete point in a three-dimensional space by PCA (Fig. 1). It was observed that the training set adequately and evenly covers the chemical space occupied by the entire dataset, which supports the appropriate representativeness of the training set. The chemical structures and activity data of the training set molecules are listed in Fig. 2, and structures (Fig. S1†) and activities (Table S1†) of the test set molecules are provided in the ESI.†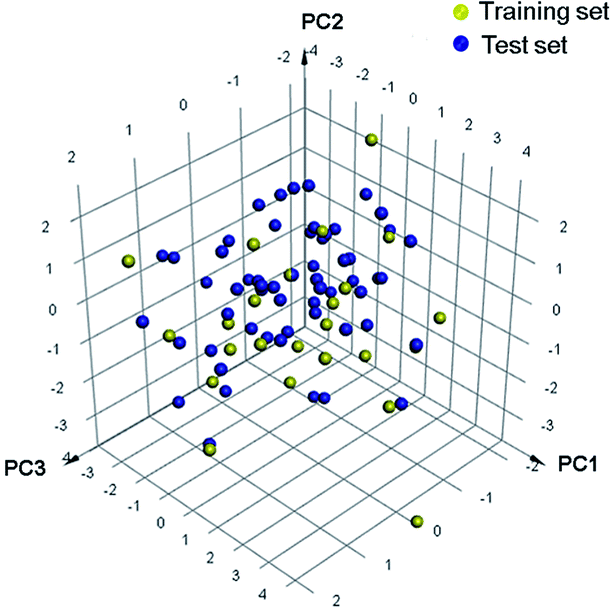 | ||
| Fig. 1 The 3D space coverage of the training and test set compounds illustrated by principal components analysis. | ||
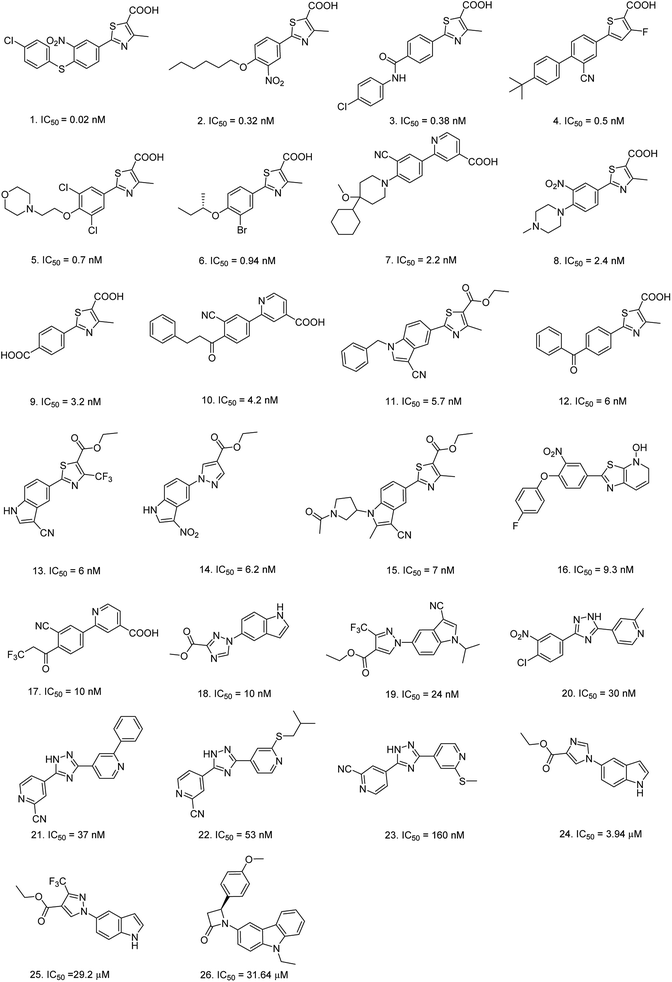 | ||
| Fig. 2 Chemical structures and inhibitory activities against XO of the twenty-six compounds in the training set. | ||
Generation of predictive pharmacophore models
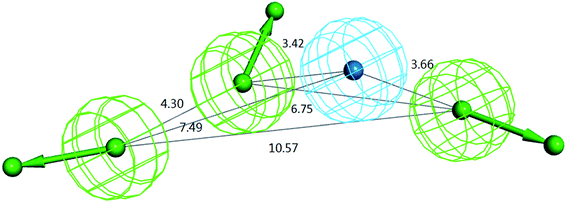
For the above training set selected, ten hypotheses were generated by the HypoGen algorithm.27 As shown in Table 1, all the ten models recognized the same four features, including three hydrogen bond acceptors (A) and one hydrophobic center (Y), yet the number of excluded volumes (E) in each model varied from zero to five. According to the statistical parameters of cost difference, correlation square and RMS value, Hypo 1 was chosen as a representative model for further validation and application. The composition of Hypo 1 as well as the distances between pharmacophoric features in Hypo 1 are illustrated in Fig. 3.| Hypo no. | Featuresa | Total cost | Fixed cost | Null cost | Cost diff.b | Conf. cost | Correlation square (r2) | RMS | Maximum fit |
|---|---|---|---|---|---|---|---|---|---|
| a A: hydrogen-bond acceptor; Y: hydrophobic or hydrophobic aromatic center; E: excluded volume.b Cost diff. = Null cost − Total cost. All cost units are in bits. | |||||||||
| 1 | AAAYE5 | 119.69 | 101.35 | 198.81 | 79.12 | 12.77 | 0.86 | 1.09 | 10.93 |
| 2 | AAAYE2 | 128.26 | 101.35 | 198.81 | 70.55 | 12.77 | 0.78 | 1.39 | 10.35 |
| 3 | AAAYE | 129.96 | 101.35 | 198.81 | 68.84 | 12.77 | 0.75 | 1.46 | 9.55 |
| 4 | AAAYE5 | 131.94 | 101.35 | 198.81 | 66.87 | 12.77 | 0.73 | 1.53 | 9.02 |
| 5 | AAAYE | 132.68 | 101.35 | 198.81 | 66.13 | 12.77 | 0.73 | 1.53 | 9.51 |
| 6 | AAAYE2 | 134.23 | 101.35 | 198.81 | 64.58 | 12.77 | 0.72 | 1.55 | 10.08 |
| 7 | AAAY | 135.23 | 101.35 | 198.81 | 63.58 | 12.77 | 0.70 | 1.60 | 9.12 |
| 8 | AAAYE3 | 135.42 | 101.35 | 198.81 | 63.39 | 12.77 | 0.71 | 1.59 | 9.88 |
| 9 | AAAYE4 | 135.48 | 101.35 | 198.81 | 63.33 | 12.77 | 0.73 | 1.53 | 11.30 |
| 10 | AAAYE2 | 136.82 | 101.35 | 198.81 | 62.00 | 12.77 | 0.69 | 1.63 | 9.47 |
Validation of Hypo 1
The validity of Hypo 1 was initially evaluated by the statistical parameters shown in Table 1. The parameters, including a configuration cost under 17, a cost difference with the confidence level higher than 90%, a total cost close to the fixed cost yet significantly different from the null cost value, an RMS value lower than 1.2 and a correlation square value as high as 0.86, reflected the reliability and predictive capability of Hypo 1.Hypo 1 was then validated by mapping with the co-crystallized structures of febuxostat and topiroxostat (Fig. S2†), as well as a series of potent non-purine XO inhibitors with diverse scaffolds (Fig. S3†). All the four pharmacophoric features in Hypo 1 could match perfectly well with all the inhibitor structures investigated. In particular, the atoms/groups identified by Hypo 1 in febuxostat and topiroxostat were in good consistency with the key interactions revealed by the co-crystal structures. These observations further supported the soundness of Hypo 1.
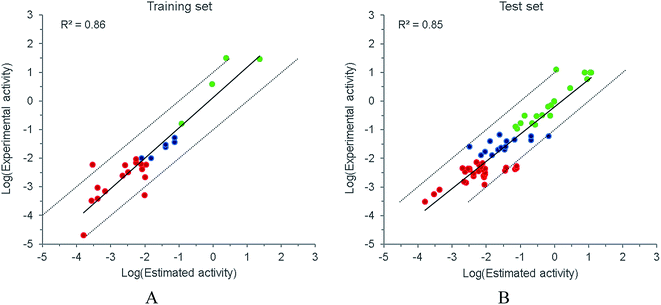
Both internal and external predictive capabilities of Hypo 1 were subsequently checked. As plotted in Fig. 4, the predictive R2 for the training and test sets were 0.86 and 0.85, respectively, and most of the compounds were confined to the one log unit error range. The discriminative power of Hypo 1 to differentiate the activity subsets was further examined. For the training set, Hypo 1 could generally classify the molecules in the right subset (Fig. 4A). When applied to the test set (Fig. 4B), molecules in the least active subset could generally be correctly categorized. However, several compounds in the most active subset were underestimated, and for the moderately active subset, which has a relatively narrow activity scope, a portion of the subset was mis-grouped to either the most or the least active subset. Considering the relatively rough resolution of a pharmacophore model, it might be unrealistic to expect Hypo 1 to precisely discern the boundary between the subsets, especially when minor structural differences could result in apparent activity variances. Therefore, it is imperative to combine Hypo 1 with complementary methods such as molecular docking to improve the discriminative power.
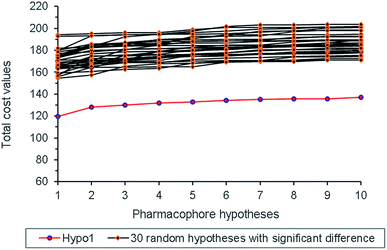
Randomization test was also performed to check whether Hypo 1 was derived from chance correlation,26 and thirty random pharmacophore models were generated accordingly. As shown in Fig. 5, the total cost values of the thirty random models were obviously higher than that of Hypo 1, and thus indicated the statistical reliability of Hypo 1.
A decoy set with 1500 compounds was constructed. Among them, one hundred compounds were collected from the literature, including sixty active non-purine XO inhibitors and forty inactive similar structures,17–25,28–38 and 1400 presumably inactive compounds were taken from ACD-3D database. This decoy set was applied to inspect the capability of Hypo 1 to distinguish the active from inactive ones, and the enrichment rate (EF) as well as the hit rate (HR) at various screening percentage were calculated to assess the model. The red line in Fig. 6A illustrated that fifty-six active compounds were identified in the top 10% of the decoy set with a 93.3% hit rate. The blue line indicated that all the sixty active compounds were identified from the top 17% screened decoy set (255 compounds). When the percentages of the data set screened were set to 2% and 5%, twenty-five and forty-seven active compounds were recognized, respectively (representing as grey dashed lines). Therefore, for screened percentages of 2%, 5% and 10%, the EF values reached 20.8, 15.7 and 9.3, which are close to the corresponding theoretical values of 50, 20 and 10. Under the same percentages, the HR values were 41.7%, 78.3% and 93.3%, respectively. Moreover, the true positive rate and the false positive rate were monitored in the screening process, which were plotted as the ROC (receiver operating characteristic) curve (Fig. 6B). The area under the ROC curve (AUC) was determined as 0.948 for Hypo 1, which demonstrated the excellent capability of Hypo 1 to classify the active and the inactive.
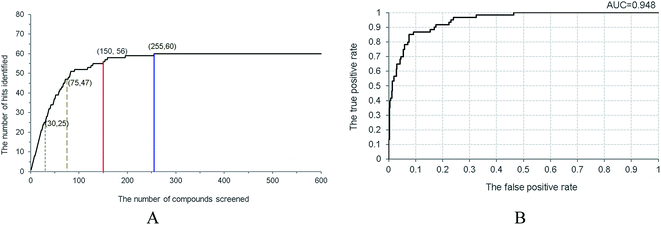 | ||
| Fig. 6 Validation of Hypo1 by screening the decoy set. (A) Relationship between the number of hits and the number of screened compounds. (B) The ROC curve derived from Hypo 1. | ||
Interestingly, all of the most active compounds (with IC50 values ranging from 0.01 nM to 0.1 μM) in the decoy set were successfully recognized when only 10.3% of the decoy set was screened. Under the same screening percentage, only two of the five marginally active compounds (with IC50 values ranging from 1 and 10 μM) were identified and the rest three could not be discerned until the screening percentage increased to 17%. Such observations indicated that the discriminative power of Hypo 1 was relatively weaker when applied to the boundary compounds, which was consistent with what was previously noticed in the test set prediction.
Virtual screening
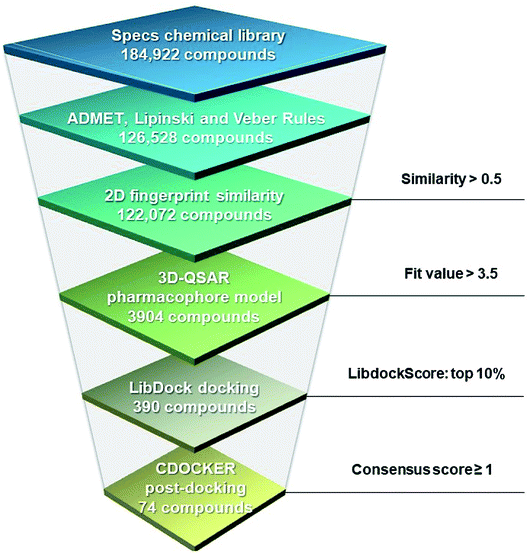
A hierarchical virtual screening approach was applied to screen the Specs database for potential XO inhibitors (Fig. 7). Firstly, the database containing 184![[thin space (1/6-em)]](https://www.rsc.org/images/entities/char_2009.gif) 922 compounds was filtered by ADMET properties, the Lipinski and Veber rules successively. The remaining compounds were subsequently subjected to similarity search based on the highly active reference compounds and Hypo 1 was then used to narrow the number of compounds down to 3904. To further refine the screening results, LibDock was carried out to rank the binding affinity of the 3904 compounds with XO, and 390 compounds in the top 10% were kept. Post-docking optimization was subsequently performed by CDOCKER. Ten scoring functions were evaluated for their capability to distinguish the active from the inactive ones in the decoy set, and the five scoring functions performed best were combined with the fit value based on Hypo 1 to form the consensus score (please refer to Fig. S4†), which was used to select seventy-four compounds as potential hits for further investigation.
922 compounds was filtered by ADMET properties, the Lipinski and Veber rules successively. The remaining compounds were subsequently subjected to similarity search based on the highly active reference compounds and Hypo 1 was then used to narrow the number of compounds down to 3904. To further refine the screening results, LibDock was carried out to rank the binding affinity of the 3904 compounds with XO, and 390 compounds in the top 10% were kept. Post-docking optimization was subsequently performed by CDOCKER. Ten scoring functions were evaluated for their capability to distinguish the active from the inactive ones in the decoy set, and the five scoring functions performed best were combined with the fit value based on Hypo 1 to form the consensus score (please refer to Fig. S4†), which was used to select seventy-four compounds as potential hits for further investigation.
Analysis of the 74 potential hits
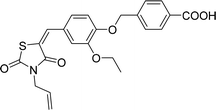
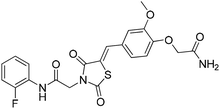
The 74 potential hits identified from virtual screening were classified into sixteen subgroups based on their core skeletons (cf. Fig. S5†). Among them, some subgroups possess core scaffolds found in known XO inhibitors,39–44 and four compounds are XO inhibitors reported previously (Fig. 8).39,40 The rest subgroups were distinct from the structures of known XO inhibitors, which might lead to the identification of new chemotypes of XO inhibitors.Biological evaluation
Six hits were then prioritized for biological evaluation against XO, which were selected from subgroups either similar to or distinct from known XO inhibitors. As shown in Table 2, three of the six compounds showed a percentage inhibition above 50% at the tested concentration of 10 μM. The most potent compound H3 (please refer to Fig. S6† for its structural characterization) showed an IC50 value of 2.6 μM. It is worth noting that though H3 is distinct from the structures of known XO inhibitors and might represent for a new chemotype for XO inhibitors, compounds bearing a thiobarbituric ring have been previously identified as XO-URAT1 (urate-anion transporter 1) dual inhibitors.50Binding mode of H3
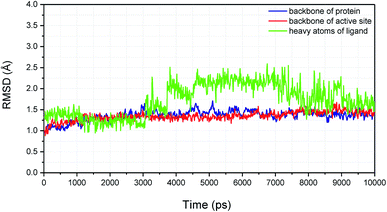
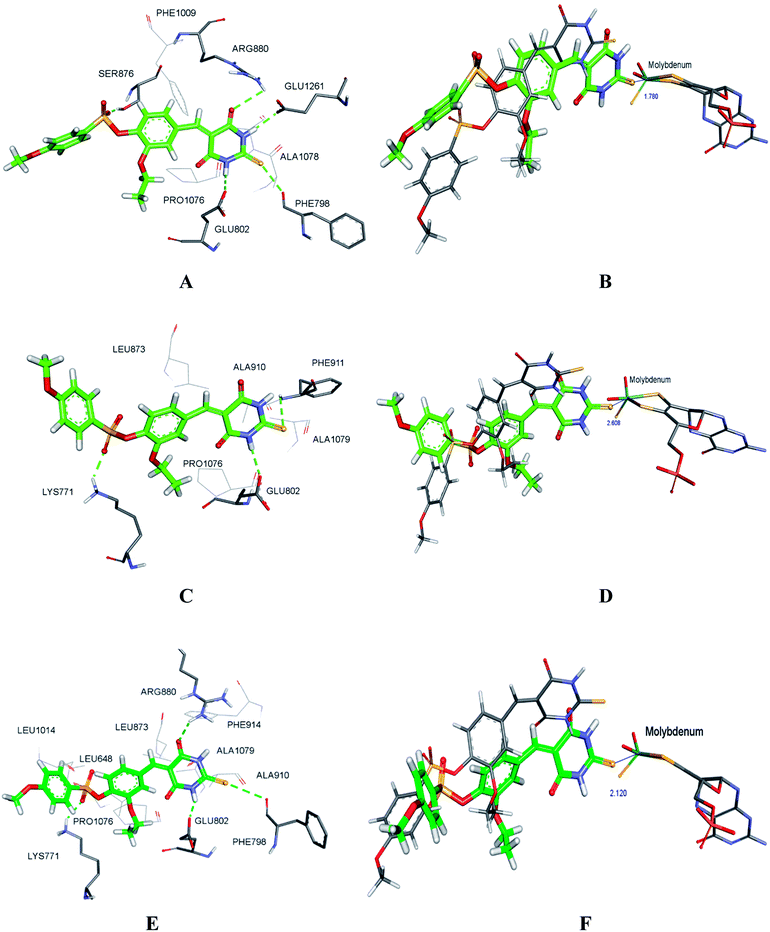
As shown in Fig. 9, molecular docking revealed that the key interactions between H3 and XO were similar to that of febuxostat (Fig. S2A†). The 2-thiobarbituric acid moiety seemed to have significant contribution to the inhibitory activity as it could form π hydrophobic interactions with Phe914 and Phe1009, as well as hydrogen bond interactions with Glu802, Thr1010, which were the most important interactions in febuxostat. Additional interaction between the sulfur atom in the thiobarbituric moiety and Ala1079 was also observed. Furthermore, the thiobarbituric ring of H3 protruded to the molybdenum cofactor (S⋯O distance = 2.839 Å), which implied that H3 might have inhibitory mechanisms different from febuxostat.To explore the binding stability of compound H3 to the active site of XO, the docking pose of H3 was used as the initial structure for a 10 ns molecular dynamics (MD) simulation. The root-mean-square deviation (RMSD) values for the backbone atoms of the protein and the active site, as well as the heavy atoms of the ligand H3 were plotted against the simulation duration (Fig. 10). The backbone atoms include the carboxylic C, Cα, and the amino N of the amino acids, and the active site was defined by the residues within a distance of 6.5 Å to the centroid of the ligand. As illustrated in Fig. 10, the average fluctuations in the RMSD values for the protein, the active site and the ligand were 1.361 Å, 1.346 Å and 1.725 Å, respectively. Based on the RMSD fluctuation of H3, the conformational variation could be roughly divided in three phases (0–3 ns, 3–7.5 ns and 7.5–10 ns). Accordingly, three representative snapshots of the XO–H3 complex were then extracted from the MD trajectory (Fig. 11A, C and E). During the simulation period, H3 was tightly bound to the enzyme via hydrogen bonds and hydrophobic interactions. When sampled at 1 ns, 5 ns and 10 ns, the hydrogen bond between H3 and Glu802 was consistently presented, and its occupancy percentage was higher than 91% during the 10 ns simulation period. However, hydrogen bonding with both Thr1010 and Ala1079, which was detected by molecular docking, was not monitored in the snapshots. Instead, additional hydrogen bonding interactions with Arg880, Lys771, Phe798, Glu1261, Phe911 and Ser876 were perceived. The sampled conformations were then superimposed with the docking pose of H3 (Fig. 11B, D and F), and it could be observed that during MD simulation, the thiobarbituric ring of H3 was in closer proximity to the molybdenum cofactor.
Conclusion
A hierarchical virtual screening approach was applied to identify new chemotypes of XO inhibitors from a commercially available database. The predictive quantitative pharmacophore model generated from known non-purine XO inhibitors was combined with fingerprint similarity search, docking refinement and consensus scoring strategy. As a result, seventy-four potential hits were selected, and four of them were known XO inhibitors. Six hits were prioritized for biological test and a potent XO inhibitor H3 with IC50 of 2.6 μM was identified. The binding mode of H3 was explored by molecular docking and MD simulation. The results demonstrated the feasibility to discover potential XO inhibitors through virtual screening.Materials and methods
Selection of data set
Eighty-nine structurally diverse non-purine XO inhibitors were collected from literatures and their biological activities were represented as IC50, which range from 0.02 nM to 32 μM.17–25 The 3D chemical structures of all the compounds were built and prepared in Discovery Studio 4.1 software package (DS 4.1, Accelrys, San Diego, USA),45 which generated reasonable conformers of all the compounds with the “Poling” algorithm. To guarantee sufficient chemical and biological diversity of the training set, a diversity sampling method was applied to select training sets rationally,26 and the rest compounds in the data set were taken as test set. The distribution of training set compounds in the three-dimensional space was examined by principal component analysis (PCA) to ensure the training set was representative enough.Generation and validation of pharmacophore model
For the selected training set, 3D-QSAR pharmacophore models were generated with HypoGen algorithm in DS 4.1.27 The features of hydrogen bond acceptor (A), hydrogen bond donor (D), hydrophobic or hydrophobic aromatic center (Y), and excluded volumes (E) were defined as pharmacophore characteristics. The “maximum conformations” was set to 400 and the energy threshold was set to 40 kcal mol−1 to generate a set of low-energy conformations for each molecule. Ten hypotheses could be generated by default and ranked by the total cost subsequently. The resultant pharmacophore model was assessed by cost value analysis, training and test sets prediction, randomization test, and was further validated by enrichment factor (EF) and hit rate (HR) in the virtual screening of the decoy set.26 Receiver operating characteristic (ROC) analysis was conducted to further examine the performance of the model.46Construction of decoy set
The decoy set was composed of 100 known compounds reported in the literature17–25,28–38 and 1400 presumably inactive compounds from ACD-3D database. Among the known compounds, fifty are non-purine XO inhibitors with IC50 ranging from 0.01 nM to 1 nM, five with IC50 from 10 to 100 nM, five with IC50 from 1 to 10 μM, and the rest are 40 inactive compounds with structures similar to the 60 active inhibitors.Virtual screening of database
The validated model was used to conduct virtual screening as a 3D-search query. A hierarchical virtual screening approach combined ligand-based and structure-based virtual screening methods was used to screen the Specs chemical database. Firstly, the database was prepared and duplicates were removed. The 184![[thin space (1/6-em)]](https://www.rsc.org/images/entities/char_2009.gif) 922 compounds obtained were filtered by ADMET properties, the principle of Lipinski and Veber rules subsequently. Then compounds with IC50 better than 1 nM were set as reference compounds, and those with fingerprint similarity below 0.5 to the reference compounds were removed. The pharmacophore-based virtual screening was then performed by using the “Ligand Pharmacophore Mapping” protocol. The “Maximum Omitted Features” was set to zero. The hit compounds obtained were then ranked according to their fit values and a threshold of 3.5 was set to select compounds for the followed docking steps.
922 compounds obtained were filtered by ADMET properties, the principle of Lipinski and Veber rules subsequently. Then compounds with IC50 better than 1 nM were set as reference compounds, and those with fingerprint similarity below 0.5 to the reference compounds were removed. The pharmacophore-based virtual screening was then performed by using the “Ligand Pharmacophore Mapping” protocol. The “Maximum Omitted Features” was set to zero. The hit compounds obtained were then ranked according to their fit values and a threshold of 3.5 was set to select compounds for the followed docking steps.
The crystal structure of xanthine oxidase (XO) in complex with febuxostat (PDB: 1N5X) was acquired from the protein data bank.47 The protein structure was prepared, and co-crystal ligand was redocked into the active site successfully by LibDock with a RMSD of 0.577 Å (LibDockScore = 120.991).48 For the first round, the top 10% compounds ranked by LibDockScore were remained for further refinement by using CDOCKER protocol.49 Then the docking poses were then scored with ten different scoring functions (LigScore1, LigScore2, −PLP1, −PLP2, Jain, −PMF, −PMF04, LibdockScore, −CDOCKER_INTERACTION_ENERGY, and −CDOCKER_ENERGY), and the performance of various scoring functions was compared by their capability to distinguish the active from the inactive ones in the decoy set (Fig. S4†). A consensus score was generated by combining the fit values-based Hypo 1 and the five scoring functions performed best (LigScore2, −PLP2, −PMF04, LibdockScore and −CDOCKER_INTERACTION_ENERGY), which was used for the final refinement of the virtual screening results and 74 potential hit were selected accordingly. The consensus score was defined as the number of scores that were in the top rank 20 percent.
Molecular dynamics simulations
The docked complex of XO with H3 was used as the initial structure for MD simulation in AMBER12 software package. The methodology is well described previously.51 Briefly, the Amber 03 force field was applied to the protein and the general AMBER force field (GAFF) was used to generate parameters for the ligand. The partial atomic charges of H3 optimized by Gaussian 03 at HF/6-31G* level of quantum mechanical (QM) calculation were assigned using the RESP protocol. The XO–H3 complex was neutralized by counter ions and solvated in TIP3P water box of 10 Å. The particle mesh Ewald (PME) method and the SHAKE algorithm were employed at a time step of 2 fs. Periodic boundary conditions were applied to avoid edge effects. Following the minimization for 10![[thin space (1/6-em)]](https://www.rsc.org/images/entities/char_2009.gif) 000 steps by steepest descent method and equilibrated in NVT ensemble for 1 ns, an unrestrained 10 ns production run was performed at 300 K under 1.0 atm pressure in NPT ensemble. Coordinate trajectories were recorded every 10 ps for the whole MD run.
000 steps by steepest descent method and equilibrated in NVT ensemble for 1 ns, an unrestrained 10 ns production run was performed at 300 K under 1.0 atm pressure in NPT ensemble. Coordinate trajectories were recorded every 10 ps for the whole MD run.
Biological assays
The effects on the XO-catalyzed xanthine (XAN) hydrolysis was determined at 37 °C and pH 7.4 in a 96-well plate. The reaction system contained (final concentrations) 3 U L−1 XO, 50 μM XAN, and 10 μM compound in a buffer (containing 3.5 mM KH2PO4, 15.2 mM K2HPO4, 0.25 mM EDTA, pH 7.4). The XO-catalyzed hydrolysis of XAN was measured by monitoring the absorbance at the wavelength of 293 nm with a spectrophotometer (Molecular Devices). All tests were performed in triplicate. The IC50 value was calculated by plotting relative XO activity versus different concentrations of compound using Prisma 5.0.Conflicts of interest
There are no conflicts to declare.Acknowledgements
We are grateful for the financial support from CAMS Innovation Fund for Medical Sciences (CIFMS, 2016-I2M-3-009) and the Drug Innovation Major Project (2018ZX09711-001-005). QM calculation and MD simulation were performed with Gaussian and AMBER programs supplied by the High Performance Computing Center of Peking Union Medical College.References
- J. A. Bernal, N. Quilis, M. Andres, F. Sivera and E. Pascual, Ther. Adv. Chronic. Dis., 2016, 7, 135–144 CrossRef CAS PubMed.
- P. Richette, M. Doherty, E. Pascual, V. Barskova, F. Becce, J. Castaneda-Sanabria, M. Coyfish, S. Guillo, T. L. Jansen, H. Janssens, F. Liote, C. Mallen, G. Nuki, F. Perez-Ruiz, J. Pimentao, L. Punzi, T. Pywell, A. So, A. K. Tausche, T. Uhlig, J. Zavada, W. Zhang, F. Tubach and T. Bardin, Ann. Rheum. Dis., 2017, 76, 29–42 CrossRef CAS PubMed.
- R. Soskind, D. T. Abazia and M. B. Bridgeman, Expert Opin. Pharmacother., 2017, 18, 1115–1125 CrossRef CAS PubMed.
- L. Strilchuk, F. Fogacci and A. F. Cicero, Expert Opin. Drug Saf., 2019, 18, 261–271 CrossRef CAS PubMed.
- Y. Dong, T. Zhao, W. Ai, W. A. Zalloum, D. Kang, T. Wu, X. Liu and P. Zhan, Expert Opin. Ther. Pat., 2019, 29, 871–879 CrossRef CAS PubMed.
- M. B. Bridgeman and B. Chavez, Expert Opin. Pharmacother., 2015, 16, 395–398 CrossRef CAS PubMed.
- C. Chen, J. M. Lu and Q. Yao, Med. Sci. Monit., 2016, 22, 2501–2512 CrossRef CAS PubMed.
- C. W. Wang, R. L. Dao and W. H. Chung, Curr. Opin. Allergy Clin. Immunol., 2016, 16, 339–345 CrossRef CAS PubMed.
- R. Ojha, J. Singh, A. Ojha, H. Singh, S. Sharma and K. Nepali, Expert Opin. Ther. Pat., 2017, 27, 311–345 CrossRef CAS PubMed.
- A. Smelcerovic, K. Tomovic, Z. Smelcerovic, Z. Petronijevic, G. Kocic, T. Tomasic, Z. Jakopin and M. Anderluh, Eur. J. Med. Chem., 2017, 135, 491–516 CrossRef CAS PubMed.
- U. R. Batchu and J. R. Surapaneni, Int. J. Pharm. Pharm. Sci., 2018, 10, 1–4 CrossRef CAS.
- W. B. White, K. G. Saag, M. A. Becker, J. S. Borer, P. B. Gorelick, A. Whelton, B. Hunt, M. Castillo, L. Gunawardhana and C. Investigators, N. Engl. J. Med., 2018, 378, 1200–1210 CrossRef CAS PubMed.
- R. Kumar, G. Joshi, H. Kler, S. Kalra, M. Kaur and R. Arya, Med. Res. Rev., 2018, 38, 1073–1125 CrossRef CAS PubMed.
- T. Pascart and P. Richette, Expert Opin. Investig. Drugs, 2018, 27, 437–444 CrossRef CAS PubMed.
- W. H. El-Tantawy, Arch. Physiol. Biochem., 2019, 1–12 Search PubMed.
- G. Luna, A. V. Dolzhenko and R. L. Mancera, ChemMedChem, 2019, 14, 714–743 CrossRef CAS PubMed.
- A. Fukunari, K. Okamoto, T. Nishino, B. T. Eger, E. F. Pai, M. Kamezawa, I. Yamada and N. Kato, J. Pharmacol. Exp. Ther., 2004, 311, 519–528 CrossRef CAS PubMed.
- T. Sato, N. Ashizawa, T. Iwanaga, H. Nakamura, K. Matsumoto, T. Inoue and O. Nagata, Bioorg. Med. Chem. Lett., 2009, 19, 184–187 CrossRef CAS PubMed.
- T. Sato, N. Ashizawa, K. Matsumoto, T. Iwanaga, H. Nakamura, T. Inoue and O. Nagata, Bioorg. Med. Chem. Lett., 2009, 19, 6225–6229 CrossRef CAS PubMed.
- S. Wang, J. Yan, J. Wang, J. Chen, T. Zhang, Y. Zhao and M. Xue, Eur. J. Med. Chem., 2010, 45, 2663–2670 CrossRef CAS PubMed.
- S. P. Choi, G. T. Kim, J. U. Song, T. H. Kim, D. C. Lim, S. W. Kang and H. J. Kim, Google Patents, 2011, WO2011043568A2.
- R. Kumar, S. Darpan, S. Sharma and R. Singh, Expert Opin. Ther. Patents, 2011, 21, 1071–1108 CrossRef CAS PubMed.
- K. Matsumoto, K. Okamoto, N. Ashizawa and T. Nishino, J. Pharmacol. Exp. Ther., 2011, 336, 95–103 CrossRef CAS PubMed.
- A. Bytyqi-Damoni, H. Genc, M. Zengin, S. Beyaztas, N. Gencer and O. Arslan, Artif. Cells Blood Substit, Immobil. Biotechnol., 2012, 40, 369–377 CAS.
- B. R. Chandrika, A. Kulkarni-Almeida, K. V. Katkar, S. Khanna, U. Ghosh, A. Keche, P. Shah, A. Srivastava, V. Korde, K. V. Nemmani, N. J. Deshmukh, A. Dixit, M. K. Brahma, U. Bahirat, L. Doshi, R. Sharma and H. Sivaramakrishnan, Bioorg. Med. Chem., 2012, 20, 2930–2939 CrossRef PubMed.
- C. Fang, Z. Xiao and Z. Guo, J. Mol. Graph. Model., 2011, 29, 800–808 CrossRef CAS PubMed.
- Y. Kurogi and O. F. Guner, Curr. Med. Chem., 2001, 8, 1035–1055 CrossRef CAS PubMed.
- S. Ishibuchi, H. Morimoto, T. Oe, T. Ikebe, H. Inoue, A. Fukunari, M. Kamezawa, I. Yamada and Y. Naka, Bioorg. Med. Chem. Lett., 2001, 11, 879–882 CrossRef CAS PubMed.
- E. Fernandes, F. Carvalho, A. M. Silva, C. M. Santos, D. C. Pinto, J. A. Cavaleiro and L. Bastos Mde, J. Enzyme Inhib. Med. Chem., 2002, 17, 45–48 CrossRef CAS PubMed.
- J. F. Hsieh, S. H. Wu, Y. L. Yang, K. F. Choong and S. T. Chen, Bioorg. Med. Chem., 2007, 15, 3450–3456 CrossRef CAS PubMed.
- K. Nepali, G. Singh, A. Turan, A. Agarwal, S. Sapra, R. Kumar, U. C. Banerjee, P. K. Verma, N. K. Satti, M. K. Gupta, O. P. Suri and K. L. Dhar, Bioorg. Med. Chem., 2011, 19, 1950–1958 CrossRef CAS PubMed.
- B. P. Bandgar, L. K. Adsul, H. V. Chavan, S. N. Shringare, B. L. Korbad, S. S. Jalde, S. V. Lonikar, S. H. Nile and A. L. Shirfule, Bioorg. Med. Chem., 2012, 20, 5649–5657 CrossRef CAS PubMed.
- S. D. Beedkar, C. N. Khobragade, S. S. Chobe, B. S. Dawane and O. S. Yemul, Int. J. Biol. Macromol., 2012, 50, 947–956 CrossRef CAS PubMed.
- S. M. Lin, J. Y. Wu, C. Su, S. Ferng, C. Y. Lo and R. Y. Chiou, J. Agric. Food Chem., 2012, 60, 9856–9862 CrossRef CAS PubMed.
- C. Buvana, T. K. Ravi and M. Sukumar, Der Pharmacia Sinica, 2013, 4, 131–139 CAS.
- R. Dhiman, S. Sharma, G. Singh, K. Nepali and P. M. Singh Bedi, Arch. Pharm, Weinheim), 2013, 346, 7–16 CrossRef CAS PubMed.
- K. C. Sekhar, G. Madhava, K. V. Ramana, C. R. Murthy and C. N. Raju, Lett. Drug Des. Discov., 2014, 11, 207–210 CrossRef CAS.
- S. Shukla, D. Kumar, R. Ojha, M. K. Gupta, K. Nepali and P. M. Bedi, Arch. Pharm. (Weinheim), 2014, 347, 486–495 CrossRef CAS PubMed.
- H. S. D. Naeff, M. C. R. Franssen and H. C. van der Plas, Recl. Trav. Chim. Pays-Bas, 1991, 110, 139–150 CrossRef CAS.
- S. Pirouzpanah, J. Hanaee, S. V. Razavieh and M. R. Rashidi, J. Enzyme Inhib. Med. Chem., 2009, 24, 14–21 CrossRef CAS PubMed.
- H. H. Iris, J. P. Scoville, D. J. Reynolds, R. Simlot and P. Duncan, Life Sci, 1990, 46, 1923–1927 CrossRef.
- M. Leigh, C. E. Castillo, D. J. Raines and A. K. Duhme-Klair, ChemMedChem, 2011, 6, 612–616 CrossRef CAS PubMed.
- A. B. Begum, M. Begum, V. L. Ranganatha, T. Prashanth, F. Zameer, R. Hegdekatte and S. A. Khanum, Arch. Pharm. Chem. Life Sci., 2014, 347, 247–255 CrossRef CAS PubMed.
- D. H. Shi, W. Huang, C. Li, Y. W. Liu and S. F. Wang, Eur. J. Med. Chem., 2014, 75, 289–296 CrossRef CAS PubMed.
- Discovery Studio, version 4.1, Accelrys Software Inc., San Diego, 2014 Search PubMed.
- N. Triballeau, F. Acher, I. Brabet, J.-P. Pin and H.-O. Bertrand, J. Med. Chem., 2005, 48, 2534–2547 CrossRef CAS PubMed.
- K. Okamoto, B. T. Eger, T. Nishino, S. Kondo, E. F. Pai and T. Nishino, J. Biol. Chem., 2003, 278, 1848–1855 CrossRef CAS PubMed.
- S. N. Rao, M. S. Head, A. Kulkarni and J. M. LaLonde, J. Chem. Inf. Model., 2007, 47, 2159–2171 CrossRef CAS PubMed.
- J. K. Gagnon, S. M. Law and C. L. Brooks, J. Comput. Chem., 2016, 37, 753–762 CrossRef CAS PubMed.
- R. P. Warrell and J. J. Piwinski, Google Patents, 2016, WO2016118611A1.
- Y. Yang, Y. Shen, H. Liu and X. Yao, J. Chem. Inf. Model., 2011, 51, 3235–3246 CrossRef CAS PubMed.
Footnote |
| † Electronic supplementary information (ESI) available: Structural information of test set compounds (Fig. S1). Experimental and estimated activities of the training and test sets (Table S1). Mappings of Hypo 1 were shown in Fig. S2–S4 illustrated performance of different docking scoring functions and the consensus score. The 74 potential hits identified from virtual screening were classified into sixteen subgroups and the scaffolds for the subgroups were supplied in Fig. S5. Chemical characterizations for compound H3 were given in Fig. S6. See DOI: 10.1039/d0ra03143g |
| This journal is © The Royal Society of Chemistry 2020 |

