 Open Access Article
Preparation and characterization of antibacterial dopamine-functionalized reduced graphene oxide/PLLA composite nanofibers
Biyun Li†
a,
Feng Xiong†a,
Bo Yaoa,
Qian Dua,
Jun Caoa,
Jiangang Qucd,
Wei Feng*be and
Huihua Yuan *a
*a
aSchool of Life Sciences, Nantong University, Nantong, Jiangsu 226019, China. E-mail: yuanhh@ntu.edu.cn
bState Key Laboratory of High Performance Ceramics and Superfine Microstructure, Shanghai Institute of Ceramics, Chinese Academy of Sciences, Shanghai 200050, China. E-mail: fengwei@mail.sic.ac.cn
cSchool of Textile and Clothing, Nantong University, Nantong, Jiangsu 226019, China
dKey Laboratory of Textile Science, Donghua University, Ministry of Education, Shanghai 201620, Shanghai, China
eSchool of Life Sciences, Shanghai University, Shanghai 200444, China
First published on 15th May 2020
Abstract
Electrospun poly(L)-lactide (PLLA) ultrafine fibers are a biodegradable and biocompatible scaffold, widely used in tissue engineering applications. Unfortunately, these scaffolds have some limitations related to the absence of bioactivity and antibacterial capacity. In this study, dopamine-functionalized reduced graphene oxide (rGO)/PLLA composite nanofibers were fabricated via electrospinning. The morphology and the physicochemical and biological properties of the composite nanofibers were investigated. The results indicate that incorporating rGO improves the hydrophilic, mechanical, and biocompatibility properties of PLLA nanofibers. Tetracycline hydrochloride (TC)-loaded rGO/PLLA composite nanofibers showed better controlled drug release profiles compared to GO/PLLA and PLLA nanofibrous scaffolds. Drug-loaded nanofibrous scaffolds showed significantly improved antibacterial activity against Gram-negative Escherichia coli (E. coli) and Gram-positive Staphylococcus aureus (S. aureus). Additionally, rGO/PLLA composite nanofibers exhibited enhanced cytocompatibility. Thus, it can be concluded that rGO/PLLA composite nanofibers allow the development of multifunctional scaffolds for use in biomedical applications.
1. Introduction
Electrospinning is one of the simplest, most versatile, and applicable techniques to process or melt polymer solutions into continuous fibers with diameters ranging from several micrometers to several nanometers for functional tissue engineering scaffolds.1 Poly(L)-lactic acid (PLLA) is one of the most studied polymers, and is widely used for numerous applications (e.g., tissue engineering and drug-delivery systems) because of its biocompatibility, tailorable biodegradation kinetics, and US Food and Drug Administration (FDA) approval.2 Electrospun PLLA nanofibers are widely used to engineer various tissues such as bone,3 blood,4 nerve,5 and tendon.6 However, it still has some disadvantages, particularly a lack of intrinsic bioactivity7 and antibacterial behavior.8 These disadvantages limit PLLA usage in many biomedical applications. Therefore, PLLA nanofibers are often modified by some functional nanomaterials.9–12Among diverse nanoparticles, graphene-based nanomaterials (GNs) such as graphene, graphene oxide (GO), or reduced graphene oxide (rGO) have aroused considerable interest due to their unique physicochemical and biological properties.13 Some studies investigated GN incorporation improve the mechanical, electrical and thermal conductivity, and bioactive properties of electrospun polymer nanofibers.14–18 Recently, GNs showed highly efficient antibacterial activity.19–22 Regarding the antimicrobial activity of GNs/polymer nanofibers, few polymers have been tested, including poly(vinylidene fluoride) (PVDF),23 polyacrylonitrile (PAN),24 silk,25 zein,26 poly(vinyl alcohol) (PVA),27 PVA/chitosan,28,29 gelatin,30 PCL/gelatin,31 and PLA.32 Additionally, GNs showed high drug loading capacity due to large surface area and diverse loading methods.33,34 Most importantly, electrospun GO/polymer nanofibers enable tailored drug release profiles.26,31,35 However, high GN concentrations in polymer nanofibers could be cytotoxic to cells and tissues.19 Recently, mussel-inspired dopamine (DA) has been used as a green reducing agent to improve GN biocompatibility.36 Nevertheless, nanofiber materials prepared with PLLA modified with dopamine-functionalized rGO and the associated drug release behavior have rarely reported antibacterial activity.
Herein, we have fabricated dopamine-functionalized reduced graphene oxide (rGO)/PLLA nanofibers for potential biomedical applications. The prepared nanofibrous membranes were then characterized by field emission scanning electron microscopy (FE-SEM), Fourier transform infrared spectroscopy (FT-IR), contact angle analysis, X-ray diffraction (XRD), differential scanning calorimetry (DSC) and mechanical property tests. The release characteristics of THC were measured using in vitro drug release tests. Antibacterial activity against Gram-negative E. coli and Gram-positive S. aureus was investigated. Finally, we investigated the in vitro cytotoxicity of prepared nanofibers against rat bone marrow mesenchymal stem cells (rMSCs).
2. Experimental section
2.1 Materials
Graphene oxide (GO) was obtained from Suzhou Carbon Graphene Technology Co., Ltd (Suzhou, China). Poly(L)-lactic acid (PLLA, Mv = 1 × 10⁵) was supplied by the Jinan Daigang Biomaterial Co., Ltd (Jinan, China). 2,2,2-Trifluoroethanol (TFE, purity ≥ 98%, Shanghai Darui Fine Chemicals, Shanghai, China) was used as the common solvent for dissolving PLLA and dispersing GO. Dopamine hydrochloride and tetracycline hydrochloride (purity >97%) were supplied by Bi De Pharmaceutical Technology Co., Ltd and Shanghai Titan Technology Co., Ltd (Shanghai, China), respectively. Tris–hydrochloric acid was purchased from Beijing Jingke Hongda Biotechnology Co., Ltd (Beijing, China). These materials and chemicals were used as received without further purification.2.2 Dopamine-reduced graphene oxide synthesis
Dopamine-rGO was prepared according to a previously reported synthesis method with minor modifications.37 Briefly, 50 mg dopamine hydrochloride (DA) and 100 mg GO were added into 200 mL Tris–Cl solution (10 mM, pH = 8.5) and sonicated (150 W) for 15 min in an ice bath. The reaction solution was mechanically stirred for 24 h at 60 °C, followed by 3× centrifugation (10![[thin space (1/6-em)]](https://www.rsc.org/images/entities/char_2009.gif) 000g) to remove excess polydopamine (PDA). Finally, the products were dried for 24 h at room temperature.
000g) to remove excess polydopamine (PDA). Finally, the products were dried for 24 h at room temperature.
2.3 rGO/PLLA composite nanofiber preparation
10% (w/v) PLLA was first dissolved in TFE. rGO (1 wt%) was then added and sonicated for 30 min to form a homogeneous solution. Then, electrospinning was performed using the following parameters: applied voltage 10–12 kV, tip-to-collector distance 10–15 cm, feed rate 1 mL h−1, relative humidity 40–60%, room temperature. Pure PLLA or GO/PLLA nanofibers were prepared using the same electrospinning parameters. To investigate the effect of GO and rGO on drug release from electrospun nanofibers, 30 mg mL−1 TC was added into PLLA, GO/PLLA, and rGO/PLLA solutions, which were then stirred for 1 h to produce a homogenous solution. The TC-loaded nanofibers were prepared by a method similar to unloaded drug nanofibers.2.4 Characterization
A field emission scanning electron microscope (FE-SEM, ZEISS Gemini SEM 300, Germany), operated at 8–10 kV accelerating voltage, was used to observe electrospun nanofiber morphology.A TENSOR 27 FT-IR spectrometer (Bruker, Germany) was used to obtain FT-IR spectra of the electrospun nanofibers over the range of 600–4000 cm−1 at a scanning resolution of 2 cm−1.
To examine the effect of rGO on the crystalline characteristics of electrospun nanofibers, XRD analysis was performed using a Rigaku D/max 2550 PC with Cu Kα radiation, operated at 40 kV, 300 mA, and a 5° (2θ) per min scanning rate.
DSC (204 F1, NetZSch, Germany) analysis was also performed to examine the crystalline structure of the electrospun nanofibers. 4 to 5 mg sample weights used for these experiments. The instrument was calibrated with an indium standard. A nitrogen atmosphere (flow rate = 50 mL min−1) was used throughout the scanning, which was conducted from 40 to 200 °C at a 10 °C per min heating rate. The degree of crystallinity (Cd) was obtained according to the equation of our previous study.38
Tensile properties of the electrospun nanofibrous mats were tested using a tabletop testing machine (ZQ-990LB, Zhichao Precision Instrument Co., Ltd China) equipped with a 500 N load cell. 50 mm (length) × 10 mm (wide) × 0.1–0.2 mm (thickness) rectangular-shaped specimens were stretched at a constant cross-head speed of 10 mm min−1 at room temperature. Typical tensile properties of strength, Young's modulus and strain-at-break were obtained from the tensile stress–strain curves.
2.5 Contact angle measurement
The wettability of the prepared nanofibrous mats was tested via a contact angle system with a video-enabled goniometer (VCA-optima, AST, Inc.). A drop of water (0.25 μL) was deposited on the surface of nanofibrous membrane and the water drop shape image was recorded after 2 s.2.6 In vitro drug release assay
To examine drug release behavior, three groups of TC-containing nanofibrous samples were placed into test tubes containing 3 mL phosphate buffer (pH 7.4) at 37 °C. The buffer solutions were replaced with fresh solution at predetermined time intervals. The amount of released TC was analyzed with a TU1810DPC UV-visible spectrophotometer at 326 nm and quantified using a previously-constructed calibration curve. The drug release studies were performed in triplicate for all groups.2.7 Antibacterial activity assay
2–3 single colonies were picked and mixed in LB liquid medium, and the suspension was prepared by shaking at 37 °C overnight. 80 μL E. coli or S. aureus were plated onto LB culture plates. The pot was sterilized in an autoclave at 121 °C for 15 min. The unloaded and loaded antibiotics of nanofibrous samples were UV sterilized for 1 h. Then, the samples were placed onto the culture plates and incubated at 37 °C in an inverted culture for 12 hours. After incubation, the inner and outer diameters of the inhibition zones were recorded. The inhibition zone diameter (outer diameter–inner diameter) was calculated. All experiments were performed in triplicate.2.8 Cytotoxicity assay
rMSCs were cultured in DMEM (Hyclone, USA) supplemented with 10% FBS (Zhejiang Tianhang Biotechnology Co. Ltd, China) and 1% penicillin/streptomycin (Tianjin Haoyang Biological Products Technology Co. Ltd, China) for 7 days (37 °C, 5% CO2). The medium was changed every 2 days. Then, the cells were isolated by 0.125% trypsin–EDTA solution (Tianjin Haoyang Biological Products Technology Co. Ltd, China) and counted with a hemocytometer and an optical microscope. Nanofibrous mats were cut up, placed in 24-well plates, and UV-sterilized for 1 h. The treated membranes were immersed into 75% ethanol (Sinopharm Chemical Reagent Co. Ltd, China) for 4 h and washed three times with PBS (Senbeijia Biotechnology Co. Ltd, China). Next, the membranes were treated with serum-containing medium at 37 °C for 12 h. Cells were seeded onto each TC-containing fibrous membrane at a density 1 × 10⁴ cells per well and cultured in incubator. Cell viability was tested by MTT assays (Beyotime Biotechnology Co. Ltd, China). To observe cell morphology, the cells were immunofluorescently labeled. Briefly, all samples were fixed in 4% paraformaldehyde (Sinopharm Chemical Reagent Co. Ltd, China) for 30 min and rinsed three times with PBS (5 minutes each time). Then, cells were permeabilized by 0.1% Triton X-100 (Aladdin, China) in PBS for 20 min, washed three times with PBS (5 min each), and incubated in 10% goat serum (Beyotime Biotechnology Co. Ltd, China) in PBS for 30 min to reduce non-specific background staining. The cells were labeled with phalloidin (Beyotime Biotechnology Co. Ltd, China) for 20 minutes, washed three times with PBS, and labeled with 4,6-diamidino-2-phenylindole (DAPI) (Beyotime Biotechnology Co. Ltd, China) for 10 minutes. The mounted samples were observed with an inverse fluorescent microscope.2.9 Statistical analysis
All values were exhibited as the mean ± standard error of at least three samples. Statistical analysis was performed using one-way ANOVA analysis with Tukey's test included in Origin 8.0 software. P < 0.05 was considered statistically significant.3. Results and discussion
3.1 Fabrication and characterization of rGO/PLLA nanofibers
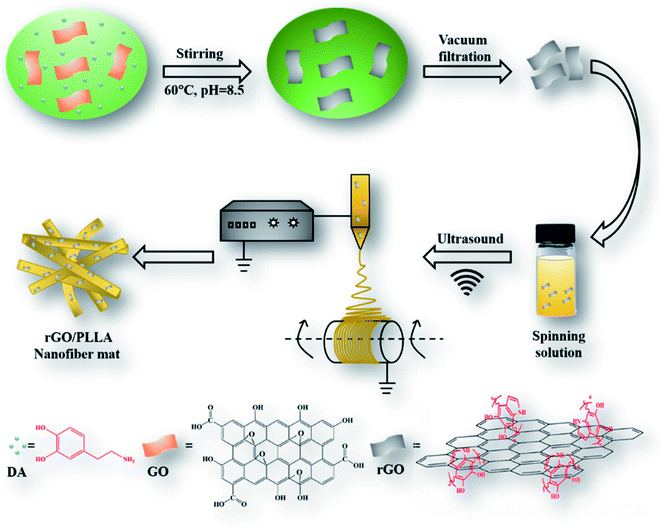
The schematic illustration depicting the preparation of rGO/PLLA nanofibers is shown in Fig. 1. The fabrication process was divided into two steps: (1) dopamine-reduced GO; and (2) electrospinning rGO/PLLA nanofibers. Fig. 2A shows a typical FE-SEM image of GO, where GO possesses a relatively rough surface. For rGO, the surface became smoother (Fig. 2B). In addition, EDX was used to confirm that the GO was further reduced by PDA. Clearly, elemental nitrogen, a critical component of PDA, is almost invisible in GO (Fig. 2C), while it appeared and homogeneously distributed across the rGO surface, indicating that dopamine hydrochloride produces a uniform PDA coating on the rGO surface during self-polymerization (Fig. 2D). The GO and rGO FT-IR spectra are shown in Fig. 2E. Characteristic GO peaks are displayed at 1712 cm−1 (C![[double bond, length as m-dash]](https://www.rsc.org/images/entities/char_e001.gif) O stretching vibration), 1396 cm−1 (O–H bending vibration), 1041 cm−1 (C–O stretching vibration) and 3237 cm−1 (O–H stretching vibration), which revealed numerous oxygen-containing functional groups on the GO surface. In the FT-IR spectra for rGO, a new peak appears at 3573 cm−1 representing N–H stretching vibration in the PDA amino group, suggesting the presence of PDA on the rGO surface. Moreover, the characteristic peak intensities of C
O stretching vibration), 1396 cm−1 (O–H bending vibration), 1041 cm−1 (C–O stretching vibration) and 3237 cm−1 (O–H stretching vibration), which revealed numerous oxygen-containing functional groups on the GO surface. In the FT-IR spectra for rGO, a new peak appears at 3573 cm−1 representing N–H stretching vibration in the PDA amino group, suggesting the presence of PDA on the rGO surface. Moreover, the characteristic peak intensities of C![[double bond, length as m-dash]](https://www.rsc.org/images/entities/char_e001.gif) O and C–O decreased, demonstrating that GO was successfully reduced by PDA.37
O and C–O decreased, demonstrating that GO was successfully reduced by PDA.37
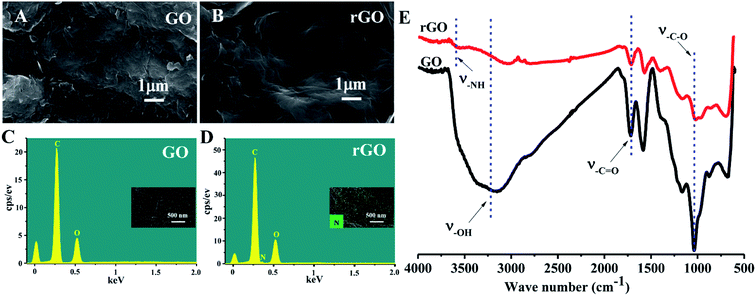 | ||
| Fig. 2 FE-SEM images of (A) GO and (B) rGO; EDX analysis of (C) GO and (D) rGO; FT-IR spectra of GO and rGO (E). | ||
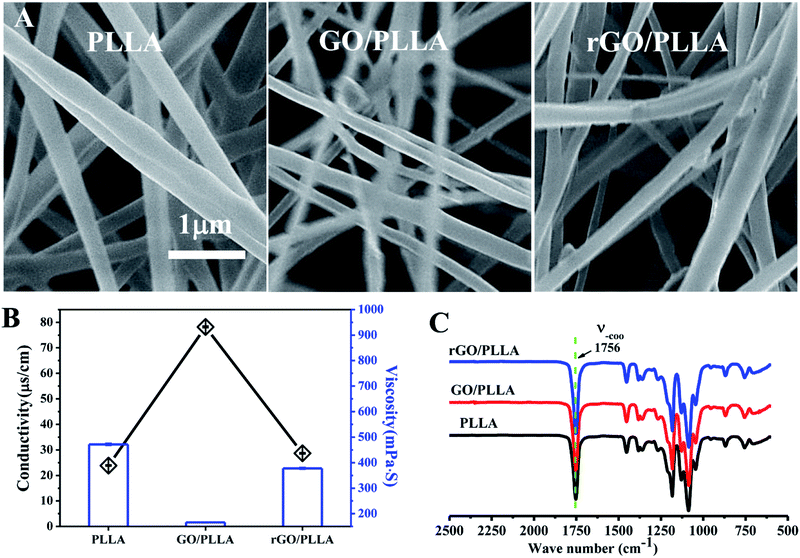
The nanofiber surface morphology was examined by FE-SEM (Fig. 3A). The surface of the electrospun fibers was bead-free, with randomly-oriented fibers and an interconnected porous structure. The diameter of PLLA nanofibers is 438 ± 132 nm, which is larger than GO/PLLA (300 ± 75 nm) and rGO/PLLA (402 ± 95 nm). This may be caused by increased conductivity and decreased viscosity of the electrospun solution (Fig. 3B).39 The FT-IR spectra of PLLA, GO/PLLA, and rGO/PLLA are shown in Fig. 3C. There are no obvious differences among these groups, which may be due to the relatively low GO and rGO content, indicating that GO and rGO are uniformly dispersed in PLLA nanofibers.
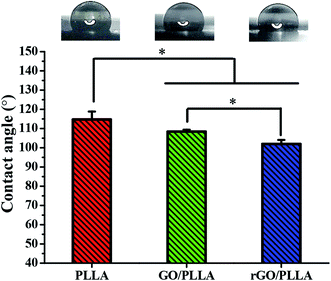
The wettability of the nanofibrous scaffold is a favorable factor for cell attachment and proliferation.26 Therefore, the contact angles of water on PLLA, GO/PLLA, and rGO/PLLA nanofibrous membranes were investigated. As shown in Fig. 4, the contact angle of PLLA nanofibrous membranes was 114.7 ± 4.1°, which decreased when GO was blended to 108.4 ± 1.0°. The existence of abundant oxygen-containing hydrophilic groups on the GO surface40 likely caused the decreased wetting angle, similar to previous study results.26,31,35 When rGO was incorporated, the contact angle further decreased to 102 ± 2.1°, probably due to the hydrophilic nature of dopamine.41 Further, increased nanofiber hydrophilicity will be beneficial for cell adhesion.26 Therefore, blending rGO could improve the hydrophilicity of electrospun PLLA nanofibers.
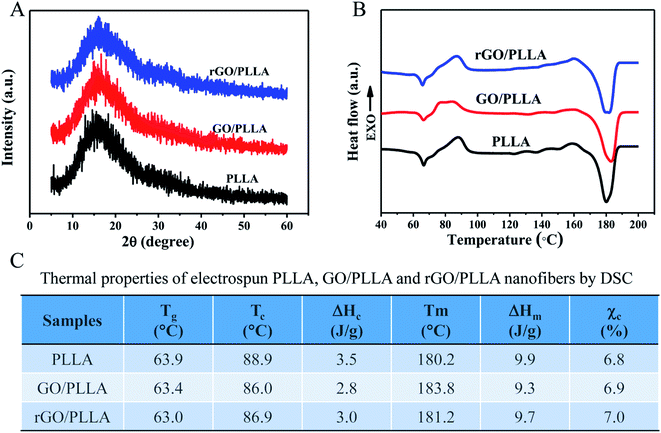
The crystallinity of the electrospun PLLA, GO/PLLA and rGO/PLLA nanofibers was investigated by XRD. The characteristic diffraction peaks of these nanofibers all appeared at 2θ = 15° (Fig. 5A), which is assigned to α-form PLLA crystals.38 Although the identified diffraction peaks were not sharp, they became stronger when GO or rGO were added, reflecting higher crystallinity.42 Fig. 5B shows the DSC thermograms of PLLA, GO/PLLA, and rGO/PLLA nanofibrous membranes. The glass transition temperature (Tg) of PLLA, GO/PLLA and rGO/PLLA decreased from 63.9 °C to 63.0 °C because the thermal vibration of PLLA molecular segments is less restricted after the incorporation of GO (or rGO). A shift in the cold crystallization peak (Tc) from 88.9 to 86.0 °C was also observed, caused by the formation of hydrogen bonds between GO (or rGO) and PLLA molecules, resulting in PLLA nucleation and crystallization.43 The melting temperatures (Tm) were about 180 °C, which suggests the formation of α-form PLLA crystals.38 Moreover, the addition of GO or rGO increases the Tm of PLLA. The crystallinity of the composite fibers slightly increased after the addition of GO (or rGO) (Fig. 5C). These findings indicate that rGO incorporation affects polymer crystallinity, thereby affecting the mechanical properties.
The tensile properties of electrospun PLLA, GO/PLLA, and rGO/PLLA nanofibers are presented in Fig. 6. The mechanical performance of PLLA nanofibers was influenced by blending GO or rGO (Fig. 6A). As shown in Fig. 6B, the Young's modulus of GO/PLLA and rGO/PLLA nanofibers were increased by 18.7% and 29.3%, respectively, compared to PLLA nanofibers. Further, the tensile strengths of GO/PLLA and rGO/PLLA nanofibers increased by 6.0% and 19.9%, respectively, compared to PLLA nanofibers (Fig. 6C). Additionally, the elongation properties of the GO/PLLA nanofibers decreased by approximately 5.6% (Fig. 6D). These improvements can be attributed to enhanced mechanical properties and the uniform dispersion of GO or rGO nanosheets. The abundant oxygen-containing GO functional groups and highly adherent PDA on the rGO surface contribute to strong filler/matrix adhesion. This leads to efficient load transfer at the GO or rGO/PLLA interface, successively enhancing the tensile strength and Young's modulus of the PLLA nanofibers.44 Based on these results, rGO/PLLA nanofibers have appropriate mechanical properties to be considered as a candidate tissue engineering scaffold.
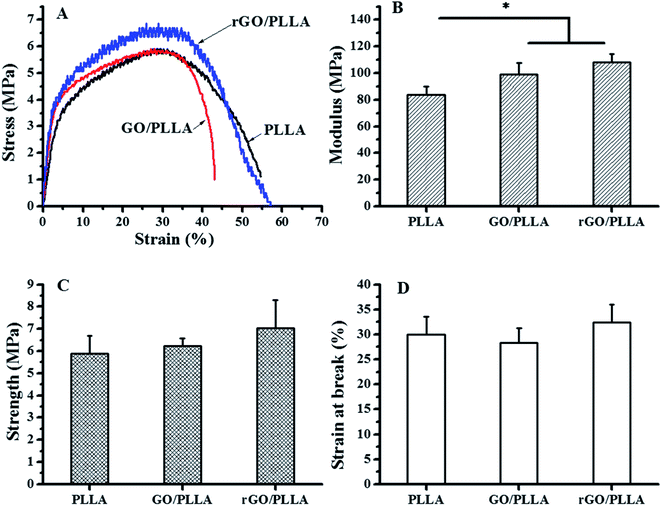 | ||
| Fig. 6 Mechanical properties of PLLA, GO/PLLA, and rGO/PLLA nanofiber membranes: (A) typical stress–strain curves, (B) modulus; (C) tensile strength; and (D) strain at break (*p < 0.05). | ||
3.2 Drug release from TC/rGO/PLLA nanofibers
FE-SEM images of tetracycline hydrochloride (TC)-loaded nanofibrous membranes are shown in Fig. 7A. The TC-loaded nanofibers showed similar characteristics to unloaded drug nanofibers. However, the diameters of TC/PLLA (684 ± 176 nm), TC/GO/PLLA (486 ± 96 nm), and TC/rGO/PLLA (471 ± 103 nm) nanofibers were higher than unloaded nanofibers, which may be due to increased electrospinning solution viscosity from loading water-soluble TC.35 Fig. 7B displays the FT-IR spectra of TC powder and TC-loaded nanofibers. In the TC powder FT-IR spectra, peaks appear at 3365 cm−1 (N–H stretching vibration), 3303 cm−1 (–OH stretching vibration), 1674 cm−1 (C![[double bond, length as m-dash]](https://www.rsc.org/images/entities/char_e001.gif) O stretching vibration), 1613 cm−1, and 1575 cm−1 (N–H bending vibration).45 These characteristic TC peaks are also present in FT-IR spectra of TC-loaded nanofibers, which indicates that TC was successfully loaded onto the composite nanofibers.
O stretching vibration), 1613 cm−1, and 1575 cm−1 (N–H bending vibration).45 These characteristic TC peaks are also present in FT-IR spectra of TC-loaded nanofibers, which indicates that TC was successfully loaded onto the composite nanofibers.
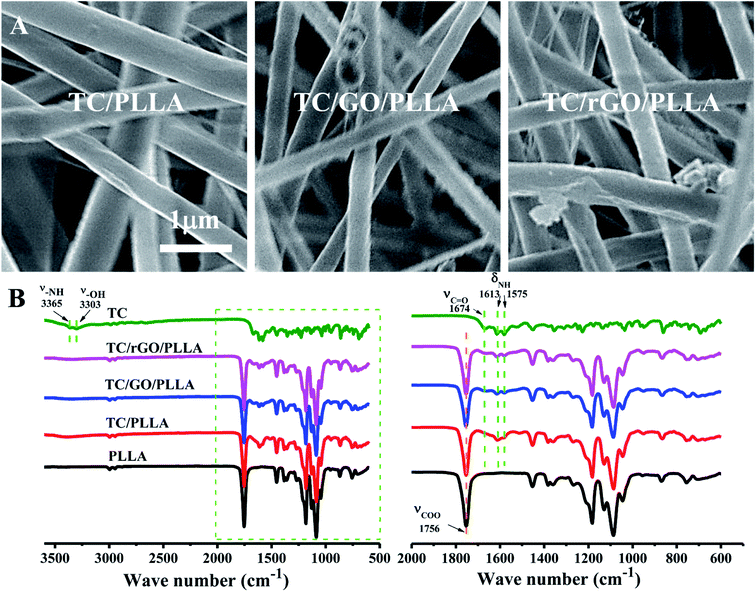 | ||
| Fig. 7 (A) FE-SEM images of electrospun TC-loaded nanofibers: TC/PLLA, TC/GO/PLLA, and TC/rGO/PLLA; (B) FT-IR spectra of TC powder, electrospun PLLA, TC/PLLA, TC/GO/PLLA, and TC/rGO/PLLA nanofibers. | ||
The drug release behavior of electrospun nanofibers is critical to investigate their drug delivery mechanism.31 Fig. 8 shows the in vitro cumulative drug release curves of TC/PLLA, TC/GO/PLLA, and TC/rGO/PLLA nanofibrous mats. Similar drug release behavior was observed between TC/PLLA and TC/GO/PLLA nanofibers. TC release from TC/rGO/PLLA nanofibers was significantly slower than from TC/PLLA and TC/GO/PLLA nanofibers. In the TC/PLLA and TC/GO/PLLA nanofibers, initial burst release ratios of 40.8% and 39.9% occurred within the first 7 h, respectively. The burst effect in TC/rGO/PLLA was mild, with a 29.9% initial burst release ratio within first 7 h. This ratio decreased by 26.7% compared to TC/PLLA. Subsequently, the release plateaus were reached after 72 h, with controlled drug release ratios up to 56.6%, 55.2%, and 39.3% for TC/PLLA, TC/GO/PLLA and TC/rGO/PLLA nanofibers, respectively. TC/rGO/PLLA nanofibers exhibited the lowest drug release properties, which is different from previous studies.26,35 This difference is likely caused by the hydrophobic nature of PLLA acting on hydrophilic TC. The large hydrophilicity of the nanofibers brings about a smaller initial drug release burst.31 Thus, the controlled release from TC/rGO/PLLA nanofibers could be caused by high hydrophilicity, according to Fig. 4. The strong PDA adhesion used to link rGO and TC must first release TC from the rGO surface to the PLLA nanofibrous matrix, followed by detached drug diffusion through the PLLA nanofibrous matrix to the releasing medium. Therefore, TC/rGO/PLLA nanofibers achieved a more controlled and prolonged release profile.
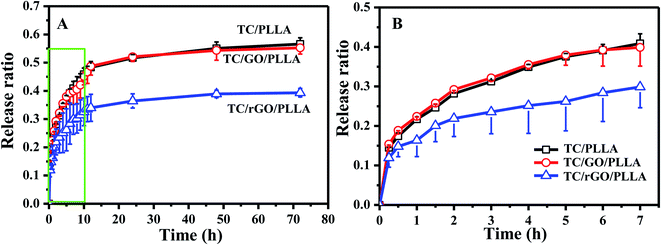 | ||
| Fig. 8 (A) In vitro drug release curves of drug-loaded nanofibrous membranes: TC/PLLA, TC/GO/PLLA, and TC/rGO/PLLA; (B) magnified view of the green box from panel (A). | ||
3.3 Antibacterial activity
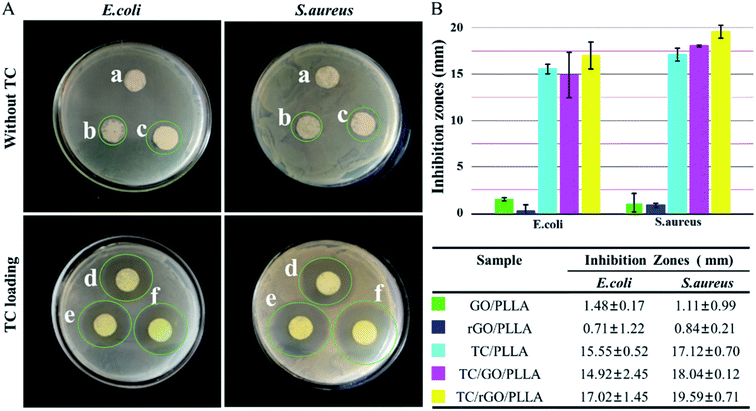
The antibacterial efficacy of PLLA, GO/PLLA, and rGO/PLLA nanofibrous membrane with and without TC was evaluated against Escherichia coli (E. coli) and Staphylococcus aureus (S. aureus) via inhibition zone assays (Fig. 9). The PLLA nanofibers showed no bactericidal activity. In contrast, there were a few inhibition zones around the GO/PLLA and rGO/PLLA nanofiber membranes. The reason for the growth inhibiting effect of GO/PLLA and rGO/PLLA nanofibers is because direct contact between the bacterial membranes and the sharp edges of GO or rGO create intensive membrane stress, which induces physical damage on microorganism membranes. Similar results were also reported in other studies.24,46 Compared with GO/PLLA, the weak antibacterial activity of rGO/PLLA may be due to the consumption of carboxyl groups on GO nanosheets reacting with amino groups on dopamine chains. Previous studies demonstrated that graphene oxide (GO) shows the strongest antibacterial activity among GNs at the same concentration.19 TC, a wide-spectrum antibiotic, inhibits both Gram-negative and Gram-positive bacteria growth.26 When TC was loaded into the nanofibers, the nanofibrous mats displayed the enhanced antibacterial activity. Indeed, the TC/rGO/PLLA nanofibrous mats showed the highest bacterial inhibition. The controlled release of TC from TC/rGO/PLLA nanofibers into the culture plate led enhanced inhibitory properties over an extended time.3.4 In vitro cytotoxicity
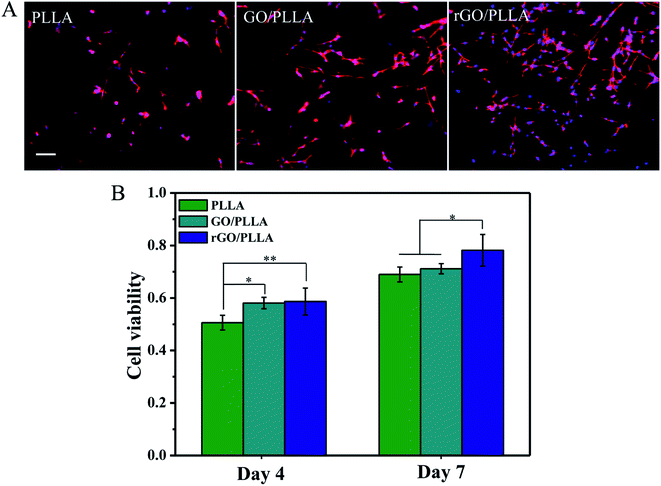
Fig. 10A shows immunofluorescence images of the morphology of rMSCs attached to PLLA, GO/PLLA, and rGO/PLLA nanofibers after 1 day of culture. rGO/PLLA nanofibrous mats exhibited the highest cell attachment and distribution compared to GO/PLLA and PLLA nanofibers. This which may be caused by the existence of rGO nanosheets in composite nanofibers, which provide a larger surface area for cell attachment. Moreover, PDA adhesion on the rGO surface improves cell–material interactions and promotes cell attachment and spreading. rMSC viability and proliferation on various nanofibers were investigated by MTT assays. The quantity of rMSCs on all nanofiber scaffolds increased over 7 days of culture (Fig. 10B), but the rGO/PLLA nanofibrous mats were the most favorable for cell growth and proliferation. This might be attributed to the PDA present on the rGO surface, which can improve cell proliferation and metabolic cell activity.4. Conclusions
In this study, continuous and uniform rGO/PLLA nanofibers were successfully prepared by electrospinning. The addition of rGO enhanced the PLLA nanofiber mechanical properties and hydrophilicity. Loading of TC into rGO/PLLA nanofibers improved drug release performance by providing a more controlled drug release. Incorporation of rGO caused antibacterial activity, which was further enhanced when loaded with TC. Furthermore, the rGO/PLLA nanofibers did not exhibit cytotoxicity. rGO/PLLA nanofibers supported cell adhesion and proliferation. These results suggest that rGO/PLLA nanofibers have excellent physicochemical properties and biocompatibility, and may be useful in biomedical applications.Conflicts of interest
There are no conflicts to declare.Acknowledgements
This work was supported by the National Natural Science Foundation of China (81801856), the Natural Science Foundation of Jiangsu Province (BK20180949), Six Talent Peaks Project in Jiangsu Province (XCL-063), Nantong Applied Basic Research Program (JC2019047, MS12017023-2), High Level Introduction of Talent Research Start-up Foundation of Nantong University (03081136, 03081135) and Large Instruments Open Foundation of Nantong University. We also would like to thank Analysis and Test Center of Nantong University for the testing support.Notes and references
- Z. M. Huang, Y. Z. Zhang, M. Kotaki and S. Ramakrishna, Compos. Sci. Technol., 2003, 63, 2223–2253 CrossRef CAS
.
- B. Tyler, D. Gullotti, A. Mangraviti, T. Utsuki and H. Brem, Adv. Drug Delivery Rev., 2016, 107, 163–175 CrossRef CAS PubMed
.
- H. Yuan, Y. Zhou, M. S. Lee, Y. Zhang and W. J. Li, Acta Biomater., 2016, 42, 247–257 CrossRef CAS PubMed
.
- Q. Zhou, J. Xie, M. Bao, H. Yuan, Z. Ye, X. Lou and Y. Zhang, J. Mater. Chem. B, 2015, 3, 4439–4450 RSC
.
- F. Yang, R. Murugan, S. Wang and S. Ramakrishna, Biomaterials, 2005, 26, 2603–2610 CrossRef CAS PubMed
.
- Z. Yin, X. Chen, J. L. Chen, W. L. Shen, T. M. Hieu Nguyen, L. Gao and H. W. Ouyang, Biomaterials, 2010, 31, 2163–2175 CrossRef CAS PubMed
.
- H. Yuan, J. Qin, J. Xie, B. Li, Z. Yu, Z. Peng, B. Yi, X. Lou, X. Lu and Y. Zhang, Nanoscale, 2016, 8, 16307–16322 RSC
.
- T. T. T. Nguyen, O. H. Chung and J. S. Park, Carbohydr. Polym., 2011, 86, 1799–1806 CrossRef CAS
.
- S. Liu, S. Liu, X. Liu, J. Zhao, W. Cui and C. Fan, Appl. Polym. Sci., 2013, 129, 3459–3465 CrossRef CAS
.
- S. Liu, J. Zhao, H. Ruan, W. Wang, T. Wu, W. Cui and C. Fan, Mater. Sci. Eng., C, 2013, 33, 1176–1182 CrossRef CAS PubMed
.
- H. Wang, X. Ma, Y. Li, S. Jiang, L. Zhai, S. Jiang and X. Li, Int. J. Biol. Macromol., 2013, 62, 494–499 CrossRef CAS PubMed
.
- X. Zhang, R. Guo, J. Xu, Y. Lan, Y. Jiao, C. Zhou and Y. Zhao, J. Biomater. Appl., 2015, 30, 512–525 CrossRef CAS PubMed
.
- A. K. Geim and K. S. Novoselov, The rise of graphene, Nat. Mater., 2007, 6, 183–191 CrossRef CAS PubMed
.
- S. Das, A. S. Wajid, S. K. Bhattacharia, M. D. Wilting, I. V. Rivero and M. J. Green, J. Appl. Polym. Sci., 2013, 128, 4040–4046 CrossRef CAS
.
- S. Ramazani and M. Karimi, Mater. Sci. Eng., C, 2015, 56, 325–334 CrossRef CAS PubMed
.
- O. Shueibi, Z. Zhou, X. Wang, B. Yi, X. He and Y. Zhang, Biomedical Physics & Engineering Express, 2019, 5, 025002 Search PubMed
.
- Y. Luo, H. Shen, Y. Fang, Y. Cao, J. Huang, M. Zhang, J. Dai, X. Shi and Z. Zhang, ACS Appl. Mater. Interfaces, 2015, 7, 6331–6339 CrossRef CAS PubMed
.
- E. J. Lee, J. H. Lee, Y. C. Shin, D. G. Hwang, J. S. Kim, O. S. Jin, L. Jin, S. W. Hong and D. W. Han, Biomater. Res., 2014, 18, 8–24 CrossRef PubMed
.
- W. Hu, C. Peng, W. Luo, M. Lv, X. Li, D. Li, Q. Huang and C. Fan, ACS Nano, 2010, 4, 4317–4323 CrossRef CAS PubMed
.
- M. Zhao, T. Shan, Q. Wu and L. Gu, J. Nanosci. Nanotechnol., 2020, 20, 2095–2103 CrossRef CAS PubMed
.
- J. Z. Ma, J. Zhang, Z. Xiong, Y. Yong and X. S. Zhao, J. Mater. Chem., 2011, 21, 3350–3352 RSC
.
- O. Akhavan and E. Ghaderi, ACS Nano, 2010, 4, 5731–5736 CrossRef CAS PubMed
.
- B. Hong, H. Jung and H. Byun, J. Nanosci. Nanotechnol., 2013, 13, 6269–6274 CrossRef CAS PubMed
.
- J. H. Li, H. Zhang, W. Zhang and W. Liu, J. Biomater. Sci., Polym. Ed., 2019, 30, 1620–1635 CrossRef CAS PubMed
.
- S. D. Wang, Q. Ma, K. Wang and H. W. Chen, ACS Omega, 2018, 3, 406–413 CrossRef CAS PubMed
.
- H. Asadi, A. Ghaee, J. Nourmohammadi and A. Mashak, Int. J. Polym. Mater. Polym. Biomater., 2020, 69, 173–185 CrossRef CAS
.
- X. Hu, N. Ren, Y. Chao, H. Lan, X. Yan, Y. Sha, X. Sha and Y. Bai, Composites, Part A, 2017, 102, 297–304 CrossRef CAS
.
- Y. Liu, M. Park, H. Shin, B. Pant, J. Choi, Y. W. Park, J. Y. Lee, S. J. Park and H. Y. Kim, J. Ind. Eng. Chem., 2014, 20, 4415–4420 CrossRef CAS
.
- S. Yang, P. Lei, Y. Shan and D. Zhang, Appl. Surf. Sci., 2018, 435, 832–840 CrossRef CAS
.
- K. Jalaja, V. S. Sreehari, P. R. A. Kumar and R. J. Nirmala, Mater. Sci. Eng., C, 2016, 64, 11–19 CrossRef CAS PubMed
.
- M. Heidari, S. H. Bahrami, M. Ranjbar-Mohammadi and P. B. Milan, Mater. Sci. Eng., C, 2019, 103, 109768 CrossRef CAS PubMed
.
- Q. Zhang, Q. Tu, M. E. Hickey, J. Xiao, B. Gao, C. Tian, P. Heng, Y. Jiao, T. Peng and J. Wang, Colloids Surf., B, 2018, 172, 496–505 CrossRef CAS PubMed
.
- S. Goenka, V. Sant and S. Sant, J. Controlled Release, 2014, 173, 75–88 CrossRef CAS PubMed
.
- J. Liu, L. Cui and D. Losic, Acta Biomater., 2013, 9, 9243–9257 CrossRef CAS PubMed
.
- S. Yang, X. Zhang and D. Zhang, Int. J. Mol. Sci., 2019, 20, E4395 CrossRef PubMed
.
- C. Cheng, S. Nie, S. Li, H. Peng, H. Yang, L. Ma, S. Sun and C. Zhao, J. Mater. Chem. B, 2013, 1, 265–275 RSC
.
- X. Q. Qiu, C. K. Kundu, Z. Li, X. Li and Z. Zhang, J. Mater. Sci., 2019, 54, 13848–13862 CrossRef CAS
.
- Q. Zhou, M. Bao, H. Yuan, S. Zhao, W. Dong and Y. Zhang, Polymer, 2013, 54, 6867–6876 CrossRef CAS
.
- B. Y. Li, H. H. Yuan and Y. Z. Zhang, Compos. Sci. Technol., 2013, 89, 134–141 CrossRef CAS
.
- Z. L. Zhang and R. D. Yang, Fibers Polym., 2017, 18, 334–341 CrossRef CAS
.
- L. J. Zhu, Y. Lu, Y. Wang, L. Zhang and W. Wang, Appl. Surf. Sci., 2012, 258, 5387–5393 CrossRef CAS
.
- X. Zhao, Q. Zhang, D. Chen and P. Lu, Macromolecules, 2010, 43, 2357–2363 CrossRef CAS
.
- Z. B. Qiu and W. Guan, RSC Adv., 2014, 4, 9463–9470 RSC
.
- X. Zhao, Q. Zhang, D. Chen and P. Lu, Macromolecules, 2011, 44, 2392 CrossRef CAS
.
- S. D. Taherzade, J. Soleimannejad and A. Tarlani, Nanomaterials, 2017, 7, E215 CrossRef PubMed
.
- Q. Bao, D. Zhang and P. Qi, J. Colloid Interface Sci., 2011, 360, 463–470 CrossRef CAS PubMed
.
Footnote |
| † These authors contributed equally. |
| This journal is © The Royal Society of Chemistry 2020 |

