 Open Access Article
Promoting the photocatalytic activity of Bi4Ti3O12 microspheres by incorporating iron†
Zhendong Liua and
Zhen Ma *ab
*ab
aShanghai Key Laboratory of Atmospheric Particle Pollution and Prevention (LAP3), Department of Environmental Science and Engineering, Fudan University, Shanghai, 200433, P. R. China
bShanghai Institute of Pollution Control and Ecological Security, Shanghai 200092, P. R. China. E-mail: zhenma@fudan.edu.cn
First published on 20th May 2020
Abstract
Small amounts of Fe(NO3)3 were added to the synthesis mixture prior to the hydrothermal synthesis of Bi4Ti3O12 microspheres. The physicochemical properties of the resulting materials were changed accordingly. The photocatalytic activities of several samples were studied through the photocatalytic degradation of organic pollutants. The samples with a theoretical Fe atomic percentage of 5.9% showed the highest photocatalytic activity among these samples. The main active species in photocatalytic degradation was demonstrated by radical capturing experiments as h+. The introduction of a suitable amount of Fe to the photocatalyst can facilitate the separation of electron–hole pairs generated upon light irradiation, inhibit their recombination efficiently, and prominently expand the light absorption region, thus leading to higher photocatalytic activity.
Introduction
Heterogeneous catalysis plays a crucial role in chemical synthesis, environmental remediation, and energy conversion. In recent years, semiconductor photocatalysis, a branch of the heterogeneous catalysis field, has drawn much attention because it is energy-saving, i.e., it relies on light but not heat.1–3 TiO2 is a traditional and popular photocatalyst that can work effectively under UV light, but TiO2 cannot make use of the visible-light portion of sunlight reaching the Earth.4,5 Attempts have been made to develop Ti-containing composite-oxide photocatalysts such as CaTiO3,6–8 SrTiO3,9–11 BaTiO3,12–14 CoTiO3,15–17 NiTiO3,18–20 and Bi4Ti3O12.21–29 The development of these photocatalysts increases the diversity of Ti-based photocatalysts and often leads to higher photocatalytic activities.Bi4Ti3O12, as a Ti-containing composite oxide, has attracted considerable interest in ferroelectric,30 ceramic,31 and photocatalysis fields.21–29 Bi4Ti3O12 is constituted by (Bi2O2)2+ layers and (Bi2Ti3O10)2− layers.32 In the (Bi2Ti3O10)2− layers, Bi is surrounded by 12 O atoms to form a BiO12 tetrakaidecahedron, and Ti is surround by 6 O atoms to form a TiO6 octahedron (Fig. S1†).21 The layered crystal structure can facilitate the separation of photogenerated charges.22 Bi4Ti3O12 photocatalysts with different morphologies (such as spheres,21,29 sheets,22 rods,23 particles,24 and mesoporous materials25) have been prepared. For example, Yao et al.21 prepared spherical Bi4Ti3O12 particles by a chemical solution decomposition method, and 10 ppm methyl orange solution was degraded almost completely after 5 hours under UV-light irradiation, with the aid of this catalyst. He et al.22 obtained Bi4Ti3O12 nanosheets with dominant {001} facets, and the sample showed enhanced photocatalytic activity, under visible-light irradiation, in the degradation of rhodamine B.
However, Bi4Ti3O12 has a large band gap and it can only absorb a small fraction of sunlight.22 It is desirable to broaden its light absorption range and further improve the photocatalytic activity. One way is to combine Bi4Ti3O12 with light-absorbing materials, such as BiOI,33 Bi2O3,34 CuFe2O4,35 C,36 Ag,37 Ag3PO4,38 Ag2O,39 g-C3N4,40 Bi2S3,41 Au,42 Ag2S,43 and CuS.44 However, the construction of heterojunctions (composite materials) often involves multiple synthesis steps.
Alternatively, an element such as Zn,45 V,32 Cr,46 La,47 and S48 can be incorporated during the synthesis of Bi4Ti3O12. Fe, being a transition metal with multiple valence states, has been used for the preparation of Fe–TiO2,49 Fe–ZnO,50 Fe–BiOCl,51 Fe–WO3,52 Fe–SrTiO3,53 Fe–BiVO4,54 and Fe–C3N4.55 The addition of Fe can reduce the band gap of photocatalysts, thus leading to higher photocatalytic activity. A few reports have investigated the effect of the incorporation of Fe on the structure and ferroelectric properties of Bi4Ti3O12,56–61 but the effect on photocatalytic properties has been rarely studied.62 Liu et al.62 synthesized Fe-doped Bi4Ti3O12 nanosheets exposing {001} facets by a one-step molten salt method and found that 2% Fe-doped Bi4Ti3O12 exhibited superior photocatalytic activity in the degradation of phenol and bisphenol. However, the incorporation of a small amount of Fe cannot significantly change the light absorption range of the sample,62 and the effect of adding larger amounts of Fe on the physicochemical and photocatalytic properties of Bi4Ti3O12 was not reported.
Considering that adding a heteroatom may be an efficient way to develop better photocatalysts,63–65 here we added gradient amounts of Fe(NO3)3 in the synthesis mixture prior to the hydrothermal synthesis of Bi4Ti3O12. The effects of Fe content on the crystal phase, elemental composition, morphology, and light absorption property were investigated by various characterization methods. The photocatalytic activities were also measured by degradation of organic pollutions. A possible reason for the improved photocatalytic performance was discussed.
Experimental section
Preparation of samples
All chemical reagents were of analytical reagent (AR) grade. First, 7.2 g NaOH was dissolved in 60 mL deionized water placed in a 100 mL Teflon vessel to be placed in an autoclave. After the NaOH solution was stirred continuously for 30 min, 2.4 mmol Ti(OBu)4, 3.2 mmol Bi(NO3)3·5H2O, and an appropriate amount of Fe(NO3)3·9H2O (0, 0.64, 0.96, or 1.6 mmol) were added into the NaOH solution. After further stirring the mixture for 30 min, the Teflon vessel was placed in an autoclave, and the autoclave was thus sealed, put in an oven, and heated at 180 °C for 24 h. After the system was cooled down to room temperature naturally, the solid products were collected by centrifugation, washed with distilled water three times, and then washed with ethanol three times. The obtained samples prepared with the addition of 0, 0.64, 0.96, and 1.6 mmol Fe(NO3)3·9H2O were denoted as Bi4Ti3O12, S1, S2, and S3, respectively.Characterization
X-ray diffraction (XRD) experiments for determining the crystal structures of the samples were carried out on a D8 ADVANCE X-ray diffractometer. SEM images for characterizing the morphologies of the samples were observed by an FESEM-4800 field emission scanning electron microscope. TEM experiments for getting a closer picture of the morphology and structure of a representative catalyst were conducted using a JEM-2100F transmission electron microscope. Nitrogen adsorption–desorption data of the samples were obtained on a TriStar II 3020 surface area and pore size distribution analyzer. X-ray photoelectron spectroscopy (XPS) experiments for determining the oxidation states and compositions of surface elements were performed on an ESCALAB-250 instrument. UV-vis diffuse reflectance spectra for charactering the light-absorption properties were obtained on a UV-2550 spectrophotometer. The electrochemical impedance spectroscopy (EIS) and transient photocurrent response data of the samples were obtained on a PARSTAT 2273 electrochemical workstation. Photoluminescence spectra (PL) were recorded with an FLS1000 steady-state fluorescence spectrometer with excitation at 300 nm.Performance in photocatalysis
The photodegradation of methylene blue (MB) and ciprofloxacin hydrochloride (CIP) were conducted in a dark box (Fig. S2†).66–70 Cooling water and an air-conditioning system were used to keep the temperature of the reaction system to be 25 °C. The light was generated by a 300 W Xe lamp. Most experiments were conducted under this Xe lamp light unless otherwise specified. In the latter case, a UV-cutoff filter (420 nm) was supplemented to simulate visible-light irradiation. In a typical photocatalytic experiment, a pollutant solution (50 mL) and a photocatalyst (20 mg) were put into a beaker (100 mL). The distance between the Xe lamp and the top of beaker was fixed to be 15 cm. The suspension was magnetically stirred in the dark for 20 min and then the Xe lamp was then turned on. 4 mL slurry was sampled at certain times, and the supernatant, obtained by centrifugation, was analyzed by a UV-vis spectrometer. The photodegradation rate was calculated based on the absorption intensity of the maximum characteristic peak.To carry out the experiments involving trapping active species, 1 mmol potassium iodate (KIO3), benzoquinone (BQ), ammonium oxalate (AO), or isopropanol (IPA) was added into the pollutant solution before the dark adsorption process.
Results and discussion
Basic characterization results
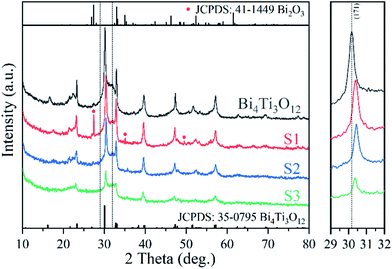
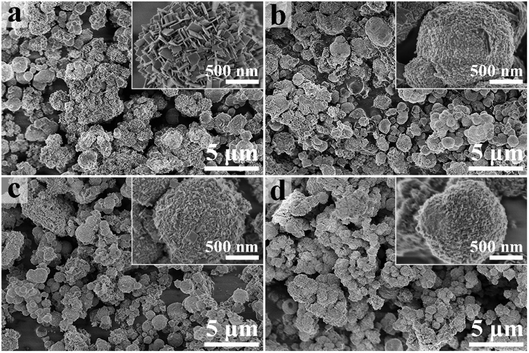
Fig. 1 shows the XRD patterns of relevant samples. Bi4Ti3O12 can be indexed to orthorhombic Bi4Ti3O12 (JCPDS: 35-0795).28 S1 mainly contains a phase similar to orthorhombic Bi4Ti3O12, together with a minor impurity phase of monoclinic Bi2O3 (JCPDS: 41-1449, Fig. S3†).71 No obvious impurity phase exists in S2 and S3 when more Fe is added in the synthesis mixture, but the crystals seem to be smaller because the peaks are broader. The polyhedral configuration of Fe–O is octahedron which is similar to TiO6 octahedron.72,73 Therefore, although the doped Fe is in a +3 valence state which is the same as Bi3+, Fe3+ will substitute the Ti4+ in the (Bi2Ti3O10)2− layers. The results were also confirmed by previous reports.57 The (171) peak shifts to higher diffraction angle with Fe doping, proving the decrease in the lattice constant of Bi4Ti3O12, which may due to the radius of Fe is smaller than that of Ti.58,66,74Fig. 2 shows the SEM images of the samples. As shown in Fig. 2a, Bi4Ti3O12 is composed of microspheres assembled from nanosheets. This special structure comes from the self-assembly effect of nanomaterials in hydrothermal synthesis process, and is similar to the previous reports.27,29 After the addition of Fe, the microsphere shape is still maintained, but the surfaces of S1 (Fig. 2b) are assembled from nanoparticles. S2 and S3 are constituted by nanosheets, but the crystal sizes of the sheets are decreased significantly (compared with Bi4Ti3O12). SEM-EDS was also used to confirm the elemental compositions (Fig. S4†). The Fe atomic percentages in S1, S2, and S3 are 2.98%, 5.81%, and 8.62% (theoretical values: 4.04%, 5.94%, and 9.52%).
S2, a representative sample, was further investigated by TEM. The TEM image with low magnification (Fig. 3a) is consistent with the SEM data. The clear lattice fringes in Fig. 3b demonstrates the good crystallinity. The lattice fringe spacings of 3.83 Å and 2.99 Å correspond to the (111) and (171) planes of orthorhombic Bi4Ti3O12. Fig. 3c shows a selective area electron diffraction pattern and the marked diffraction rings correspond to the (1 10 1) and (1 13 1) lattice planes. Fig. 3d shows a typical STEM images of S2, and the corresponding TEM-EDS mapping images of Bi, Ti, and Fe are proved in Fig. 3e–g. The results indicate that Fe is distributed evenly.
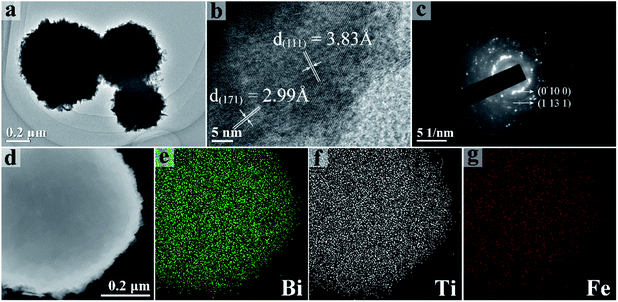 | ||
| Fig. 3 TEM (a) and HRTEM (b) images of S2. Selected area electron diffraction image of S2 (c). STEM image (d) of S2. TEM-EDS mapping of Bi (e), Ti (f), and Fe (g). | ||
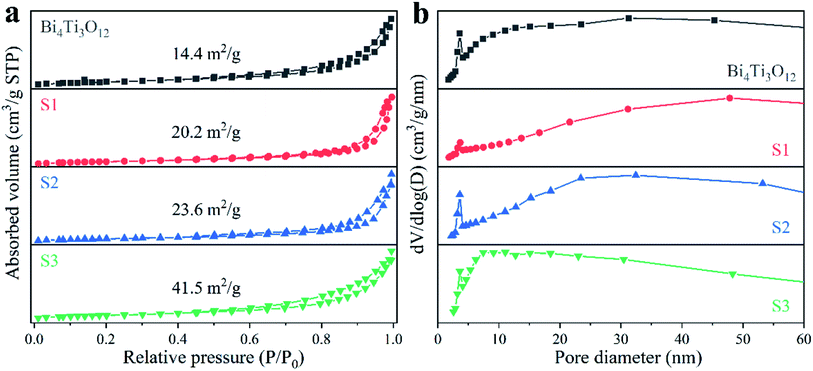
The surface morphology and crystal size will affect the specific surface area of the samples. As shown in Fig. 4a, all the N2 adsorption–desorption isotherms belong to type V isotherm, and the specific BET surface areas are 14.4, 20.2, 23.6, and 41.5 m2 g−1 for Bi4Ti3O12, S1, S2, and S3, respectively. Fig. 4b provides the corresponding pore size distributions. Some small pores with a diameter of about 4 nm are present in Bi4Ti3O12, which may be due to the stacking of surface nanosheets.67 For S1, the amount of the small pores is significantly reduced. This may be due to the surface of S1 are assembled from nanoparticles as shown in the SEM images.
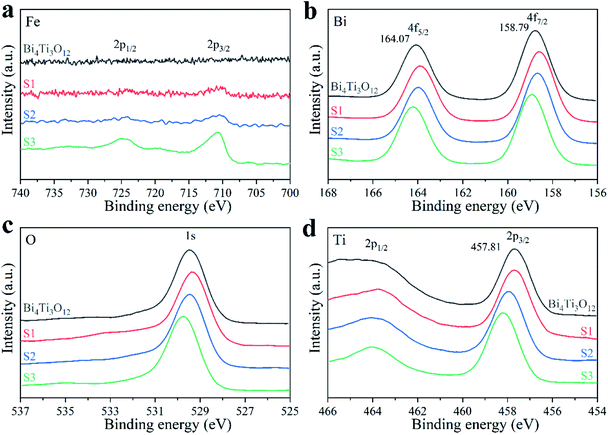
The elemental compositions and oxidation states of the samples were characterized by XPS. The survey spectra are shown in Fig. S5.† With the increase of Fe content, the XPS signal intensity of Fe 2p orbital enhances gradually (Fig. 5a). The characteristic peaks at 727.7 and 710.6 eV in S3 sample belong to Fe3+ 2p1/2 and 2p3/2, respectively. The Fe atomic percentages in S1, S2, and S3 are 3.93%, 5.90%, and 8.56% (theoretical values: 4.04%, 5.94%, and 9.52%), respectively. The peaks at 164.07 and 158.79 eV in Bi4Ti3O12 sample (Fig. 5b) belong to Bi3+ 4f5/2 and 4f7/2, respectively.75 The Bi 4f peaks significantly shift to lower binding energy in S1. This may be caused by the presence of Bi2O3 phase.34 With the increase of Fe amount, the Bi 4f peaks shift toward higher binding energies gradually. The shift direction of O 1s peaks (Fig. 5c) is the same as that of Bi 4f. Fig. 5d shows the XPS spectra of Ti 2p.26 With the increase of Fe content, the Ti 2p peaks gradually shift toward higher binding energies. This may be because the existing of Fe3+ changes the chemical environment of Bi4Ti3O12 and decreases the electron cloud density around Bi and Ti.76 The generated electrons move towards Fe3+, which is beneficial to the electron transfer and the photocatalytic effect.
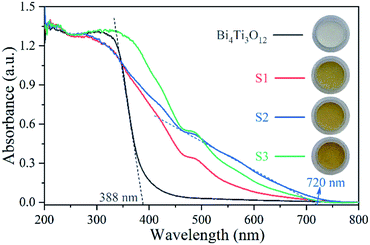
Fig. 6 shows the UV-vis spectra. Bi4Ti3O12 exhibits strong absorption in UV range, but little absorption in visible region (λ > 420 nm). The absorption edge of Bi4Ti3O12 is about 388 nm. After the addition of Fe, there is a significantly red shift towards visible region. As shown in the optical images in Fig. 6, the color of Bi4Ti3O12 changed from white to yellow after the addition of Fe. S2 exhibits the widest absorption range among the samples. The absorption edge of S2 is about 720 nm. The enhanced absorption of visible light may be good for enhancing the photocatalytic activity under visible light. The value of band gap (Eg) can be calculated by Eg = 1240/λ, in which λ is the absorption edge obtained based on the UV-vis absorption spectra.66 The value of Eg for Bi4Ti3O12 and S2 are 3.20 eV and 1.72 eV, respectively.
Photocatalytic performance
Fig. 7a shows the different photodegradation ratio of 20 mg L−1 MB solutions in the presence of different catalysts. After 90 min irradiation under an Xe lamp that generates visible and UV lights, the total removal ratio of MB is 63.5% in the presence of Bi4Ti3O12. The photodegradation efficiency is significantly enhanced with the addition of Fe in the sample. The overall percentages of the removal achieved in the presence of S1, S2, and S3 are 68.8%, 98.2%, and 87.7%, respectively. The corresponding first-order reaction kinetics constant (k) can be calculated by: −ln(C/C0) = kt, where C and C0 are real-time and initial concentration of the pollutions, respectively.62 The values of k are 0.007, 0.010, 0.031, and 0.019 min−1 for Bi4Ti3O12, S1, S2, and S3, respectively (Fig. 7b). The results show that S2 owns the highest photocatalysis activity among these samples. The mineralization ratio of MB using S2 determined by TOC analysis can reach 74.5% after 90 min irradiation. The reusability of S2 was also studied by five-cycle photocatalytic degradation of MB solution. As shown in Fig. S6,† the photocatalytic efficiency is not changed after five cycles.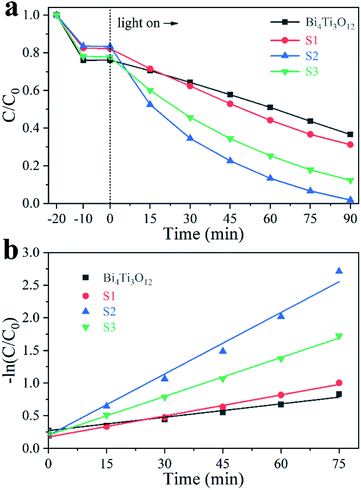 | ||
| Fig. 7 Photodegradation of 20 mg L−1 MB solution using different samples (a) and the corresponding kinetic linear simulation curves (b). | ||
The above photocatalytic experiments were conducted under an Xe lamp (visible light + UV light). Next, control experiments involving photodegradation of MB solution were conducted under visible-light irradiation (λ > 420 nm) via supplementing a UV-cutoff filter. As shown in Fig. S7,† the photodegradation rate of Bi4Ti3O12 is significantly lower than that under an Xe lamp (visible light + UV light), indicating the photocatalytic property of Bi4Ti3O12 is mainly stimulated by ultraviolet light. This observation is consistent with poor visible-light absorption of Bi4Ti3O12 (Fig. 6). On the other hand, the photocatalytic activity of S2 decreases only slightly under visible light than under an Xe lamp, consistent with its light absorption property (Fig. 6).
Ciprofloxacin hydrochloride (CIP–HCl), a colorless medicine, was also tested in photocatalysis. As shown in Fig. 8a, the removal ratios using Bi4Ti3O12, S1, S2, and S3 are 29.7%, 31.4%, 50.8%, and 43.6%, respectively, after 40 min irradiation by an Xe lamp (visible light + UV light). The calculated k values are 0.008, 0.009, 0.023, and 0.018 for Bi4Ti3O12, S1, S2, and S3, respectively (Fig. 8b). S2 is the most active.
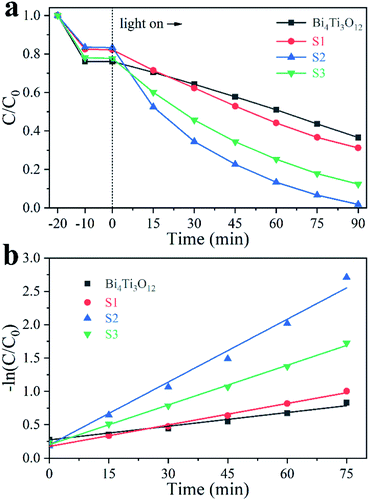 | ||
| Fig. 8 Photodegradation of 40 mg L−1 CIP using different samples (a) and the corresponding kinetic linear simulation curves (b). | ||
Mechanistic studies
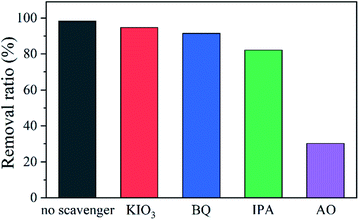
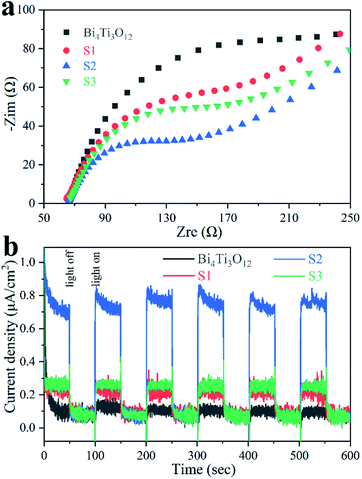
Scavenging experiments were conducted to isolate the contribution of each active species in the photodegradation.76,77 S2 was used as a typical catalyst. As shown in Fig. 9, the removal efficiency decreases just slightly after potassium iodate (KIO3) that can trap e−, benzoquinone (BQ) that can trap ˙O2−, or isopropanol (IPA) that can tarp ˙OH was supplemented, indicating that e−, ˙O2−, and ˙OH are not relevant active species. However, the reaction rate is influenced significantly in the presence of ammonium oxalate (AO) that can trap h+, suggesting that the main active specie in the photodegradation is h+. The influence of different scavengers on the photocatalytic removal of CIP was also studied (Fig. S8†). The results suggest that h+ is still responsible for this catalysis.Fig. 10a shows the EIS spectra of the samples. The radius of the semicircle is linked to the charge transfer resistance.26,32 Bi4Ti3O12 owns the largest radius, implying the strongest charge transfer resistance. S2 presents the smallest radius, indicating the charge transfer is the easiest in S2.
As shown in Fig. 10b, the photocurrent density of S2 is much higher than that of other samples, demonstrating that more carriers can migrate to the surface and contribute to photocatalysis involving S2.44,78
The separation of the electron–hole pairs can be elucidated by PL spectra (Fig. S9†). The strong emission intensity of Bi4Ti3O12 demonstrates the obvious recombination electron–hole pairs generated upon light irradiation.26,46,67 With the addition of Fe, the intensity of emission is weakened obviously, demonstrating the recombination of electron–hole pairs is inhibited.46,79
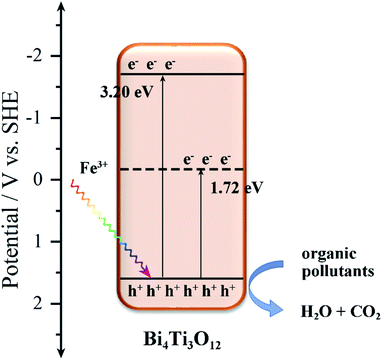
The valence band potentials are also studied by XPS valence band spectra.76,80 As shown in Fig. S10,† the EVB of Bi4Ti3O12 is ca. 1.56 V, and after the addition of Fe, the EVB of S2 (1.56 V) has no obvious change. The Eg of Bi4Ti3O12 and S2 are 3.20 and 1.72 eV, respectively, as obtained from UV-vis absorbance spectra. The XPS data show that the electrons around Ti decreased gradually with the increasing of Fe content. As shown in Fig. 11, the added Fe3+ produces an impurity level in the Bi4Ti3O12 band structure, and the Fe3+ impurity level is an acceptor level. The appearance of impurity level reduces the band gap of Bi4Ti3O12 and the valence electrons can easily transmit to the Fe3+ impurity level under illumination.81 Thus, more h+, as the main active group, can be generated in the Fe–Bi4Ti3O12 and degrade the organic pollutants into H2O and CO2.
Conclusions
Fe–Bi4Ti3O12 microspheres were successful synthesized hydrothermally. The crystal size of Bi4Ti3O12 decreased and the specific surface areas improved gradually with the increase of Fe content. In the photodegradation of organic pollutions, the sample with a Fe atomic percentage of 5.90% shows the highest photocatalytic activity among the catalysts in this study. In addition, the main active group in photocatalytic degradation is h+. The addition of a suitable amount of Fe to the catalyst can efficiently help with the separation of photogenerated electron–hole pairs and inhibit their recombination. There is a significant red shift of the absorption region towards to visible region after the addition of Fe. The enhanced photocatalytic activity may be due to the wider light absorption range and higher electron–hole pairs separation efficiency.Conflicts of interest
There are no conflicts to declare.Acknowledgements
This study was funded by National Natural Science Foundation of China (grant no. 21477022).References
- S. K. Lee, A. Mills and C. O'Rourke, Chem. Soc. Rev., 2017, 46, 4877–4894 RSC.
- H. Wang, X. D. Zhang and Y. Xie, Mater. Sci. Eng. R Rep., 2018, 130, 1–39 CrossRef.
- C. Y. Lee, J. S. Zou, J. Bullock and G. G. Wallace, J. Photochem. Photobiol., C, 2019, 39, 142–160 CrossRef CAS.
- G. Liu, H. G. Yang, J. Pan, Y. Q. Yang, G. Q. Lu and H.-M. Cheng, Chem. Rev., 2014, 114, 9559–9612 CrossRef CAS.
- L. Pan, M. H. Ai, C. Y. Huang, L. Yin, X. Liu, R. R. Zhang, S. B. Wang, Z. Jiang, X. W. Zhang, J. J. Zou and W. B. Mi, Nat. Commun., 2020, 11, 418 CrossRef CAS.
- H. Y. Zhao, Y. W. Duan and X. Sun, New J. Chem., 2013, 37, 986–991 RSC.
- Y. S. Huo, H. Yang, T. Xian, J. L. Jiang, Z. Q. Wei, R. S. Li and W. J. Feng, J. Sol-Gel Sci. Technol., 2014, 71, 254–259 CrossRef CAS.
- C. Han, J. J. Liu, W. J. Yang, Q. Q. Wu, H. Yang and X. X. Xue, J. Photochem. Photobiol., A, 2016, 322–323, 1–9 CAS.
- L. Macaraig, S. Chuangchote and T. Sagawa, J. Mater. Res., 2013, 29, 123–130 CrossRef.
- L. C. Mu, Y. Zhao, A. L. Li, S. Y. Wang, Z. L. Wang, J. X. Yang, Y. Wang, T. F. Liu, R. T. Chen, J. Zhu, F. T. Fan, R. G. Li and C. Li, Energy Environ. Sci., 2016, 9, 2463–2469 RSC.
- K. Yu, C. X. Zhang, Y. Chang, Y. J. Feng, Z. Q. Yang, T. Yang, L. L. Lou and S. X. Liu, Appl. Catal., B, 2017, 200, 514–520 CrossRef CAS.
- X. R. Xiong, R. M. Tian, X. Lin, D. W. Chu and S. Li, J. Nanomater., 2015, 2015, 1–6 Search PubMed.
- S. Kappadan, T. W. Gebreab, S. Thomas and N. Kalarikkal, Mater. Sci. Semicond. Process., 2016, 51, 42–47 CrossRef CAS.
- T. Chen, J. Meng, S. Y. Wu, J. Y. Pei, Q. Y. Lin, X. Wei, J. X. Li and Z. Zhang, J. Alloys Compd., 2018, 754, 184–189 CrossRef CAS.
- Y. Qu, W. Zhou and H. G. Fu, ChemCatChem, 2014, 6, 265–270 CrossRef CAS.
- G. R. Yang, W. Yan, J. N. Wang and H. H. Yang, Mater. Lett., 2014, 122, 117–120 CrossRef CAS.
- A. Abedini and S. Khademolhoseini, J. Mater. Sci.: Mater. Electron., 2015, 27, 330–334 CrossRef.
- Y. Qu, W. Zhou, Z. Y. Ren, S. C. Du, X. Y. Meng, G. H. Tian, K. Pan, G. F. Wang and H. G. Fu, J. Mater. Chem., 2012, 22, 16471–16476 RSC.
- N. Pugazhenthiran, K. Kaviyarasan, T. Sivasankar, A. Emeline, D. Bahnemann, R. V. Mangalaraja and S. Anandan, Ultrason. Sonochem., 2017, 35, 342–350 CrossRef CAS.
- P. P. Hung, T. T. Dat, D. D. Dung, N. N. Trung, M. H. Hanh, D. N. Toan and L. H. Bac, J. Electron. Mater., 2018, 47, 7301–7308 CrossRef CAS.
- W. F. Yao, H. Wang, X. H. Xu, S. X. Shang, Y. Hou, Y. Zhang and M. Wang, Mater. Lett., 2003, 57, 1899–1902 CrossRef CAS.
- H. Q. He, J. Yin, Y. X. Li, Y. Zhang, H. S. Qiu, J. B. Xu, T. Xu and C. Y. Wang, Appl. Catal., B, 2014, 156–157, 35–43 CrossRef CAS.
- L. Z. Pei, H. D. Liu, N. Lin and H. Y. Yu, J. Alloys Compd., 2015, 622, 254–261 CrossRef CAS.
- Z. M. Cui, H. Yang, M. Zhang, H. M. Zhang, J. Y. Su and R. S. Li, Mater. Trans., 2016, 57, 1766–1770 CrossRef CAS.
- K. Qian, Z. Jiang, H. Shi, W. Wei, C. Zhu and J. Xie, Mater. Lett., 2016, 183, 303–306 CrossRef CAS.
- Z. W. Chen, H. Jiang, W. L. Jin and C. K. Shi, Appl. Catal., B, 2016, 180, 698–706 CrossRef CAS.
- S. C. Tu, H. W. Huang, T. R. Zhang and Y. H. Zhang, Appl. Catal., B, 2017, 219, 550–562 CrossRef CAS.
- X. X. Zhao, H. Yang, S. H. Li, Z. M. Cui and C. R. Zhang, Mater. Res. Bull., 2018, 107, 180–188 CrossRef CAS.
- S. Y. Niu, R. Y. Zhang, X. C. Zhang, J. M. Xiang and C. F. Guo, Ceram. Int., 2020, 46, 6782–6786 CrossRef CAS.
- W. N. Ye, C. J. Lu, P. You, K. Liang and Y. C. Zhou, J. Appl. Crystallogr., 2013, 46, 798–800 CrossRef CAS.
- Y. M. Kan, P. L. Wang, T. Xu, G. J. Zhang, D. S. Yan, Z. J. Shen and Y. B. Cheng, J. Am. Ceram. Soc., 2005, 88, 1631–1633 CrossRef CAS.
- D. G. Gu, Y. Y. Qin, Y. C. Wen, T. Li, L. Qin and H. J. Seo, J. Alloys Compd., 2017, 695, 2224–2231 CrossRef CAS.
- D. F. Hou, X. L. Hu, P. Hu, W. Zhang, M. F. Zhang and Y. H. Huang, Nanoscale, 2013, 5, 9764–9772 RSC.
- B. C. Weng, F. H. Xu and J. G. Xu, RSC Adv., 2014, 4, 56682–56689 RSC.
- W. Zhao, Y. Jin, C. H. Gao, W. Gu, Z. M. Jin, Y. L. Lei and L. S. Liao, Mater. Chem. Phys., 2014, 143, 952–962 CrossRef CAS.
- B. C. Weng, F. H. Xu and F. L. Yu, Mater. Lett., 2015, 145, 70–73 CrossRef CAS.
- X. Zhao, H. Yang, Z. Cui, R. Li and W. Feng, Mater. Technol., 2017, 32, 870–880 CrossRef CAS.
- C. X. Zheng, H. Yang, Z. M. Cui, H. M. Zhang and X. X. Wang, Nanoscale Res. Lett., 2017, 12, 608–619 CrossRef.
- B. T. Shi, H. Y. Yin, J. Y. Gong and Q. L. Nie, Mater. Lett., 2017, 201, 74–77 CrossRef CAS.
- H. H. Gan, F. T. Yi, H. N. Zhang, Y. X. Qian, H. X. Jin and K. F. Zhang, Chin. J. Chem. Eng., 2018, 26, 2628–2635 CrossRef CAS.
- N. Cao, H. L. Du, J. Liu and L. L. Wang, Nano, 2018, 13, 1850012 CrossRef CAS.
- N. Li, J. J. Wu, H. B. Fang, X. H. Zhang, Y. Z. Zheng and X. Tao, Appl. Surf. Sci., 2018, 448, 41–49 CrossRef CAS.
- X. Zhao, H. Yang, R. Li, Z. Cui and X. Liu, Environ. Sci. Pollut. Res., 2019, 26, 5524–5538 CrossRef CAS.
- K. Das, D. Majhi, Y. P. Bhoi and B. G. Mishra, Chem. Eng. J., 2019, 362, 588–599 CrossRef CAS.
- W. F. Yao, H. Wang, S. X. Shang, X. H. Xu, X. N. Yang, Y. Zhang and M. Wang, J. Mol. Catal. A: Chem., 2003, 198, 343–348 CrossRef CAS.
- Z. W. Chen, X. Y. Jiang, C. B. Zhu and C. K. Shi, Appl. Catal., B, 2016, 199, 241–251 CrossRef CAS.
- W. F. Yao, H. Wang, X. H. Xu, X. N. Yang, Y. Zhang, S. X. Shang and M. Wang, Appl. Catal., A, 2003, 251, 235–239 CrossRef CAS.
- R. S. Harini, D. Easwaramoorthy, M. Chandru and S. K. Rani, Mater. Res. Express, 2019, 6, 75914 CrossRef CAS.
- L. X. Deng, S. R. Wang, D. Y. Liu, B. L. Zhu, W. P. Huang, S. H. Wu and S. M. Zhang, Catal. Lett., 2009, 129, 513–518 CrossRef CAS.
- T. H. Le, A. T. Bui and T. K. Le, Powder Technol., 2014, 268, 173–176 CrossRef CAS.
- M. C. Gao, D. F. Zhang, X. P. Pu, H. Li, W. Z. Li, X. Shao, D. D. Lv, B. B. Zhang and J. M. Dou, Sep. Purif. Technol., 2016, 162, 114–119 CrossRef CAS.
- H. Song, Y. G. Li, Z. R. Lou, M. Xiao, L. Hu, Z. Z. Ye and L. P. Zhu, Appl. Catal., B, 2015, 166–167, 112–120 CrossRef CAS.
- T. H. Xie, X. Y. Sun and J. Lin, J. Phys. Chem. C, 2008, 112, 9753–9759 CrossRef CAS.
- C. Regmi, Y. K. Kshetri, T. H. Kim, R. P. Pandey and S. W. Lee, Mol. Catal., 2017, 432, 220–231 CrossRef CAS.
- J. T. Gao, Y. Wang, S. J. Zhou, W. Lin and Y. Kong, ChemCatChem, 2017, 9, 1708–1715 CrossRef CAS.
- X. Q. Chen, F. J. Yang, W. Q. Cao, H. Wang, C. P. Yang, D. Y. Wang and K. Chen, Solid State Commun., 2010, 150, 1221–1224 CrossRef CAS.
- Y. W. Liu, Y. P. Pu and Z. X. Sun, J. Mater. Sci.: Mater. Electron., 2015, 26, 7484–7489 CrossRef CAS.
- A. Xia, G. Q. Tan and H. J. Ren, Ceram. Int., 2016, 42, 1267–1271 CrossRef CAS.
- J. Y. Han and C. W. Bark, Jpn. J. Appl. Phys., 2016, 55, 02BC09 CrossRef.
- N. T. Nguyen, M. G. Song and C. W. Bark, J. Nanosci. Nanotechnol., 2017, 17, 7312–7318 CrossRef CAS.
- Y. Chen, J. G. Xu, S. X. Xie, Z. Tan, R. Nie, Z. W. Guan, Q. Y. Wang and J. G. Zhu, Materials, 2018, 11, 821–835 CrossRef.
- Y. B. Liu, G. Q. Zhu, J. Z. Gao, M. Hojamberdiev, R. L. Zhu, X. M. Wei, Q. M. Guo and P. Liu, Appl. Catal., B, 2017, 200, 72–82 CrossRef CAS.
- Y. S. Zhou, G. Chen, Y. G. Yu, Y. J. Feng, Y. Zheng, F. He and Z. H. Han, Phys. Chem. Chem. Phys., 2015, 17, 1870–1876 RSC.
- L. B. Jiang, X. Z. Yuan, Y. Pan, J. Liang, G. M. Zeng, Z. B. Wu and H. Wang, Appl. Catal., B, 2017, 217, 388–406 CrossRef CAS.
- M. R. D. Khaki, M. S. Shafeeyan, A. A. A. Raman and W. Daud, J. Environ. Manage, 2017, 198, 78–94 CrossRef CAS PubMed.
- Z. D. Liu, K. Sun, M. Z. Wei and Z. Ma, J. Colloid Interface Sci., 2018, 531, 618–627 CrossRef CAS PubMed.
- Z. D. Liu, X. N. Liu, Q. F. Lu, Q. Y. Wang and Z. Ma, J. Taiwan Inst. Chem. Eng., 2019, 96, 214–222 CrossRef CAS.
- Z. D. Liu and Z. Ma, Mater. Res. Bull., 2019, 118, 110492 CrossRef CAS.
- Z. Y. Jiao, J. L. Zhang, Z. D. Liu and Z. Ma, J. Photochem. Photobiol., A, 2019, 371, 67–75 CrossRef CAS.
- Z. Y. Jiao, Z. D. Liu and Z. Ma, ACS Omega, 2019, 4, 7919–7930 CrossRef CAS PubMed.
- Y. F. Qiu, M. L. Yang, H. B. Fan, Y. Z. Zuo, Y. Y. Shao, Y. J. Xu, X. X. Yang and S. H. Yang, CrystEngComm, 2011, 13, 1843–1850 RSC.
- Y. B. Zhao, F. Pan, H. Li, T. C. Niu, G. Q. Xu and W. Chen, J. Mater. Chem. A, 2013, 1, 7242–7246 RSC.
- Q. Y. Wang, Z. D. Liu, Q. F. Lu, E. Y. Guo and M. Z. Wei, ChemistrySelect, 2018, 3, 809–815 CrossRef CAS.
- E. V. Ramana, N. V. Prasad, D. M. Tobaldi, J. Zavašnik, M. K. Singh, M. J. Hortigüela, M. P. Seabra, G. Prasad and M. A. Valente, RSC Adv., 2017, 7, 9680–9692 RSC.
- Z. D. Liu, Q. F. Lu, E. Y. Guo and S. W. Liu, J. Nanopart. Res., 2016, 18, 236–246 CrossRef.
- Z. D. Liu and Z. Ma, J. Taiwan Inst. Chem. Eng., 2019, 100, 220–229 CrossRef CAS.
- J. L. Zhang, Z. D. Liu and Z. Ma, ACS Omega, 2019, 4, 3871–3880 CrossRef CAS PubMed.
- H. P. Jiao, X. Yu, Z. Q. Liu, P. Y. Kuang and Y. M. Zhang, RSC Adv., 2015, 5, 16239–16249 RSC.
- W. Wang, Y. R. Ni, C. H. Lu and Z. Z. Xu, RSC Adv., 2012, 2, 8286–8288 RSC.
- J. Keraudy, A. Ferrec, M. Richard-Plouet, J. Hamon, A. Goullet and P.-Y. Jouan, Appl. Surf. Sci., 2017, 409, 77–84 CrossRef CAS.
- M. Nishikawa, R. Takanami, F. Nakagoshi, H. Suizu, H. Nagai and Y. Nosaka, Appl. Catal., B, 2014, 160–161, 722–729 CrossRef CAS.
Footnote |
| † Electronic supplementary information (ESI) available. See DOI: 10.1039/d0ra03305g |
| This journal is © The Royal Society of Chemistry 2020 |

