DOI:
10.1039/D0RA03361H
(Paper)
RSC Adv., 2020,
10, 18704-18714
Enhancement of photo-Fenton catalytic activity with the assistance of oxalic acid on the kaolin–FeOOH system for the degradation of organic dyes†
Received
15th April 2020
, Accepted 26th April 2020
First published on 18th May 2020
Abstract
The Fenton reaction, as an important member of the advanced oxidation processes (AOPs), has gained extensive attention in recent years. However, the practical applications of the traditional Fenton process have been restricted by the poor degradation efficiency and the rigid pH range. In this study, we report a new strategy regarding the photo-Fenton oxidation of Rhodamine B (RhB) by kaolin–FeOOH (K–Fe) catalysts with the assistance of oxalic acid. It was found that the iron–oxalate complex was formed as oxalic acid was introduced into the K–Fe catalyst system by the chelation ability of oxalate. Benefiting from the high photosensitivity of the iron–oxalate complexes, the K–Fe/oxalic acid/H2O2/visible light system exhibited excellent catalytic activity towards the degradation of RhB under the optimized reaction conditions [(K–Fe) dosage = 1.0 g L−1, initial pH = 7.2, (oxalic acid) = 1.0 mM, (H2O2) = 0.5 mM], and its reaction rate constant for the degradation of RhB was 27.7 times greater than that of the K–Fe/H2O2/visible light system. More importantly, the K–Fe/oxalic acid/H2O2/visible system showed remarkable degradation efficiency over a wide pH range (3.3–10.8), which was superior to that of the traditional Fenton system. In addition, the degradation efficiency of RhB was found to remain at 94.7% after five cycles. This work is expected to provide an important approach for the application of the Fenton system.
1. Introduction
In the past decades, water pollution has become more severe and frequent. Dyes, as the prevalent organic contaminant in wastewater, are widely used in coloring and printing activities in paper, textile, leather, and cosmetic industries.1–4 Dye-containing wastewater can directly destroy the ecological balance of a water body and negatively affect human health.5,6 It has been found that dyes are difficult to degrade by traditional biological methods owing to their complex structure with high molecular weight and cytotoxicity.7 Recently, advanced oxidation processes (AOPs), characterized by the production of highly reactive radicals (·OH), have been widely employed in the treatment of organic wastewater, especially non-biodegradable and persistent ones, due to their strong oxidation capacity.8,9 Among the AOPs, the photo-Fenton process can effectively promote the decomposition of hydrogen peroxide and the reduction of ferric ions, which facilitates the formation of ·OH. Therefore, the photo-Fenton can be an attractive candidate for practical applications.10,11
However, the practical applications of the conventional photo-Fenton are still hindered by considerable disadvantages: (1) easy formation of the iron sludge, which causes secondary pollution; (2) the pH range of the reaction is restricted to about 2–3.12,13 Therefore, it is of great economic and environmental interest to develop heterogenous iron-based catalysts to replace ferrous ion so as to overcome the aforementioned drawbacks. To this day, various iron-based catalysts, such as FeOOH, Fe2O3, and Fe3O4, have been utilized for hydrogen peroxide activation. Among these catalysts, FeOOH has been regarded as a promising alternative in the decomposition of organic pollutants owing to its noteworthy stability, hypotoxicity, and low cost.14,15 Clays are widely employed as catalyst supports due to their specific properties and structures as well as their convenient supply of raw materials and cost-effectiveness. Zhang et al.16 synthesized Fe2O3–pillared rectorite (Fe–R) as a heterogeneous Fenton catalyst for the oxidative removal of RhB and p-nitrophenol. It was demonstrated that the Fe–R catalyst can strongly adsorb RhB, which was beneficial for RhB degradation. Luo et al.17 reported the degradation processes of Orange II by nanoscale zero valent iron–rectorite composite, which included adsorption and simultaneous degradation. As a typical clay mineral, similar to rectorite, kaolin possesses strong adsorption capacity and remarkable chemical/mechanical stability. Moreover, the reserves of kaolin are extremely abundant, much higher than that of rectorite; therefore, it is of interest to introduce FeOOH onto kaolin to construct a kind of catalyst with remarkable reactivity and adsorption capacity.
In recent years, low-molecular-weight organic acids (LMWOAs) have been widely used in the Fenton system to improve the efficiency of the degradation process.18,19 Zhang et al.20 investigated the effects of addition of different organic acids, including oxalic acid, acetic acid, citric acid, malic acid, and tartaric acid, on the photo-Fenton process and found that only oxalic acid enhanced the photodegradation efficiency. Oxalic acid, a simple dicarboxylic acid, is biodegradable and is widely distributed in plants, animals, and fungi, with remarkable chelation ability and reducing power. It can act as a complexing and reducing agent simultaneously to maintain iron in soluble forms and also accelerates the Fe(III)/Fe(II) for efficient Fenton oxidation.21–23 Besides, the addition of oxalic acid to the Fenton system leads to the generation of Fe(III)–oxalate, which is a photosensitive complex that can extend the utility of the absorption band range from below 350 nm (UV light band) to 450 nm (visible light band).24 It is well known that the UV region comprises only 3–5% of the total solar spectrum; therefore, it is important to utilize the visible light region (the majority of the sunlight) for the Fenton system.25 To the best of our knowledge, little attention has been devoted to the studies related to the simultaneous introduction of oxalic acid and visible light to the kaolin supported FeOOH system with H2O2 for organic dyes remediation.
Herein, the heterogeneous kaolin–FeOOH catalysts were synthesized by the impregnation method and employed for the degradation of RhB in the visible light driven photo-Fenton system with the assistance of oxalic acid. It was expected that the oxalic acid assisted photo-Fenton process with the kaolin–FeOOH catalyst would achieve excellent performance in RhB degradation. The effects of different factors, including pH, catalyst dosage, H2O2 concentration, and oxalic acid concentration, on the degradation of RhB were evaluated. Furthermore, other three organic dyes, such as methyl orange (MO), methylene blue (MB), and crystal violet (CV) as well as another oxidant (persulfate) were tested in the K–Fe/oxalic acid/visible light system. The cycling experiments and trapping experiments were carried out to investigate the stability of the catalyst and the possible degradation mechanism of the system, respectively.
2. Materials and methods
2.1 Chemicals
Fe(NO3)3·9H2O, Na2CO3, NaCl, H2O2 (30 wt%), HCl, NaOH, oxalic acid (H2C2O4), isopropyl alcohol (IPA), terephthalic acid (TA), ethanol, and p-benzoquinone (BQ) were of analytical grade and purchased from Sinopharm Chemical Reagent Co., Ltd. Methyl orange, crystal violet, methylene blue, Rhodamine B, and kaolin were obtained from market. The above reagents were used directly without further purification.
2.2 Catalyst preparation and characterization
The K–Fe catalyst was prepared according to the previous report with slight modifications.16 Typically, 0.4 M of ferric nitrate solution (50 mL) was added dropwise to 0.2 M of sodium carbonate solution (50 mL). After vigorous stirring for 20 min, the mixing solution was aged for 36 h at 298 K. 5 g of sodium–base kaolin (mixture of 2 wt% NaCl and kaolin) was mixed with 100 mL of the aged solution and then slowly stirred at 70 °C for 8 h. The obtained brown products were washed with deionized water and ethanol five times and dried at 60 °C overnight. Finally, the K–4Fe catalyst samples were obtained. For comparison, the catalyst samples were prepared by only varying the concentration of ferric nitrate at 0.2 M and 0.6 M, similar to the above procedure, and were labeled as K–xFe (x = 2 and 6), where x represents the concentration of ferric nitrate during the preparation process. In this work, K–Fe represents the K–4Fe catalyst sample.
The crystallinity and chemical structure of the catalyst samples were investigated via powder X-ray diffraction (XRD, Bruker, Germany) and Fourier transform infrared (FT-IR, Shimadzu, Japan) spectroscopy. Scanning electron microscopy (SEM, SIGMA 500/VP, Germany) and transmission electron microscopy (TEM, FEI, America) were employed for observing the morphologies of the catalyst samples. The surface species were detected by X-ray photoelectron spectroscopy (XPS, Thermo Fisher Scientific). The specific surface areas of the catalyst samples were checked by N2 physisorption (Autosorb-iQ, Quantachrome instrument, America). The iron content of the leached iron in the solution and the catalyst samples was tested by inductively coupled plasma atomic emission spectrometer (ICP-AES).
2.3 Degradation procedures
The photo-Fenton catalytic performances of the K–Fe catalyst was tested by the degradation of RhB in aqueous solution using LED lamp (300 W) with a 400 nm cutoff filter as the light source (the energy intensity of the irradiation is 98 mW cm−2). All the experiments were carried out at least twice to guarantee the accuracy of the results.
Typically, 100 mg of the K–Fe catalysts and 100 mL of the 10 mg L−1 RhB aqueous solution were mixed under stirring in a 500 mL glass beaker. Then, a certain concentration of H2O2 and oxalic acid were added to the beaker. About 6 mL of the water samples were obtained after 2 min each and centrifuged. Finally, the concentration of RhB was checked by using the UV-Vis spectrophotometer at 554 nm. The removal rate of RhB was calculated from the following equation (eqn (1)), where At is the RhB absorbance after the reaction and A0 is the initial RhB absorbance.
| | |
η = (A0 − At)/A0 = (C0 − Ct)/C0 × 100%
| (1) |
2.4 Scavenging experiments and detection of ·OH
The scavenging experiments was carried out at the same degradation conditions except that different scavengers were added at the beginning of the reaction. The number of ·OH generated during the degradation process was detected by measurement of the photoluminescence (PL) signal of 2-hydroxyterephthalic acid resulting from the capture of ·OH by TA (excitation wavelength of 312 nm). The fluorescence analysis experiments were employed at the same degradation conditions except that TA was added and the absence of RhB at the beginning of the reaction.
3. Results and discussion
3.1 Characterization of the K–Fe catalysts
3.1.1. Phase composition. The phase composition and crystal structure of the kaolin (K) and K–Fe samples were analyzed by XRD and XPS characterizations. The XRD patterns of K and K–Fe are shown in Fig. 1a; the diffraction peaks of K and K–Fe samples in the XRD spectra were very similar, indicating that the main structure of kaolin before and after the introduction of FeOOH changed negligibly. In Fig. 1a, no diffraction peaks of the crystalline phase iron species were observed among these samples, which might be attributed to the low content of iron (3.96 wt% by ICP). The diffraction peaks at 2θ = 20.1° and 29.1° corresponded to the (110) and (003) crystal planes of the kaolin, respectively. On the other hand, the diffraction peaks of K–Fe shifted with the incorporation of FeOOH by a small angle, as shown in Table 1. According to Bragg's law equation d(h k l) = nλ/(2![[thin space (1/6-em)]](https://www.rsc.org/images/entities/char_2009.gif) sin
sin![[thin space (1/6-em)]](https://www.rsc.org/images/entities/char_2009.gif) θ), the lattice fringes of the K–Fe samples on the (110) and (003) crystal planes were 0.03 nm and 0.01 nm higher than those of the kaolin samples, respectively. The XRD patterns of the K–xFe (x = 0, 2, 4, and 6) samples are shown in Fig. S1a;† the patterns of all the samples were found to be shifted towards lower angles. These results revealed that the lattice fringe spacing of the K–Fe lattice was enhanced.26,27
θ), the lattice fringes of the K–Fe samples on the (110) and (003) crystal planes were 0.03 nm and 0.01 nm higher than those of the kaolin samples, respectively. The XRD patterns of the K–xFe (x = 0, 2, 4, and 6) samples are shown in Fig. S1a;† the patterns of all the samples were found to be shifted towards lower angles. These results revealed that the lattice fringe spacing of the K–Fe lattice was enhanced.26,27
 |
| | Fig. 1 (a) XRD patterns of the samples: kaolin and the K–Fe catalyst; high-resolution XPS spectra of the K–Fe catalyst: (b) Fe 2p spectrum, (c) O 1s spectrum. | |
Table 1 The BET surface areas and pore parameters of the samples
| Samples |
Specific surface area, (m2 g−1) |
Pore size, (nm) |
Pore volume, (cm3 g−1) |
2θ, {110} |
2θ, {003} |
| Kaolin |
11.818 |
7.796 |
0.064 |
20.1° |
29.1° |
| Kaolin–Fe |
29.025 |
3.061 |
0.075 |
19.3° |
28.2° |
To confirm the existence of the FeOOH species and to study the electronic states of the elements in the composite, XPS analysis of the K–Fe samples was carried out. High-resolution XPS spectra of Fe 2p (c) and O 1s (d) are illustrated in Fig. 1(b) and (c). The Fe 2p peaks can be observed in the spectrum, demonstrating the successful introduction of iron species into kaolin. The peaks at 724.8 and 711.2 eV were ascribed to the binding energy of the Fe 2p3/2 peaks and Fe 2p1/2, respectively, which were characteristic of the presence of FeOOH in the K–Fe samples.28 With the deconvolution of the O 1s spectrum, three peaks were found at 532.4, 531.5, and 530.3 eV, which corresponded to the adsorbed hydroxyl Fe–OH(adsorb), lattice hydroxyl Fe–OH(lattice), and the lattice oxygen Fe–O, respectively.29 Therefore, the above results confirmed that FeOOH was successfully loaded on kaolin.
3.1.2. N2 physisorption. The N2 adsorption–desorption isotherms of the K and K–Fe samples and their pore size distribution curves are illustrated in Fig. S2.† The BET surface area, pore volume, and average pore diameter are summarized in Table 1. An increase of about 2.5 times in the BET surface area was found (increase from 11.818 to 29.025 m2 g−1) when introducing FeOOH into kaolin, implying the formation of extra porous structures. Both the K and K–Fe samples exhibited Langmuir type IV isotherms with a H3-type hysteresis loop corresponding to that of a typical mesoporous material with sheet structure particles.30 The pore diameter of the K–Fe sample dropped significantly compared to the K sample, while the pore volume increased. On account of the above analysis, it was speculated that the FeOOH nanoparticles might be generated in the interlayers and on the surface of kaolin during the fabricating process.31
3.1.3. Morphology. The SEM images of kaolin and the K–Fe catalysts are displayed in Fig. 2. At the same resolution ratio, a layered structure was found in the SEM image of kaolin. In contrast, the SEM image of the K–Fe catalyst displayed that some substances clearly adhere to its surface, which might be attributed to the aggregation of hydroxyl iron ions to form FeOOH on the surface of kaolin during the aging process.32 The TEM images of the K–Fe catalysts are shown in Fig. 3(a) and (b). As can be seen, the lattice fringe spacing of kaolin was about 0.312 nm, corresponding to the (003) crystal plane of kaolin. These results matched well with the XRD results.
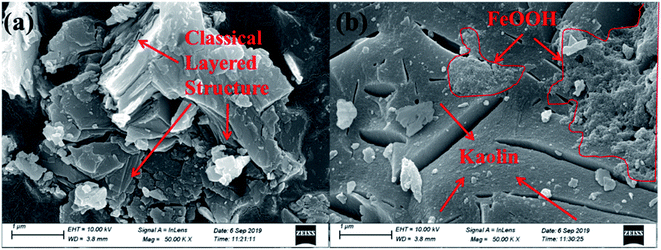 |
| | Fig. 2 SEM images of the samples: (a) kaolin, (b) the K–Fe catalyst. | |
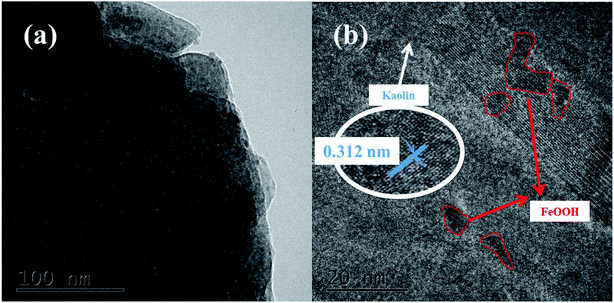 |
| | Fig. 3 (a) TEM image of the K–F catalyst, (b) HRTEM image of the K–Fe catalyst. | |
3.2 Catalytic performance of the K–Fe catalysts
3.2.1. Photo-Fenton degradation of RhB. The degradation of RhB versus time under different conditions is illustrated in Fig. 4a. With the K–Fe catalyst but in the absence of H2O2, the degradation efficiency of RhB was extremely low, with or without visible light irradiation. With the addition of oxalic acid and the K–Fe catalyst, the removal efficiency of RhB reached 37.9% in the dark, which might be ascribed to the increase in the surface negative charge of K–Fe by adding oxalic acid, which favors the electrostatic adsorption of RhB molecules.33 In the presence of H2O2 and the K–Fe catalyst, negligible degradation of RhB was observed in the dark or even under illumination, indicating that the degradation efficiency of the general heterogeneous Fenton system was still unsatisfactory. Interestingly, nearly 70% of RhB was degraded within 4 min and 98.8% degradation of RhB was achieved within 10 min in the K–Fe catalyst/H2O2 system with the addition of oxalic acid under visible light irradiation and this system exhibited much higher degradation efficiency compared with the reported results.34,35 However, only 41.8% of RhB was decomposed in the K–Fe catalyst/oxalic acid/H2O2 system without visible light irradiation, suggesting the importance of visible light irradiation for the degradation of RhB. Notably, 68.7% of RhB was degraded in the kaolin/H2O2/oxalic acid/visible light system owing to the strong adsorption capacity of kaolin,36,37 which would be beneficial for the degradation reaction.
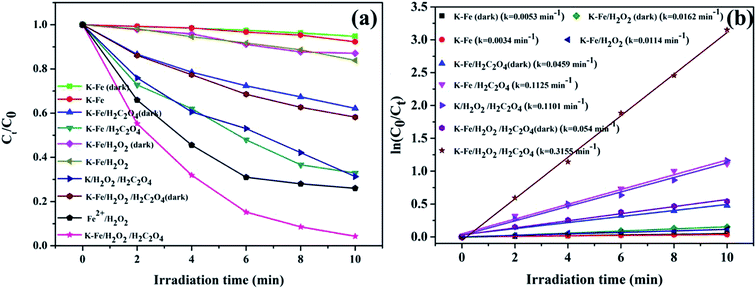 |
| | Fig. 4 (a) Degradation activity curves for RhB under different conditions, (b) kinetics for the degradation of RhB ((K–Fe) = 1.0 g L−1, pH = 7.2, (oxalic acid) = 1.0 mM, (H2O2) = 0.5 mM). | |
The degradation of RhB by the K–xFe (x = 0, 2, 4, 6) catalyst samples is displayed in Fig. S1b.† It was observed that the degradation of RhB did not change significantly on adjusting the concentration of ferric nitrate during the preparation process. On the introduction of FeOOH to kaolin, the RhB degradation percentage increased from 68.7% to more than 95% in 10 min, suggesting that the iron species effectively enhanced the photo-Fenton catalytic activity of kaolin. The effects of the addition order of H2O2 and oxalic acid on the degradation of RhB were tested. As shown in Fig. S3,† there was no obvious difference in the degradation efficiency between the two addition orders. In addition, the classical Fenton reaction was tested for comparison. The concentration of ferrous ion in the homogeneous Fenton system was adjusted to 0.0396 g L−1 according to the iron loading of the as-prepared K–Fe catalyst. By adopting the classic Fenton system, 74% degradation percentage of RhB was achieved, which was obviously lower than that of the K–Fe catalyst/oxalic acid/H2O2/visible light system.
Fig. 4b demonstrates the degradation curves for RhB in different systems and the degradation processes were found to fit the pseudo-first order kinetic model (ln(C0/Ct) = ln(A0/At) = kt, where k represents the degradation rate constant). The degradation rate constant (k = 0.3155 min−1) of the K–Fe/oxalic acid/H2O2/visible light system was about 27.7 times, 5.8 times, and 2.9 times greater than that of the K–Fe/H2O2/visible light, K–Fe/oxalic acid/H2O2, and K/oxalic acid/H2O2 system, respectively. The detailed numerical results for the degradation of RhB are listed in Table 2. According to the above results, it could be concluded that the K–Fe/oxalic acid/H2O2/visible light system was the most effective for the degradation of RhB.
Table 2 Comparison of the degradation of RhB in different systems
| Entry |
Experimental conditions |
k (min)−1 |
ηRhB (%) |
| 1 |
K–Fe (dark) |
0.0034 |
5.3 |
| 2 |
K–Fe (light) |
0.0053 |
7.7 |
| 3 |
K–Fe/oxalic acid (dark) |
0.0459 |
37.9 |
| 4 |
K–Fe/oxalic acid (light) |
0.1125 |
67.1 |
| 5 |
K–Fe/H2O2 (dark) |
0.0114 |
12.9 |
| 6 |
K–Fe/H2O2 (light) |
0.0162 |
16.1 |
| 7 |
K/H2O2/oxalic acid (light) |
0.1101 |
68.7 |
| 8 |
K–Fe/H2O2/oxalic acid (dark) |
0.0540 |
41.8 |
| 9 |
Fe2+/H2O2 (light) |
0.2189 |
74.0 |
| 10 |
K–Fe/H2O2/oxalic acid (light) |
0.3155 |
98.8 |
3.2.2. The effects of reaction conditions on the degradation of RhB. The effects of reaction conditions, including catalyst dosage, oxalic acid concentration, initial pH value, and H2O2 concentration, on the degradation of RhB were investigated in the K–Fe/oxalic acid/H2O2/visible light system.The effect of K–Fe catalyst dosage on the degradation of RhB is shown in Fig. 5a. The degradation efficiency of RhB increased from 66.3% to 98.8% along with increasing catalyst dosage from 0.3 to 1.0 g L−1. It might be ascribed to the greater number of active sites that would be usable for the degradation of RhB as the catalyst dosage increased. Nevertheless, the degradation efficiency of RhB almost remained unchanged after 10 min reaction with further increase in the catalyst dosage to 2.0 g L−1. Since the reaction occurred in a suspension with the heterogenous catalyst, the light transmittance of the reaction solution should be taken into account in the RhB degradation process. It was obvious that excess catalyst dosage would decrease the light transmittance of the reaction solution and reduce the visible irradiation intensity required for the photo reduction of Fe(III),21 which had a negative effect on the photo-Fenton process. Thus, the optimal dosage of the K–F catalyst was found to be 1.0 g L−1.
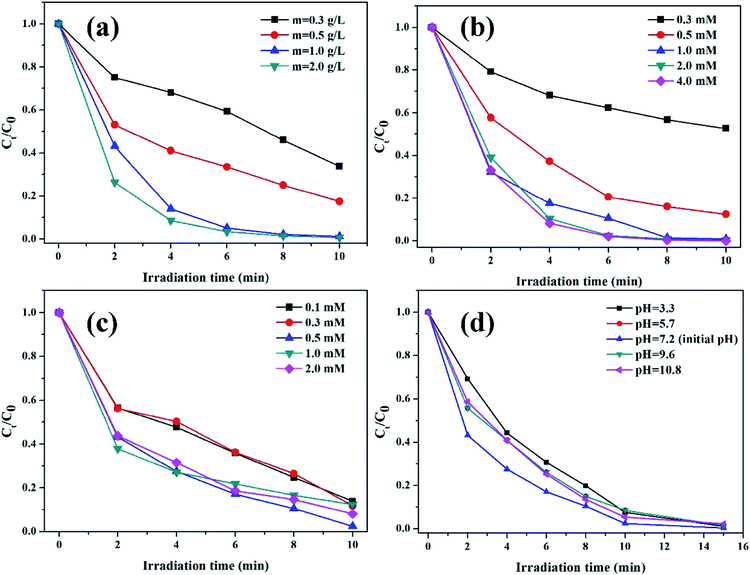 |
| | Fig. 5 (a) Effect of catalyst dosage (pH = 7.2, (oxalic acid) = 1.0 mM, (H2O2) = 0.5 mM), (b) oxalic acid concentration ((K–Fe) = 1.0 g L−1, pH = 7.2, (H2O2) = 0.5 mM), (c) H2O2 concentration ((K–Fe) = 1.0 g L−1, pH = 7.2, (oxalic acid) = 1.0 mM), (d) initial pH ((K–Fe) = 1.0 g L−1, (oxalic acid) = 1.0 mM, (H2O2) = 0.5 mM) on the degradation of RhB. | |
The influence of oxalic acid concentration in the range from 0.3 mM to 4.0 mM is presented in Fig. 5b. As demonstrated, the initial concentration of oxalic acid had a significant impact on the RhB degradation efficiency. In the range of 0.3 to 1.0 mM, the degradation percentage of RhB increased rapidly from 47.3% to 98.8% along with the increased concentration of oxalic acid. It is reported that the introduction of oxalic acid to the iron-based catalyst would form the photoactive complex [FeIII(C2O4)3]3−, which was beneficial for RhB degradation.38 However, RhB degradation increased slightly when the oxalic acid concentration further increased to 2.0 mM or 4.0 mM. Though the addition of oxalic acid could effectively promote RhB degradation, excess oxalic acid could compete with RhB for the formed ·OH radicals, leading to impaired degradation of RhB. Thus, the optimal concentration of oxalic acid was set as 1.0 mM.
The impact of H2O2 concentration on the decomposition of RhB is illustrated in Fig. 5c. The degradation efficiency of RhB increased as the H2O2 concentration increased from 0.1 mmol L−1 to 0.5 mmol L−1, which could be assigned to the fact that H2O2 is a source of ·OH; thus, higher H2O2 concentration may lead to the generation of more ·OH.39 At H2O2 concentrations higher than 0.5 mol L−1, a decrease in the RhB degradation was observed, which was ascribed to the consumption of ·OH radicals by excess H2O2.40 Thus, the optimal concentration of H2O2 was found to be 0.5 mM.
The effect of the initial pH values on the degradation of RhB is depicted in Fig. 5d. As can be seen, 98.8% of RhB was degraded within 10 min at the initial pH value of 7.2. When the initial pH value increased from 7.2 to 10.8, the degradation percentage of RhB decreased to 94.7%. On decreasing the initial pH value from 7.2 to 3.3, the degradation percentage of RhB declined to 92.5%. It was clear that the optimal initial pH value was 7.2. With the addition of oxalic acid, the pH value of the solution decreased significantly. The changes in the pH value during the degradation process at 0, 2, 4, 6, 8, and 10 min are displayed in detail in Table S1.† Thus, when the initial pH value was low, excess H+ could act as the scavenger of ·OH radicals, thus causing the consumption of ·OH radicals. Moreover, excess H+ might react with H2O2 to form H3O2+.41 When the initial pH value increased to the alkaline pH range, the oxidation potential of ·OH/H2O reduced, resulting in a lower degradation efficiency. Han et al.42 reported the same phenomenon in their study. Nevertheless, it was notable that the degradation efficiency of RhB was retained to above 92% under the initial pH range from 3.3 to 10.8, showing that the degradation reaction could occur over a wide pH range, which was different from the conventional homogeneous Fenton system. The results are in agreement with the previous reports, which found that the clay-supported iron catalyst could extend the pH value range in the photo-Fenton process.16,34,35
3.2.3. Mineralization and adaptability. The UV-Vis spectral changes in RhB versus irradiation time over the K–Fe catalyst under the optimum reaction conditions are displayed in Fig. S4.† The absorption peak at 554 nm fell gradually until it was flat, indicating that the RhB structure was successfully decomposed by the K–Fe/oxalic acid/H2O2/visible light system. In order to check the mineralization of RhB, the TOC removal of the RhB aqueous solution along with time was measured in the K–Fe/oxalic acid/H2O2/visible light system. It can be seen from Fig. 6a that the degradation percentage of RhB and TOC removal percentage of RhB reached 98.8% and 49.1% in 10 min, respectively, under the optimal reaction conditions. These results confirmed that the system had an excellent catalytic activity.
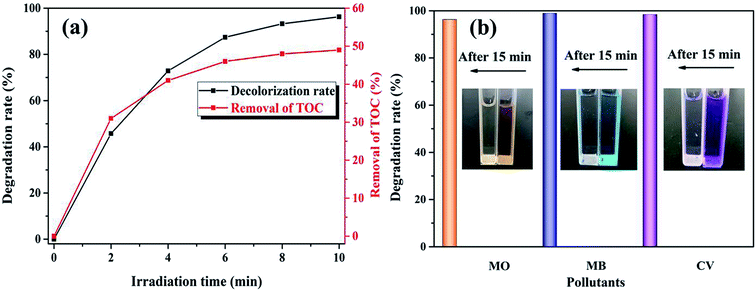 |
| | Fig. 6 (a) TOC removal of RhB, (b) the degradation of MO, MB, and CV ((K–Fe) = 1.0 g L−1, pH = 7.2, (oxalic acid) = 1.0 mM, (H2O2) = 0.5 mM, (organic dyes) = 100 mL, 10 mg L−1). | |
To further test the universality of the K–Fe/oxalic acid/H2O2 system, the degradation of three other common industrial organic dyes were carried out, including MO, MB, and CV. As presented in Fig. 6b, the degradation percentage of the organic dyes MO, MB, and CV reached 96.3%, 98.9%, and 98.4% in 15 min, respectively. The above results proved that the K–Fe/oxalic acid/H2O2/visible light system was efficient for the degradation of organic dyes. In addition, the effect of different oxidants on the degradation of RhB was evaluated under the optimal reaction conditions, as shown in Fig. S5.† When employing persulfate as the oxidant, more than 90% of RhB was degraded, which was slightly lower than using H2O2 as the oxidant but more effective than the traditional Fenton process.
3.3 Stability and reusability of the K–Fe catalysts
The cycling degradation experiments were carried out to determine the stability of the K–Fe catalysts. As presented in Fig. 7a, the degradation percentage of RhB was found to remain 94.7% after five cycles. The degradation efficiency of RhB dropped negligibly, which might be ascribed to negligible iron leaching from the catalyst samples in the cycling degradation experiments.43
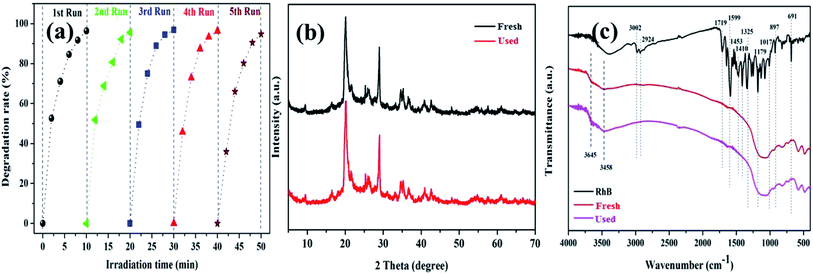 |
| | Fig. 7 (a) The stability of the K–Fe catalyst for the degradation of RhB, (b) XRD spectra of the fresh and used catalysts, (c) FT-IR spectra of the fresh and used catalysts. | |
To further confirm the stability of the K–Fe catalyst, the fresh and used catalysts were tested by XRD and FT-IR. In Fig. 7b, it was observed that the XRD spectrum of the used catalyst was very similar to that of the fresh catalyst. Also, in Fig. 7c, the FT-IR spectra of the fresh and used catalysts did not change significantly. These results implied that the K–Fe catalyst was robust and reusable.
3.4 Catalytic mechanism
Despite the fact that kaolin has strong adsorption capacity, the characteristic peaks of pure RhB (1719, 1599, 1453, 1410, and 1179 cm−1) were not observed in the spectrum of the used catalyst, as shown in Fig. 7c. Thus, it could be concluded that the RhB molecule was fully decomposed rather than being adsorbed on the catalyst during the degradation process. As shown in Fig. 8, the concentration of leached iron increased to 0.474 mg L−1 in the first 2 min and decreased to 0.176 mg L−1 in the subsequent 8 min. This phenomenon might be explained as follows: the surface iron could react with oxalic acid to form the dissolved iron–oxalate complexes due to a relatively higher concentration of oxalic acid at the beginning of the reaction. Then, the oxalate was continuously consumed along with the reaction time, accompanied by the decomposition of the complexes, thus causing the precipitation of a portion of the Fe(III) ions. Even so, it was notable that the leached iron was extremely low and its corresponding homogeneous Fenton activity was much lower than the heterogenous Fenton activity. Hence, the RhB degradation process was predominately carried out on the surface Fe of the K–Fe catalyst.44
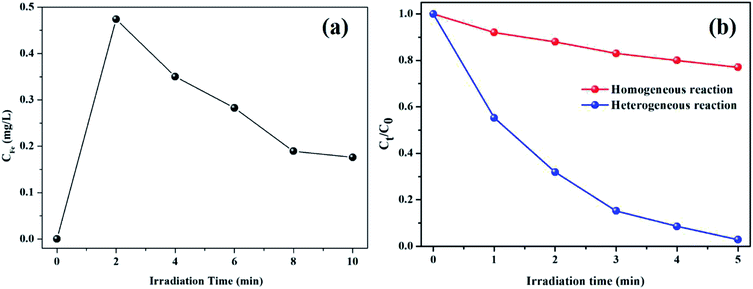 |
| | Fig. 8 (a) Iron ion leaching concentration at different reaction times, (b) the comparison with heterogeneous Fenton and homogeneous Fenton for the degradation RhB ((K–Fe) = 1.0 g L−1 otherwise (Fe3+) = 0.474 mg L−1, pH = 7.2, (oxalic acid) = 1.0 mM, (H2O2) = 0.5 mM). | |
It is well-known that ·OH and O2−˙ act as reactive oxygen species (ROS) in AOPs.45,46 To figure out the contribution of ROS to RhB degradation, two kinds of scavengers (IPA for ·OH, BQ for O2−˙) were introduced to the K–Fe/oxalic acid/H2O2/visible light system. As excepted, the degradation efficiency of RhB decreased with the addition of the scavengers (Fig. 9a). In particular, the degradation of RhB was severely restricted (98.8% to 45.9%) with the addition of IPA, suggesting that ·OH was the main ROS in RhB degradation in the K–Fe/oxalic acid/H2O2/visible light system. On the addition of BQ, there was about 10% drop in the degradation efficiency of RhB, indicating that O2−˙ was the intermediate during the formation of ·OH. To further validate the presence of ·OH, fluorescence spectrum analysis was carried out during RhB degradation in different systems (Fig. 9b and c). It was obvious that the ·OH radicals were generated in both the K–Fe/oxalic acid/H2O2/visible light system and the K–Fe/H2O2/visible light system. The fluorescence intensity increased quickly in the first 2 min and then increased slowly during the subsequent 8 min in the K–Fe/oxalic acid/H2O2/visible light system. The fluorescence intensity change curves matched well with the RhB degradation curve in the K–Fe/oxalic acid/H2O2/visible light system. Compared with the K–Fe/H2O2/visible light system, the K–Fe/oxalic acid/H2O2/visible light system displayed a significant enhancement in the fluorescence intensity, confirming that oxalic acid could effectively promote the production of ·OH, which is responsible for RhB degradation.
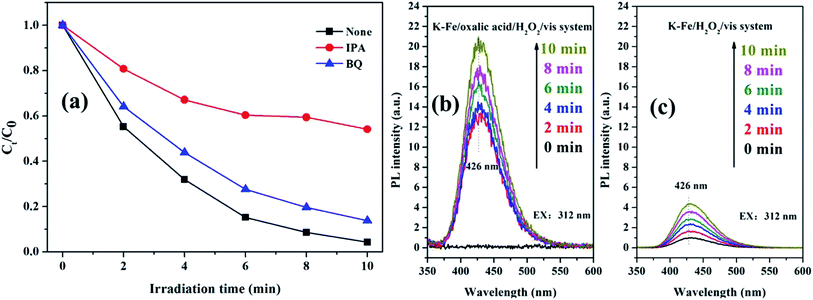 |
| | Fig. 9 (a) The trapping experiment with different scavengers added in the K–Fe/oxalic acid/H2O2/visible light system, (b) ·OH-trapping fluorescence spectra of the K–Fe/oxalic acid/H2O2/visible light system, (c) ·OH-trapping fluorescence spectra of the K–Fe/H2O2/visible light system. | |
As the standard electrode potential for Fe(III)/Fe(II) is 0.77 V (eqn (2)) and the standard electrode potential for the half-reaction of H2O2 is equal to 0.69 V (eqn (3)), thus, it is believed that the poor efficiency of the Fe(III)/Fe(II) cycle in the traditional Fenton was ascribed to the weak reduction ability of the ferric ions for H2O2 reduction.47 The standard electrode potential for the half-reaction of oxalic acid is equal to −0.49 V (eqn (4)), which makes it thermodynamically favorable to reduce Fe(III) species to Fe(II) species.48 Thus, as soon as oxalic acid is introduced into the reaction system, the Fe(III)/Fe(II) cycle would be accelerated, leading to the more efficiently catalysis of the decomposition of H2O2 to generate more ·OH for the degradation of RhB.
| | |
FeIII + e− = FeII E0 = 0.771 V
| (2) |
| | |
O2(g) + 2H+ + 2e− = H2O2 E0 = 0.69 V
| (3) |
| | |
2CO2(g) + 2H+ + 2e− = H2C2O4 E0 = −0.49 V
| (4) |
It is reported that when the concentration of oxalic acid was higher than 0.18 mM, the Fe(III) species might exist chiefly as [FeIII(C2O4)2]− and [FeIII(C2O4)3]3−.49 Liu et al.48 compared the XPS spectra of iron in NiFe2O4 before and after the photocatalysis, and they concluded that the complex [FeIII(C2O4)2]− or [FeIII(C2O4)3]3− was formed on the surface of the catalyst during the photocatalytic process. Moreover, the Fe(III)–oxalate complex is photosensitive and can be reduced to the Fe(II)–oxalate complex with the generation of C2O4−˙ under visible light irradiation.50 [FeII(C2O4)2]2− could easily react with H2O2 to generate ·OH (eqn (5)) because the reaction constant was 3.1 × 10⁴ M−1 s−1, which was significantly larger than that of the conventional Fenton reaction (eqn (6)).51 Therefore, the formation rate of ·OH was greatly enhanced in the presence of oxalic acid, which was beneficial for the improvement of RhB degradation.
| | |
[FeII(C2O4)2]2− + H2O2 → [FeIII(C2O4)2]− + ·OH + OH− k = (3.1 ± 0.6) × 104 M−1 s−1
| (5) |
| | |
FeII + H2O2 → Fe III + ·OH + OH− k = 7.6 × 101 M−1 s−1
| (6) |
In light of the above analysis, a possible mechanism for the K–Fe/oxalic acid/H2O2/visible light system was proposed, as shown in Scheme 1. Firstly, RhB molecules were adsorbed on the surface of the K–Fe catalyst. Next, the surface Fe(III)–oxalate complex was generated from oxalate and the surface Fe(III) of the K–Fe catalyst (eqn (7)). The formed surface Fe(III)–oxalate complexes were reduced to the surface Fe(II)–oxalate complexes on excitation by visible light and simultaneously generated the C2O4−˙ radicals (eqn (8)). Then, the surface Fe(II)–oxalate complexes reacted with H2O2 to produce ·OH along with the surface Fe(III)–oxalate complexes (eqn (9)). The C2O4−˙ radicals could react with dissolved oxygen to form  (eqn (10)) and they further reacted with H+ to generate H2O2 (eqn (11) and (12)), which guaranteed a sufficient supply of ·OH. In addition, a small proportion of Fe(III) on the surface of the K–Fe catalyst was photo-reduced to surface Fe(II) and the surface Fe(II) reacted directly with H2O2 to form the hydroxyl radicals (eqn (13) and (14)). At last, the formed ·OH radicals attacked the RhB molecules adsorbed on the surface of the K–Fe catalyst and several intermediates with phenyl group were subsequently produced, which were further degraded to CO2 and H2O (eqn (15)). The degradation pathway is depicted in Fig. S6.†
| |
![[triple bond, length as m-dash]](https://www.rsc.org/images/entities/char_e002.gif) FeIII + nC2O42− → [ FeIII + nC2O42− → [![[triple bond, length as m-dash]](https://www.rsc.org/images/entities/char_e002.gif) FeIII(C2O4)n]3−2n FeIII(C2O4)n]3−2n
| (7) |
| |
[![[triple bond, length as m-dash]](https://www.rsc.org/images/entities/char_e002.gif) FeIII(C2O4)n]3−2n + hν → [ FeIII(C2O4)n]3−2n + hν → [![[triple bond, length as m-dash]](https://www.rsc.org/images/entities/char_e002.gif) FeII(C2O4)n−1]4−2n + C2O4˙− FeII(C2O4)n−1]4−2n + C2O4˙−
| (8) |
| |
[![[triple bond, length as m-dash]](https://www.rsc.org/images/entities/char_e002.gif) FeII(C2O4)n−1]4−2n + H2O2 → [ FeII(C2O4)n−1]4−2n + H2O2 → [![[triple bond, length as m-dash]](https://www.rsc.org/images/entities/char_e002.gif) FeIII(C2O4)n−1]5−2n + ·OH + OH− FeIII(C2O4)n−1]5−2n + ·OH + OH−
| (9) |
| | |
C2O4−˙ + O2 → 2 CO2 + O2−˙
| (10) |
| | |
HOO˙ + HOO˙ → O2 + H2O2
| (12) |
| |
![[triple bond, length as m-dash]](https://www.rsc.org/images/entities/char_e002.gif) FeIII + hν → FeIII + hν → ![[triple bond, length as m-dash]](https://www.rsc.org/images/entities/char_e002.gif) FeII FeII
| (13) |
| |
![[triple bond, length as m-dash]](https://www.rsc.org/images/entities/char_e002.gif) FeII + H2O2 → FeII + H2O2 → ![[triple bond, length as m-dash]](https://www.rsc.org/images/entities/char_e002.gif) FeIII + ·OH + OH− FeIII + ·OH + OH−
| (14) |
| | |
·OH + organic dyes → small molecules → CO2 + H2O
| (15) |
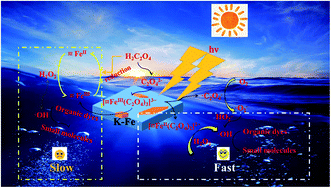 |
| | Scheme 1 Degradation mechanism of the K–Fe/oxalic acid/H2O2/visible light system. | |
4. Conclusions
In summary, the kaolin–FeOOH catalyst was successfully prepared by a facile method and exhibited excellent photo-Fenton catalytic performance with the assistance of oxalic acid. Benefiting from the high photosensitivity of the iron–oxalate complexes of oxalic acid, 98.8% degradation percentage and 49.1% removal rate of TOC due to RhB degradation were achieved under the optimum operating conditions. The effects of various reaction conditions on the degradation of RhB were determined. It was found that the K–Fe/oxalic acid/H2O2/visible light system could maintain great catalytic activity in the pH range 3.3–10.8 and exhibited an excellent stability, which was proved by the five-cycle test. The trapping experiments demonstrated that the ·OH radical was the crucial active species in the degradation of RhB. The reducing power of oxalic acid and the high photosensitivity of the iron–oxalate complexes effectively promoted the Fe3+/Fe2+ cycle, which was beneficial for the high performance of RhB degradation. These results suggested that the K–Fe/oxalic acid/H2O2/visible light system has potential value for the treatment of organic dyes in water.
Conflicts of interest
There are no conflicts to declare.
Acknowledgements
This work was supported by the Innovative Entrepreneurship Project of Chinese College Students (201910580156), the Zhaoqing University Natural Science Project (201902), and the Zhaoqing City Science and Technology Innovation Guidance Project (201904030112, 201904030201).
References
- G. Ran and Q. Li, RSC Adv., 2019, 9, 25414–25422 RSC.
- Y. Chen, N. Li, Y. Zhang and L. Zhang, J. Colloid Interface Sci., 2014, 422, 9–15 CrossRef CAS PubMed.
- J. Li, C. Xiao, K. Wang, Y. Li and G. Zhang, Environ. Sci. Technol., 2019, 53, 11023–11030 CrossRef CAS PubMed.
- J. Yu, Q. Xiang and M. Zhou, Appl. Catal., B, 2009, 90, 595–602 CrossRef CAS.
- X. Lai, R. Guo, H. Xiao, J. Lan, S. Jiang, C. Cui and E. Ren, J. Hazard. Mater., 2019, 371, 506–512 CrossRef CAS PubMed.
- Y. Hu, Y. Zhang and Y. Tang, RSC Adv., 2012, 2, 6036–6041 RSC.
- D. Tang, G. Zhang and S. Guo, J. Colloid Interface Sci., 2015, 454, 44–51 CrossRef CAS PubMed.
- M. Pera-Titus, V. García-Molina, M. Baños, J. Giménez and S. Esplugas, Appl. Catal., B, 2004, 47, 219–256 CrossRef CAS.
- C. Hitam and A. Jalil, J. Environ. Manage., 2020, 258, 110050 CrossRef CAS PubMed.
- M. Tokumura, M. Shibusawa and Y. Kawase, Chem. Eng. Sci., 2013, 100, 212–224 CrossRef CAS.
- O. Rozas, D. Contreras, M. A. Mondaca, M. Pérez-Moya and H. D. Mansilla, J. Hazard. Mater., 2010, 177, 1025–1030 CrossRef CAS PubMed.
- Y. Gao, H. Gao, G. Zhang and Y. Zhang, Chem. Eng. J., 2013, 217, 221–230 CrossRef CAS.
- A. Zhang, N. Zhang, J. Zhou, P. Jiang and G. Liu, J. Hazard. Mater., 2012, 201, 68–73 CrossRef PubMed.
- A. Zhang, N. Huang, C. Zhang, P. Zhao, T. Lin, Y. He and J. Feng, Chem. Eng. J., 2018, 344, 1–11 CrossRef CAS.
- H. Dai, S. Xu, J. Chen, X. Chen and J. Zhu, Chemosphere, 2018, 199, 147–153 CrossRef CAS PubMed.
- G. Zhang, Y. Gao, Y. Zhang and Y. Guo, Environ. Sci. Technol., 2010, 44, 6384–6389 CrossRef CAS PubMed.
- S. Luo, P. Qin, J. Shao, L. Peng, Q. Zeng and J. Gu, Chem. Eng. J., 2013, 223, 1–7 CrossRef CAS.
- N. Wang, L. Zhu, M. Lei, Y. She, M. Cao and H. Tang, ACS Catal., 2011, 1, 1193–1202 CrossRef CAS.
- G. Subramanian and G. Madras, Water Res., 2016, 104, 168–177 CrossRef CAS PubMed.
- G. Zhang, Q. Wang, W. Zhang, T. Li, Y. Yuan and P. Wang, Photochem. Photobiol. Sci., 2016, 15, 1046–1053 RSC.
- G. Zhou, J. Guo, G. Zhou, X. Wan and H. Shi, J. Environ. Sci., 2016, 47, 63–70 CrossRef CAS PubMed.
- F. Gulshan, S. Yanagida, Y. Kameshima, T. Isobe, A. Nakajima and K. Okada, Water Res., 2010, 44, 2876–2884 CrossRef CAS PubMed.
- C. Zhao, L. Arroyo-Mora, A. DeCaprio, V. Sharma, D. Dionysiou and K. O'Shea, Water Res., 2014, 67, 144–153 CrossRef CAS PubMed.
- J. Monteagudo, A. Durán, M. Aguirre and I. San Martín, Chem. Eng. J., 2010, 162, 702–709 CrossRef CAS.
- J. Ma, W. Ma, W. Song, C. Chen, Y. Tang and J. Zhao, Environ. Sci. Technol., 2006, 40, 618–624 CrossRef CAS PubMed.
- J. Li, J. Wang, G. Zhang, Y. Li and K. Wang, Appl. Catal., B, 2018, 234, 167–177 CrossRef CAS.
- S. Guo, H. Wang, W. Yang, H. Fida, L. You and K. Zhou, Appl. Catal., B, 2020, 262, 118250 CrossRef CAS.
- X. Zhou, H. Yang, C. Wang, X. Mao, Y. Wang, Y. Yang and G. Liu, J. Phys. Chem. C, 2010, 114, 17051–17061 CrossRef CAS.
- J. Wang, X. Li, Q. Cheng, F. Lv, C. Chang and L. Zhang, Carbohydr. Polym., 2020, 229, 115470 CrossRef PubMed.
- S. Liu and J. Yu, J. Solid State Chem., 2008, 181, 1048–1055 CrossRef CAS.
- M. Pichowicz and R. Mokaya, Chem. Mater., 2004, 16, 263–269 CrossRef CAS.
- L. Yan, Y. Xu, H. Yu, X. Xin, Q. Wei and B. Du, J. Hazard. Mater., 2010, 179, 244–250 CrossRef CAS PubMed.
- Y. Mu, X. Jiang, Z. Ai, F. Jia and L. Zhang, J. Hazard. Mater., 2018, 343, 356–363 CrossRef CAS PubMed.
- S. Guo, G. Zhang and J. Wang, J. Colloid Interface Sci., 2014, 433, 1–8 CrossRef CAS PubMed.
- Y. Gao, H. Gan, G. Zhang and Y. Guo, Chem. Eng. J., 2013, 217, 221–230 CrossRef CAS.
- J. Lin, M. Sun, X. Liu and Z. Chen, Chemosphere, 2017, 184, 664–672 CrossRef CAS PubMed.
- B. Zhang, Y. Hou, Z. Yu, Y. Liu, J. Huang, L. Qian and J. Xiong, Sep. Purif. Technol., 2019, 210, 60–68 CrossRef CAS.
- S. Liu, L. Feng, N. Xu, Z. Chen and X. Wang, Chem. Eng. J., 2012, 203, 432–439 CrossRef CAS.
- X. Wu, W. Zhao, Y. Huang and G. Zhang, Chem. Eng. J., 2020, 381, 122768 CrossRef CAS.
- C. Xiao, J. Li and G. Zhang, J. Cleaner Prod., 2018, 180, 550–559 CrossRef CAS.
- M. Dindarsafa, A. Khataee, B. Kaymak, B. Vahid, A. Karimi and A. Rahmani, Ultrason. Sonochem., 2017, 34, 389–399 CrossRef CAS PubMed.
- X. Han, T. Chen, J. Li, F. Cheng, M. Zhang and M. Guo, J. Photochem. Photobiol., A, 2020, 390, 112308 CrossRef CAS.
- H. Sun, X. Yang, L. Zhao, T. Xu and J. Lian, J. Mater. Chem. A, 2016, 4, 9455–9465 RSC.
- X. Hou, X. Huang, F. Jia, Z. Ai, J. Zhao and L. Zhang, Environ. Sci.
Technol., 2017, 51, 5118–5126 CrossRef CAS PubMed.
- M. Munoz, Z. Pedro, J. Casas and J. Rodriguez, Appl. Catal., B, 2015, 176–177, 249–265 CrossRef CAS.
- J. Hu, P. Zhang, W. An, L. Liu, Y. Liang and W. Cui, Appl. Catal., B, 2019, 245, 130–142 CrossRef CAS.
- Y. Qin, F. Song, Z. Ai, P. Zhang and L. Zhang, Environ. Sci. Technol., 2015, 49, 7948–7956 CrossRef CAS PubMed.
- S. Liu, L. Feng, N. Xu, Z. Chen and X. Wang, Chem. Eng. J., 2012, 203, 432–439 CrossRef CAS.
- M. Balmer and B. Sulzberger, Environ. Sci. Technol., 1999, 33, 2418–2424 CrossRef CAS.
- Q. Lan, F. Li, C. Sun, C. Liu and X. Li, J. Hazard. Mater., 2010, 174, 64–70 CrossRef CAS PubMed.
- Q. Lan, H. Liu, F. Li, F. Zeng and C. Liu, Chem. Eng. J., 2011, 168, 1209–1216 CrossRef CAS.
Footnote |
| † Electronic supplementary information (ESI) available. See DOI: 10.1039/d0ra03361h |
|
| This journal is © The Royal Society of Chemistry 2020 |
Click here to see how this site uses Cookies. View our privacy policy here.  Open Access Article
 *,
Dan Chen,
Yang Zhang,
Hongxin Chen and
Yueli Huang
![[thin space (1/6-em)]](https://www.rsc.org/images/entities/char_2009.gif) sin
sin![[thin space (1/6-em)]](https://www.rsc.org/images/entities/char_2009.gif) θ), the lattice fringes of the K–Fe samples on the (110) and (003) crystal planes were 0.03 nm and 0.01 nm higher than those of the kaolin samples, respectively. The XRD patterns of the K–xFe (x = 0, 2, 4, and 6) samples are shown in Fig. S1a;† the patterns of all the samples were found to be shifted towards lower angles. These results revealed that the lattice fringe spacing of the K–Fe lattice was enhanced.26,27
θ), the lattice fringes of the K–Fe samples on the (110) and (003) crystal planes were 0.03 nm and 0.01 nm higher than those of the kaolin samples, respectively. The XRD patterns of the K–xFe (x = 0, 2, 4, and 6) samples are shown in Fig. S1a;† the patterns of all the samples were found to be shifted towards lower angles. These results revealed that the lattice fringe spacing of the K–Fe lattice was enhanced.26,27


 (eqn (10)) and they further reacted with H+ to generate H2O2 (eqn (11) and (12)), which guaranteed a sufficient supply of ·OH. In addition, a small proportion of Fe(III) on the surface of the K–Fe catalyst was photo-reduced to surface Fe(II) and the surface Fe(II) reacted directly with H2O2 to form the hydroxyl radicals (eqn (13) and (14)). At last, the formed ·OH radicals attacked the RhB molecules adsorbed on the surface of the K–Fe catalyst and several intermediates with phenyl group were subsequently produced, which were further degraded to CO2 and H2O (eqn (15)). The degradation pathway is depicted in Fig. S6.†
![[triple bond, length as m-dash]](https://www.rsc.org/images/entities/char_e002.gif) FeIII + nC2O42− → [
FeIII + nC2O42− → [![[triple bond, length as m-dash]](https://www.rsc.org/images/entities/char_e002.gif) FeIII(C2O4)n]3−2n
FeIII(C2O4)n]3−2n
![[triple bond, length as m-dash]](https://www.rsc.org/images/entities/char_e002.gif) FeIII(C2O4)n]3−2n + hν → [
FeIII(C2O4)n]3−2n + hν → [![[triple bond, length as m-dash]](https://www.rsc.org/images/entities/char_e002.gif) FeII(C2O4)n−1]4−2n + C2O4˙−
FeII(C2O4)n−1]4−2n + C2O4˙−
![[triple bond, length as m-dash]](https://www.rsc.org/images/entities/char_e002.gif) FeII(C2O4)n−1]4−2n + H2O2 → [
FeII(C2O4)n−1]4−2n + H2O2 → [![[triple bond, length as m-dash]](https://www.rsc.org/images/entities/char_e002.gif) FeIII(C2O4)n−1]5−2n + ·OH + OH−
FeIII(C2O4)n−1]5−2n + ·OH + OH−
![[triple bond, length as m-dash]](https://www.rsc.org/images/entities/char_e002.gif) FeIII + hν →
FeIII + hν → ![[triple bond, length as m-dash]](https://www.rsc.org/images/entities/char_e002.gif) FeII
FeII
![[triple bond, length as m-dash]](https://www.rsc.org/images/entities/char_e002.gif) FeII + H2O2 →
FeII + H2O2 → ![[triple bond, length as m-dash]](https://www.rsc.org/images/entities/char_e002.gif) FeIII + ·OH + OH−
FeIII + ·OH + OH−


