DOI:
10.1039/D0RA03394D
(Paper)
RSC Adv., 2020,
10, 24542-24548
A LSER-based model to predict the solubilizing effect of drugs by inclusion with cucurbit[7]uril†
Received
16th April 2020
, Accepted 18th June 2020
First published on 26th June 2020
Abstract
A large number of traditional drugs and the development of new drugs often encounter the problem of poor water solubility. Cucurbit[7]uril, a novel macrocyclic host, has attracted great interest in this field. Investigating the solubilizing effect of drugs by inclusion with cucurbit[7]uril could provide guidance for drug solubilization. In this work, the interactions of drugs with cucurbit[7]uril, drugs with water and the inclusion complexes with water, and the properties of drugs and inclusion complexes, are considered to establish a linear solvation energy relationships (LSER)-based model. This model could be applied to predicting the solubility of drugs with cucurbit[7]uril in water. Density functional theory (DFT) is employed to obtain the properties and interaction parameters. The multi-parameter solubility model obtained by stepwise regression shows good fitting and predicting results. And the surface area of inclusion complexes (A3), the LUMO energy of inclusion complexes (E3LUMO), the polarity index of inclusion complexes (I3), the electronegativity of drugs (χ1), and the oil–water partition coefficient of drugs (log![[thin space (1/6-em)]](https://www.rsc.org/images/entities/char_2009.gif) p1w) are effective parameters related to the solubilization of drugs with cucurbit[7]uril. Futhermore, the model could be extended to calculate the solubilizing effect of other macrocycles.
p1w) are effective parameters related to the solubilization of drugs with cucurbit[7]uril. Futhermore, the model could be extended to calculate the solubilizing effect of other macrocycles.
1. Introduction
The challenge for the pharmaceutical industry is that about 40% of the top 200 drugs in the US are poorly soluble in water; and in the new chemical entity (NCE), the proportion of poorly water soluble drugs reached 90%.1 Therefore, it is important to develop methods for improving their solubility. Now, many techniques have been employed to solve this problem, such as solid dispersion technology, synthetic prodrug technology, inclusion technology and so on. And the inclusion complexes technology could not only maintain the original properties and effects of drugs, but also improve their stability and bioavailability.2 Although cyclodextrin is widely studied and used as a complexing agent,3 it shows some shortcomings for practical application. For example, it would be easily hydrolyzed under acidic media, and the binding constant of cyclodextrin (including hydroxypropyl-β-cyclodextrin and sulfobutylether-β-cyclodextrin) is found to be lower than 105 M−1 in water.4,5 Cucurbit[n]uril (n = 5–8, 10), another new macrocyclic host, shows good stability in both strong acid and weak alkaline solution.6 In addition, cucurbit[n]uril exhibits much higher binding constant up to 1015 M−1 in water.7 So cucurbit[n]uril has attracted widespread attention due to its high selectivity and affinity with guest.8,9
Cucurbit[n]uril (n = 5–8, 10), the symmetrical macrocyclic cage compounds, formed by a series of glycoluril through methylene linkage, have a hydrophilic portal and hydrophobic cavity. Compared with other cucurbit[n]uril host, cucurbit[7]uril has relatively high solubility in water (20–30 mM or 23–35 g L−1).10 Although the solubility of drugs by inclusion with cucurbit[7]uril could be confirmed through experiment to identify effective drug candidates,11 it has certain limitations in terms of cost, time and resources. Instead of, theoretical prediction method could quickly and efficiently screen out drugs with good solubilizing effect by cucurbit[7]uril. However, there is few theoretical study on the solubilizing effect of cucurbit[7]uril on drugs, which hinders its extensive application in the pharmaceutical industry. As an alternative, it was reported that linear solvation energy relationships (LSER) could be used to calculate the solubility of various compounds in water.12–14 But there was no LSER-based model for predicting the solubility of drugs with cucurbit[7]uril in water.
Therefore, the purpose of this study is to establish a suitable LSER-based model to predict the solubilizing effect of cucurbit[7]uril on drugs with poor water solubility. In line with this, the interactions of drugs with cucurbit[7]uril, drugs with water and the inclusion complexes with water, the properties of drugs and inclusion complexes, are analysed for the LSER-based model establishment. Then DFT is applied for calculating all the parameters. On one hand, this model could quickly screen out drugs with good solubilizing effect by cucurbit[7]uril. On the other hand, the model would provide guidance for the modification of cucurbit[n]uril after clarifying the solubilizing mechanism.
2. Materials and methods
2.1 Experiment and data set
To obtain the experimental solubility data of drugs, excess drugs (VB2, triamterene, guanine, 2-hydroxychalcone, gefitinib) were added to 10 mL of aqueous solutions containing various concentrations of cucurbit[7]uril (0–15.0 mM or 0–17.4 g L−1). The samples were vibrated for 1 h on an ultrasonic equipment and then stirred at room temperature in dark until equilibrium was reached (24 h). Afterwards, samples were filtered and diluted with H2O for UV-vis spectroscopic measurement. The ultraviolet absorption peaks (VB2, at 446 nm; triamterene, at 358 nm; guanine, at 295 nm; 2-hydroxychalcone, at 323 nm; gefitinib, at 335 nm) were measured on a ThermoEvolution 220 spectrophotometer. The experimental solubility data of drugs with cucurbit[7]uril in water and logarithm of solubility are listed in Table 1. Note that the data for drugs signed with a was measured by UV-vis spectroscopy approach in this work which was shown in Fig. S1–S6.† The solubility data for the rest of drugs are collected from publications.
Table 1 Experimental solubility data of drugs by inclusion with cucurbit[7]uril in water
| Drug |
S/g L−1 |
S/μM |
logS/μM |
| The data for drugs that was measured by UV-vis spectroscopy approach. |
| Cinnarizine15 |
5.049 |
13700.000 |
4.137 |
| Allopurinol16 |
1.200 |
8816.000 |
3.945 |
| MEABZ17 |
2.259 |
7300.000 |
3.863 |
| Albendazole1 |
1.884 |
7100.000 |
3.851 |
| Thiabendazole18 |
0.968 |
4810.000 |
3.682 |
| 6-Benzyladenine19 |
1.023 |
4540.000 |
3.657 |
| Gefitiniba |
1.734 |
3880.891 |
3.589 |
| Kinetin20 |
0.820 |
3810.000 |
3.581 |
| Nandrolone11 |
1.015 |
3700.000 |
3.568 |
| Norharmane21 |
0.622 |
3700.000 |
3.568 |
| Triamterenea |
0.923 |
3643.070 |
3.561 |
| 2-Hydroxychalconea |
0.405 |
1807.433 |
3.257 |
| Vitamin B9 (VB9)a |
0.730 |
1654.000 |
3.219 |
| Fuberidazole22 |
0.265 |
1440.000 |
3.158 |
| 10-Hydroxycamptothecine23 |
0.475 |
1303.000 |
3.115 |
| Prednisolone11 |
0.458 |
1137.000 |
3.056 |
| Clofazimine24 |
0.514 |
1085.000 |
3.035 |
| β-Estradiol11 |
0.295 |
1083.000 |
3.035 |
| Vitamin B2 (VB2)a |
0.353 |
937.862 |
2.972 |
| 3-Cyano-6-(2-thienyl)-4-trifluoromethyl pyridine (TFP)25 |
0.249 |
924.000 |
2.966 |
| Progesterone11 |
0.223 |
708.000 |
2.850 |
| Cholic acid11 |
0.287 |
702.000 |
2.846 |
| Cortisol11 |
0.246 |
680.000 |
2.833 |
| TPP26 |
0.357 |
580.018 |
2.763 |
| Guaninea |
0.082 |
540.489 |
2.733 |
| Estriol11 |
0.149 |
516.000 |
2.713 |
| Estrone11 |
0.136 |
504.000 |
2.702 |
| TPPZn26 |
0.306 |
451.377 |
2.655 |
| Camptothecin1 |
0.139 |
400.000 |
2.602 |
| Coumarin 6 (ref. 27) |
0.131 |
375.000 |
2.574 |
| Megestrol acetate11 |
0.137 |
369.000 |
2.567 |
| Zaltoprofen28 |
0.076 |
254.000 |
2.405 |
| Cholesterol11 |
0.017 |
45.000 |
1.653 |
| Estradiol-3-benzoate11 |
0.014 |
36.000 |
1.556 |
| 17-Ethinyl estradiol11 |
0.009 |
30.000 |
1.477 |
2.2 Establishment of LSER-based model
The original model of LSER describes the linear relationship between molecular property and the solubility of a solute–solvent system; it could be expressed by eqn (1):29–32| | |
logY = c + x1X1 + x2X2 + x3X3
| (1) |
where Y represents the physical and chemical properties of molecules, such as solubility, toxicity, activity; X1, X2, X3 are the properties-related parameters; x1, x2, x3 are the parameters-related coefficients; c is a constant. The LSER model reported in literature, studying the solubility of various molecules in water, could be described as follows:33–38| | |
logS = c + vD + eE + iL
| (2) |
where S is the solubility of molecules; D is the molecular dimension; E is the molecular interaction; L represents the macroscopic properties of molecules.
Generally, the solubility could be predicted by the solute–solvent intermolecular forces, but it was not sufficient to calculate the solubility of inclusion complexes. For the inclusion system in water, with respect to the main molecular parameters influencing the solubility could be divided into three categories as shown in Fig. 1. The first is the molecular interaction between the drugs and cucurbit[7]uril, where the interaction energy should be considered, involving the van der Waals' force, hydrogen bond and other forces. Cucurbit[7]uril mainly bonds with various organic molecules through the hydrophobic interaction of the cavity and the hydrogen bonding of the carbonyl groups at both ends.39 The second is the molecular interaction between inclusion complexes and water. For this the solvation energy is directly obtained instead of the van der Waals' force and hydrogen bond should be also considered.40 The third is the interaction between drugs and water, where the oil–water partition coefficient of drugs directly indicates the dissolution of drugs in water.33 Besides the main parameters mentioned above, the molecular dimensions are considered in model, such as the size of inclusion complexes and the drug size. Accordingly, we propose a LSER-based model for the drug–cucurbit[7]uril–water system:
| | |
logS = c + d1D1 + d3D3 + e12ΔE12 + h12H12 + e3wΔG3w + w3wW3w + h3wH3w + p1wlogp1w
| (3) |
where subscript 1 represents drugs; 2 represents cucurbit[7]uril; 3 represents the drug–cucurbit[7]uril inclusion complexes; 12 represents the interaction between drug and cucurbit[7]uril; 3w refers to the inclusion complexes in water.
D1 is the size of drugs;
D3 is the size of inclusion complexes; Δ
E12 represents the interaction energy between drugs and cucurbit[7]uril;
H12 indicates the hydrogen bond between drugs and cucurbit[7]uril; Δ
G3w is the solvation energy of inclusion complexes;
W3w represents the van der Waals' force between inclusion complexes and water;
H3w represents the hydrogen bond between inclusion complexes and water; log
p1w is the oil–water distribution coefficient of drugs.
d1,
d3,
e12,
h12,
e3w,
w3w,
h3w,
p1w are parameter-related coefficients;
c is a constant.
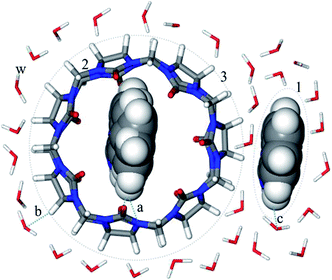 |
| | Fig. 1 Design of parameters related to the solubility of drugs in presence of cucurbit[7]uril ((a) interaction between the drugs and cucurbit[7]uril; (b) interaction between the inclusion complexes and water; (c) the drugs in water; 1: drugs; 2: cucurbit[7]uril; 3: inclusion complexes; w: water). | |
The parameters in eqn (3) could be replaced by quantum chemical parameters as shown in eqn (4):
| | |
logS = c + v1V1 + a3A3 + e12ΔE12 + x1χ1 + e3wΔG3w + m3I3 + g3E3LUMO + p1wlogp1w
| (4) |
where the volume of drugs (
V1) is used to identify
D1 in
eqn (3). The surface area of inclusion complexes (
A3) is applied to
D3 in
eqn (3).
H12 in
eqn (3) is replaced by the electronegativity of drugs (
χ1). According to the HOMO/LUMO electron distribution diagram of inclusion complexes, it is known that LUMO is distributed on cucurbit[7]uril.
41,42 The LUMO energy of inclusion complexes (
E3LUMO) is applied to
H3w in
eqn (3).
43 Generally, water is electron donor, and
E3LUMO is electron acceptor, so
E3LUMO describes the hydrogen bond between inclusion complexes and water. The polarity of inclusion complexes (
I3) is applied to
W3w in
eqn (3).
44
2.3 Calculation details
The chemical structures of all drug molecules are optimized using the Gaussian software (version 09, Gaussian, Inc., http://gaussian.com, USA), in which the B3LYP functional method is applicable to calculating molecular properties. The structures of the inclusion complexes of cucurbit[7]uril with various drugs are optimized at the B3LYP/6-311G* level. And frequency calculations are performed on the same level for all possible geometries to ensure they are minimal on the potential surface (Fig. S7†). Solvation effects were evaluated by employing the solvation model based on density (SMD).
The interaction energy between drugs and cucurbit[7]uril (ΔE12) and the solvation energy of inclusion complexes (ΔG3w) are calculated respectively by eqn (5) and (6):
| | |
ΔE12 = E3 − E2 − E1 + EBSSE
| (5) |
where
E3 represents the total energy of inclusion complexes;
E2 is the total energy of cucurbit[7]uril;
E1 is the total energy of drugs;
EBSSE represents the basic set superposition error;
E3sol represents the single-point energy of inclusion complex calculated in water;
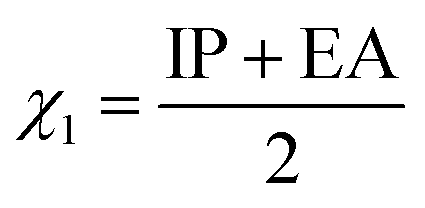
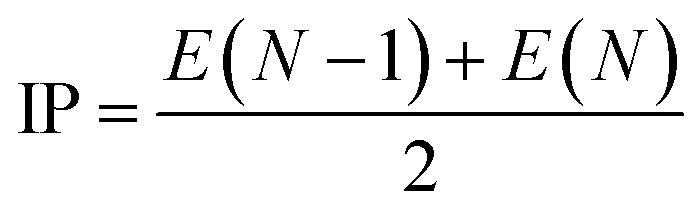
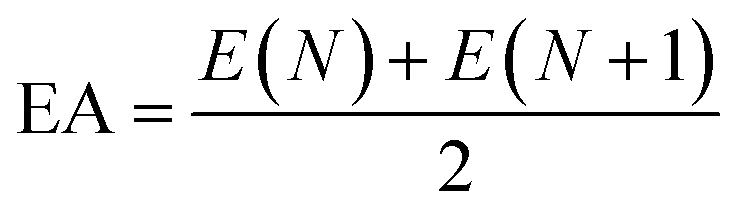
E3gas represents the single-point energy of inclusion complex calculated under the gas phase. The single point energy is calculated at the M062X/6-311G* level. The electronegativity of drugs (
χ1) is calculated by
eqn (7)–(9):
| |
 | (7) |
| |
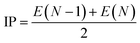 | (8) |
| |
 | (9) |
where IP is the ionization energy and EA is the electron affinity, the single point energy is calculated using B3LYP/6-311G*,
N is the number of electrons when electrically neutral.
The E3LUMO parameter in eqn (4) is obtained from the optimized structure. The parameter of logp1w is obtained from the Material Studio software (version 8.0, Accelrys Inc., http://www.accelrys.com, USA). The parameters I3, A3 and V1 are obtained in combination with the Multiwfn software,44 where the electron density is 0.001 a.u. (electrons per bohr3) contour surface.
The fitting coefficient (R2), leave-one-out cross-validation correlation coefficient (QLOO2), F-test, t-test, inflation factor (VIF), and Durbin–Watson coefficient (DW) are employed to validate the LSER-based model by using the SPSS software (version 25.0, SPSS Inc., http://www.spss.com).45 External test is applied to the prediction effect and application domain of the predication model, not used for building the LSER model. As reported,46,47 when the predictive squared correlation coefficient (QF12, QF32) is greater than 0.600, and the concordance correlation coefficient (CCC) is greater than 0.850, it is a successful model for prediction.
| |
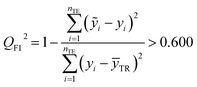 | (10) |
| |
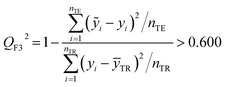 | (11) |
| |
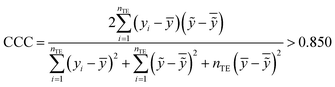 | (12) |
where
yi and
ỹi are the experimental and calculated values, respectively;
ȳTR is the average of the experimental values of the training set;

is the average of the calculated values;
nTR and
nTE are the numbers of samples in the training and test sets, respectively.
3. Results and discussion
3.1 Modelling results
From DFT, the parameters of drugs–cucurbit[7]uril inclusion complexes are shown in Table S1.† In this study, the solubility of drugs obtained from literature are applied as the training set to build the LSER model, and the solubility of drugs (7, 11, 12, 19, 25) experimentally measured in this work are used as the test set.
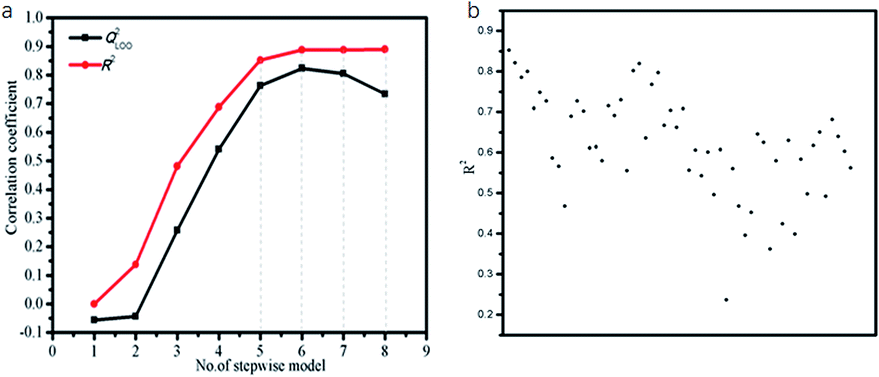
To select most informative parameters and exclude redundant ones, the multiple linear stepwise regression was employed with logS as the dependent variable (Table 1) and the quantum-chemical parameters (Table S1†) as the independent variables. The fitting coefficient (R2) and the leave-one-out cross-validation correlation coefficient (QLOO2) are used to determine the optimum number of parameters for the LSER-based model. If both R2 and QLOO2 are greater than 0.600,45 at the same time with R2–QLOO2 less than 0.300, this model would meet the criterion of “good model” proposed by Eriksson et al.48 Fig. 2a showed the performance of the model is not significantly improved when the parameters exceed six (the order of 1–8 parameter selection is based on the parameter's contribution rate: A3, E3LUMO, logp1w, I3, χ1, ΔE12, V1, ΔG3w). Five parameters are randomly selected for fitting. According to Fig. 2b, A3, E3LUMO, logp1w, I3, χ1 has the largest fitting coefficient.
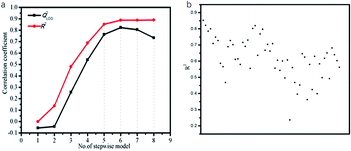 |
| | Fig. 2 (a) The plot of model performance vs. number of variables included in LSER model. (b) The plot of fitting coefficient vs. different five parameters included in LSER model. | |
Therefore, the five-parametric model (eqn (13)) is finally determined as the optimum LSER-based model after evaluating the fitting coefficient, cross-validation (Fig. 2), and correlation of the parameters (Table 4).
| |
 | (13) |
The five parameters includes the surface area of inclusion complexes (A3), the electronegativity of drugs (χ1), the polarity index of inclusion complexes (I3), the LUMO energy of inclusion complexes (E3LUMO), the oil–water partition coefficient of drugs (logp1w).
This model confirmed an acceptable relationship between the number (5) of variables and the number (30) of drugs, where the ratio of the number of variables to the number of drugs is greater than 5:1.49 According to Table 2, the fitting coefficient (R2) of the LSER-based model is 0.852, which is much larger than 0.600. And the root-mean-square error is 0.254, which is relatively small.
Table 2 Various statistics parameters of the LSER-based model
| ma |
nTRb |
nTEc |
R2d |
RMSETRe |
QLOO2f |
| Number of descriptors applied for the model development. Number of molecules in training set. Number of molecules in test set. Training correlation coefficient. Training root mean square error. Leave-one-out cross-validation correlation coefficient. Leave-one-out cross-validation root-mean-square errors. F-Test. Durbin–Watson coefficient. |
| 5 |
30 |
5 |
0.852 |
0.254 |
0.763 |
| RMSEcvg |
Fh |
DWi |
QF12 |
QF32 |
CCC |
| 0.322 |
2.678 |
1.402 |
0.710 |
0.890 |
0.863 |
In order to determine whether there are “outliers” in the LSER-based model, a cross-validation method is used for testing. The high value of correlation coefficient of leave-one-out (QLOO2 = 0.763) and the acceptable value of cross validation root mean square error (RMSEcv = 0.322) prove the stability of the LSER-based model. In addition, R2–QLOO2 is 0.089, less than 0.3, which meets the criterion of “good model”. Therefore, it is further confirmed that the established LSER-based model is reliable.
Generally, P < 0.050 indicates that this parameter has an effect on the model. According to Table 3, it is known that the P value of each parameter is close to 0.000, indicating that these five parameters have a significant effect on the LSER-based model. The unstandardized coefficients in Table 3 are used to construct the equation. The standardized coefficient is dimensionless, which reflects their influence on logS, and the order is as follows: A3 > E3LUMO > I3 > χ1 > logp1w.
Table 3 Standardized and unstandardized coefficients of the LSER-based model (eqn (13)), and their t and p values
| # |
Unstandardized coefficients |
Standardized coefficients |
t-Value |
p-Value |
| c |
−16.452 |
— |
−7.659 |
0.000 |
| χ1 |
14.301 |
0.659 |
5.160 |
0.000 |
| logp1w |
−1.119 |
−0.399 |
−3.296 |
0.003 |
| A3 |
22.859 |
1.513 |
10.003 |
0.000 |
| E3LUMO |
2.898 |
0.846 |
5.253 |
0.000 |
| I3 |
20.347 |
0.823 |
5.927 |
0.000 |
Table 4 also showed that the values of the inflation factor VIF are all less than 10, indicating that each parameter is relatively independent and there is no collinearity problem. In addition, the statistical QF12, QF32 and CCC are 0.710, 0.890 and 0.863, respectively, in accordance to the eqn (10)–(12). This confirmed the good external predictive ability of the LSER-based model. The results show the proposed model could be employed to predict the solubilizing effect of cucurbit[7]uril for other drugs.
Table 4 Correlation coefficient between the parameters of LSER-based model (eqn (13)) and their VIF values
| |
χ1 |
logp1w |
A3 |
E3LUMO |
I3 |
VIF |
| χ1 |
1 |
−0.364 |
−0.107 |
−0.485 |
−0.096 |
2.650 |
| logp1w |
|
1 |
0.670 |
−0.357 |
−0.569 |
2.381 |
| A3 |
|
|
1 |
−0.639 |
−0.767 |
3.714 |
| E3LUMO |
|
|
|
1 |
0.708 |
4.209 |
| I3 |
|
|
|
|
1 |
3.130 |
The calculated logS data obtained from eqn (13) and the relative error are listed in Table 5, and the RE (|logScalculation − logSexperimental|/logSexperimental) are closed to 0.000. Fig. 3 indicates the LSER-based model is highly matched with the experimental values, where the data points are on both sides of the diagonal line and are close to the line. The dots represent the data points in the training set, and the triangles represent the data points in the test set.
Table 5 The calculated logS data obtained from eqn (13) and the relative error (RE)
| # |
logS/μM |
RE |
| Progesterone |
2.791 |
−2.057% |
| Nandrolone |
3.259 |
−8.671% |
| Megestrol acetate |
2.334 |
−9.096% |
| Cortisol |
3.214 |
13.475% |
| Estrone |
2.845 |
5.293% |
| β-Estradiol |
3.456 |
13.870% |
| 17-Ethinyl estradiol |
1.889 |
27.915% |
| Estradiol-3-benzoate |
1.472 |
−5.447% |
| Prednisolone |
3.173 |
3.849% |
| Estriol |
2.894 |
6.695% |
| Cholesterol |
1.627 |
−1.571% |
| Cholic acid |
3.186 |
11.922% |
| Norharmane |
3.599 |
0.875% |
| Albendazole |
3.556 |
−7.665% |
| MEABZ |
3.525 |
−8.761% |
| Thiabendazole |
3.488 |
−5.274% |
| Fuberidazole |
3.424 |
8.400% |
| Allopurinol |
3.571 |
−9.477% |
| 6-Benzyladenine |
3.357 |
−8.210% |
| Camptothecin |
2.275 |
−12.556% |
| 10-Hydroxycamptothecine |
2.965 |
−4.800% |
| Kinetin |
3.732 |
4.223% |
| TPP |
2.934 |
6.183% |
| TPPZn |
2.768 |
4.267% |
| TFP |
3.266 |
10.118% |
| Clofazimine |
2.606 |
−14.150% |
| Cinnarizine |
3.971 |
−4.008% |
| Coumarin 6 |
2.518 |
−2.181% |
| Zaltoprofen |
2.465 |
2.501% |
| VB9 |
3.469 |
7.772% |
| VB2 |
2.938 |
−1.164% |
| Guanine |
2.459 |
−10.008% |
| 2-Hydroxychalcone |
3.131 |
−3.878% |
| Triamterene |
3.188 |
−10.475% |
| Gefitinib |
3.683 |
2.623% |
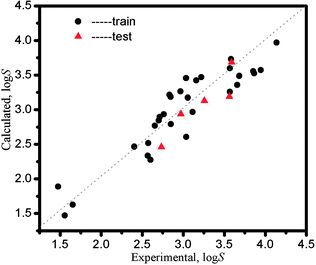 |
| | Fig. 3 The plot of calculated solubility values from the LSER-based model vs. the experimental solubility values. | |
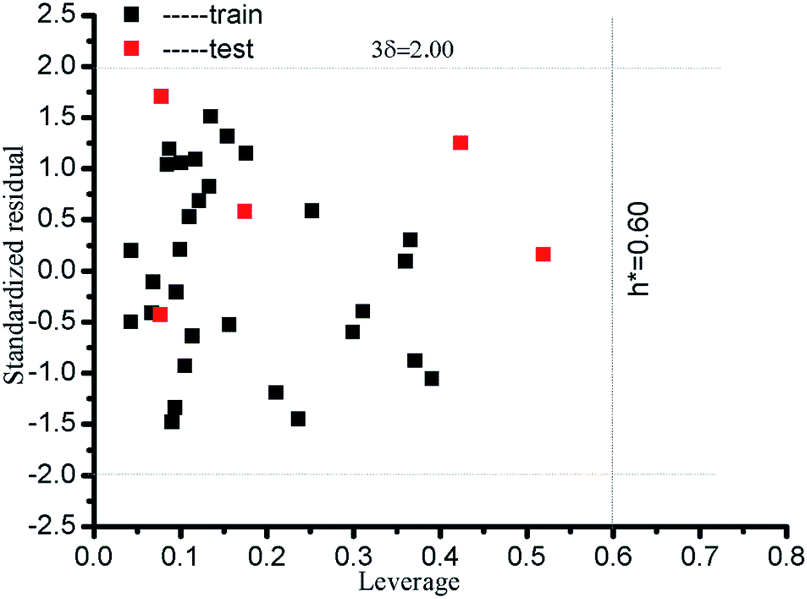
3.2 Applicability domain
Applicability domain (AD) is defined to prove that the model has a satisfactory accuracy. The standardized residual (δ*) is an important criterion, within the ±3 times the standards deviation (±3δ).50 In addition to standardized residuals in the AD, leverage (hi) is a common metric to evaluate the model accuracy.| |
 | (14) |
where xi is column vector of the i-th drug parameter; X is 30 × 5 matrix of training set parameters; m is considered to be the number of descriptors (here m = 5); nTR is the number of drugs in the training set (here nTR = 30); h* defines a warning value for leverage. Therefore, the warning value h* of the LSER-based model (eqn (13)) is equal to 0.600. Fig. 4 shows that the standardized residuals of all drugs are in the acceptable range of (±3δ) and the leverage of all drugs is located within the defined AD. From the results, the proposed LSER-based model shows acceptable AD ranges.
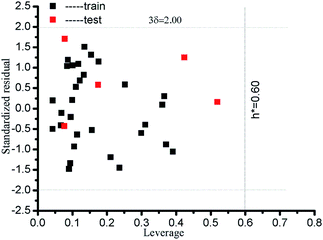 |
| | Fig. 4 Presentation of AD for all drugs by the LSER-based model using a Williams plot. The leverage (h*) and standardized residual (δ*) are shown by dashed lines on the x-axis and y-axis, respectively. | |
3.3 Parameter analysis and interpretation
According to the proposed LSER model, solubilizing mechanism of cucurbit[7]uril could be explored.
(a) The coefficient of the surface area of inclusion complexes is a3 = 22.859, where the parameter A3 has a positive correlation with logS. It indicates that the large surface area of inclusion complexes would promote the interaction between inclusion complexes and water solvent. Thus the solubility of inclusion complexes increases.
(b) The coefficient of the LUMO energy of inclusion complexes is g3 = 2.898, where the parameter E3LUMO has a positive correlation with logS. The LUMO energy indicates the ability of a molecule to accept electron pairs from neighbouring molecule. With larger LUMO energy, inclusion complexes could be easier to form hydrogen bonds with water, which enhances the solubility of inclusion complexes.
(c) The coefficient of the polarity index of inclusion complexes is m3 = 20.347, where the parameter I3 has a positive correlation with logS. When the polarity index is larger, the interaction with polar water molecules would be stronger. Then the solubility of inclusion complexes increases.
(d) The coefficient of the electronegativity of drugs χ1 = 14.301, where the parameter χ1 has a positive effect with logS. According to the HOMO/LUMO orbital electron distribution diagram of inclusion complexes, it is known that LUMO is distributed on cucurbit[7]uril. If the drugs possess stronger electronegativity, it would be easier to form hydrogen bonds between the drugs and cucurbit[7]uril. Thus it increases the possibility for drugs entering the cavity of cucurbit[7]uril.
(e) The coefficient of the drug oil–water partition coefficient p1w = −1.119, where the parameter logp1w has a negative correlation with logS. The oil–water partition coefficient mainly reflects the hydrophobic of drugs. This shows that the more hydrophobic the drug is, the stronger the repelling interaction will be in the mixed system. Then it is harder to dissolve in water and the solubility of drug decreases.
Based on the above analysis, it is concluded that the surface area of inclusion complexes (A3), the LUMO energy of inclusion complexes (E3LUMO), the polarity index of inclusion complexes (I3), the electronegativity of drugs (χ1), and the oil–water partition coefficient of drugs (logp1w) significantly affect the solubility of drugs by inclusions with cucurbit[7]uril.
3.4 Test on other macrocycles
As reported, for MEABZ the highest solubilities was obtained with cucurbit[6]uril (2.4 mM or 0.7 g L−1), cucurbit[7]uril (7.3 mM or 2.3 g L−1) and cucurbit[8]uril (9.4 mM or 2.9 g L−1).17 Although the model was developed for predicting the solubilizing property of cucurbit[7]uril, this work is mainly to build a model suitable for inclusion system. So to show the generality of the proposed model, the utilized parameters in LSER model were used to check the solubility of other macrocycles. According to Table 6, it could be found that the solubility of MEABZ with cucurbit[8]uril calculated from eqn (13) is close to the experimental solubility, and the overall trend is in accordance to the data reported in the literature. Thus it is possible to use this model for other macrocycles, such as cucurbit[8]uril or cucurbit[6]uril.
Table 6 The calculated logS data obtained from eqn (13) and the experimental solubility data
| |
logSCal |
logSExp |
RE |
| Cucurbit[8]uril |
3.973 |
4.630 |
16.533% |
| Cucurbit[7]uril |
3.863 |
3.525 |
−8.761% |
| Cucurbit[6]uril |
3.380 |
1.450 |
−57.117% |
4. Conclusions
In this study, we proposed a LSER-based model by analysing different sorts of molecular parameters combined with the experimental solubility data of 35 drugs by inclusion with cucurbit[7]uril. The reported data of 30 drugs are applied as the training sets, while the rest data of 5 drugs are used as the test sets. Results show that the proposed model has good fitting and prediction ability. The model suggests that the solubility of inclusion complexes is not only dependent on the interaction between the inclusion complexes and the solvent, but also related to the interaction between the host and the guest. It further clarifies the surface area of inclusion complexes (A3), the LUMO energy of inclusion complexes (E3LUMO), the polarity index of inclusion complexes (I3), the electronegativity of drugs (χ1), and the oil–water partition coefficient of drugs (logp1w) are effective parameters on logS. The influence of each parameter on logS is as follows: A3 > E3LUMO > I3 > χ1 > logp1w. These parameters could be applied to calculate the solubilizing effect of other drugs by inclusion with cucurbit[7]uril or other macrocycles.
Conflicts of interest
There are no conflicts to declare.
Acknowledgements
The authors gratefully acknowledge financial support from the National Natural Science Foundation of China (NSFC grant number 21476186 and 21903066).
Notes and references
- D. Ma, G. Hettiarachchi, D. Nguyen, B. Zhang, J. B. Wittenberg, P. Y. Zavalij, V. Briken and L. Isaacs, Nat. Chem., 2012, 4, 503–510 CrossRef CAS.
- J. A. Plumb, B. Venugopal, R. Oun, N. Gomez-Roman, Y. Kawazoe, N. S. Venkataramanan and N. J. Wheate, Metallomics, 2012, 4, 561–567 RSC.
- V. V. Sursyakova, V. A. Levdansky and A. I. Rubaylo, Electrophoresis, 2019, 40, 1656–1661 CrossRef CAS.
- V. J. Stella and R. A. Rajewski, Int. J. Pharm., 2020, 583, 119396 CrossRef CAS.
- L. Wang, J. Yan, Y. Li, K. Xu, S. Li, P. Tang and H. Li, J. Pharm. Biomed. Anal., 2016, 117, 453–463 CrossRef CAS.
- C. Zhu, Z. H. Meng, W. L. Liu, H. W. Ma, J. R. Li, T. T. Yang, Y. Liu, N. Liu and Z. B. Xu, R. Soc. Open Sci., 2018, 5, 180038 CrossRef PubMed.
- X. J. Loh, Mater. Horiz., 2014, 1, 185–195 RSC.
- H. H. J. Buschmann, K. Jansen and E. Schollmeyer, Inorg. Chem. Commun., 2003, 6, 531–534 CrossRef CAS.
- D. Das, K. I. Assaf and W. M. Nau, Front. Chem., 2019, 7, 619 CrossRef CAS PubMed.
- B. Zhang and L. Isaacs, J. Med. Chem., 2014, 57, 9554–9563 CrossRef CAS PubMed.
- A. I. Lazar, F. Biedermann, K. R. Mustafina, K. I. Assaf, A. Hennig and W. M. Nau, J. Am. Chem. Soc., 2016, 138, 13022–13029 CrossRef CAS PubMed.
- B. U. Emenike, S. N. Bey, B. C. Bigelow and S. V. S. Chakravartula, Chem. Sci., 2016, 7, 1401–1407 RSC.
- S. Yousefinejad, F. Honarasa, M. Mosahebfard and M. Nekoeinia, J. Mol. Liq., 2017, 231, 263–271 CrossRef CAS.
- P. W. Kenny, C. A. Montanari, I. M. Prokopczyk, J. F. Ribeiro and G. R. Sartori, J. Med. Chem., 2016, 59, 4278–4288 CrossRef CAS PubMed.
- E. L. Robinson, P. Y. Zavalij and L. Isaacs, Supramol. Chem., 2014, 27, 288–297 CrossRef PubMed.
- S. M. Wang, J. M. Chen and T. B. Lu, CN 105641713A, 2016.
- Y. Zhao, M. H. Pourgholami, D. L. Morris, J. G. Collins and A. I. Day, Org. Biomol. Chem., 2010, 8, 3328–3337 RSC.
- Q. Liu, Q. Tang, Y.-Y. Xi, Y. Huang, X. Xiao, Z. Tao, S.-F. Xue, Q.-J. Zhu, J.-X. Zhang and G. Wei, Supramol. Chem., 2015, 27, 386–392 CrossRef CAS.
- H. Zhang, Y. Huang, S.-F. Xue, Z. Tao and Q.-J. Zhu, Supramol. Chem., 2011, 23, 527–532 CrossRef CAS.
- Y. Huang, S.-F. Xue, Z. Tao, Q.-J. Zhu, H. Zhang, J.-X. Lin and D.-H. Yu, J. Inclusion Phenom. Macrocyclic Chem., 2008, 61, 171–177 CrossRef CAS.
- F. Chandra, P. Kumar and A. L. Koner, Colloids Surf., B, 2018, 171, 530–537 CrossRef CAS PubMed.
- G. Guo, Q. Tang, Y. Huang, Z. Tao, S. Xue and Q. Zhu, Chin. J. Org. Chem., 2014, 34, 2317 CrossRef CAS.
- Y. Lv, L. F. Yan and N. Dong, Spectrosc. Spectral Anal., 2014, 34, 1610–1614 Search PubMed.
- S. Li, J. Y.-W. Chan, Y. Li, D. Bardelang, J. Zheng, W. W. Yew, D. P.-C. Chan, S. M. Y. Lee and R. Wang, Org. Biomol. Chem., 2016, 14, 7563–7569 RSC.
- R. H. Alzard, M. S. Bufaroosha, N. Al-Shamsi, A. Sohail, N. Al-Dubaili, A. A. Salem, I. M. Abdou and N. Saleh, ACS Omega, 2019, 4, 953–960 CrossRef CAS PubMed.
- X. L. Li, Master thesis, Xi'an University of Architecture and Technology, 2014.
- N. Barooah, J. Mohanty, H. Pal and A. C. Bhasikuttan, J. Phys. Chem. B, 2012, 116, 3683–3689 CrossRef CAS PubMed.
- S. Li, X. Lin, K. Xu, J. He, H. Yang and H. Li, Sci. Rep., 2017, 7, 45984 CrossRef CAS PubMed.
- Z. Yang, D. Shao and G. Zhou, J. Chem. Thermodyn., 2019, 132, 268–275 CrossRef CAS.
- K.-U. Goss, Fluid Phase Equilib., 2005, 233, 19–22 CrossRef CAS.
- C. A. Baldasare and P. G. Seybold, J. Phys. Chem. A, 2020, 124, 2152–2159 CrossRef CAS PubMed.
- T.-J. Park, Y. S. Kim, E. Kan and S. H. Lee, RSC Adv., 2015, 5, 25590–25593 RSC.
- R. E. Skyner, J. L. McDonagh, C. R. Groom, T. van Mourik and J. B. Mitchell, Phys. Chem. Chem. Phys., 2015, 17, 6174–6191 RSC.
- H. Liu, M. Wei, X. Yang, C. Yin and X. He, Sci. Total Environ., 2017, 574, 1371–1378 CrossRef CAS PubMed.
- G.-Y. Yang, J. Yu, Z.-Y. Wang, X.-L. Zeng and X.-H. Ju, QSAR Comb. Sci., 2007, 26, 352–357 CrossRef CAS.
- J. Huang, G. Yu, Z.-L. Zhang, Y.-L. Wang, W.-H. Zhu and G.-S. Wu, J. Environ. Sci., 2004, 16, 21–29 CAS.
- J.-W. Chen, L. Feng, Y.-Y. Liao, S.-K. Han, L.-S. Wang and H.-M. Hu, Chemosphere, 1996, 33, 537–546 CrossRef CAS.
- T. N. Borhani, S. Garcia-Munoz, C. Vanesa Luciani, A. Galindo and C. S. Adjiman, Phys. Chem. Chem. Phys., 2019, 21, 13706–13720 RSC.
- Y. J. Jeon, S. Y. Kim, Y. H. Ko, S. Sakamoto, K. Yamaguchi and K. Kim, Org. Biomol. Chem., 2005, 3, 2122–2125 RSC.
- B. Mennucci, Wiley Interdiscip. Rev.: Comput. Mol. Sci., 2012, 2, 386–404 CAS.
- M. Agrawal, A. Kumar and A. Gupta, RSC Adv., 2017, 7, 41573–41584 RSC.
- H. Szatyłowicz, J. Phys. Org. Chem., 2008, 21, 897–914 CrossRef.
- C.-G. Zhan, J. A. Nichols and D. A. Dixon, J. Chem. Phys., 2003, 107, 4184–4195 CrossRef CAS.
- T. Lu and F. W. Chen, J. Comput. Chem., 2012, 33, 580–592 CrossRef CAS PubMed.
- L. T. Qin, X. Zhang, Y. H. Chen, L. Y. Mo, H. H. Zeng, Y. P. Liang, H. Lin and D. Q. Wang, Environ. Sci. Pollut. Res. Int., 2019, 26, 16606–16615 CrossRef CAS PubMed.
- Q. Xu, C. Wei, R. Liu, S. Gu and J. Xu, Chemom. Intell. Lab. Syst., 2015, 146, 313–321 CrossRef CAS.
- N. Chirico and P. Gramatica, J. Chem. Inf. Model., 2011, 51, 2320–2335 CrossRef CAS PubMed.
- L. Eriksson, J. Jaworska, A. P. Worth, M. T. Cronin, R. M. McDowell and P. Gramatica, Environ. Health Perspect., 2003, 111, 1361–1375 CrossRef CAS PubMed.
- J. G. Topliss and R. P. EdwardsJ, J. Med. Chem., 1979, 22, 1239–1244 CrossRef PubMed.
- S. Yousefinejad, F. Honarasa and H. Montaseri, RSC Adv., 2015, 5, 42266–42275 RSC.
Footnote |
| † Electronic supplementary information (ESI) available: Detailed information for the experimental solubility data and optimized inclusion structures and parameters. See DOI: 10.1039/d0ra03394d |
|
| This journal is © The Royal Society of Chemistry 2020 |
Click here to see how this site uses Cookies. View our privacy policy here. 
 Open Access Article
 This Open Access Article is licensed under a Creative Commons Attribution-Non Commercial 3.0 Unported Licence
 *abc
*abc


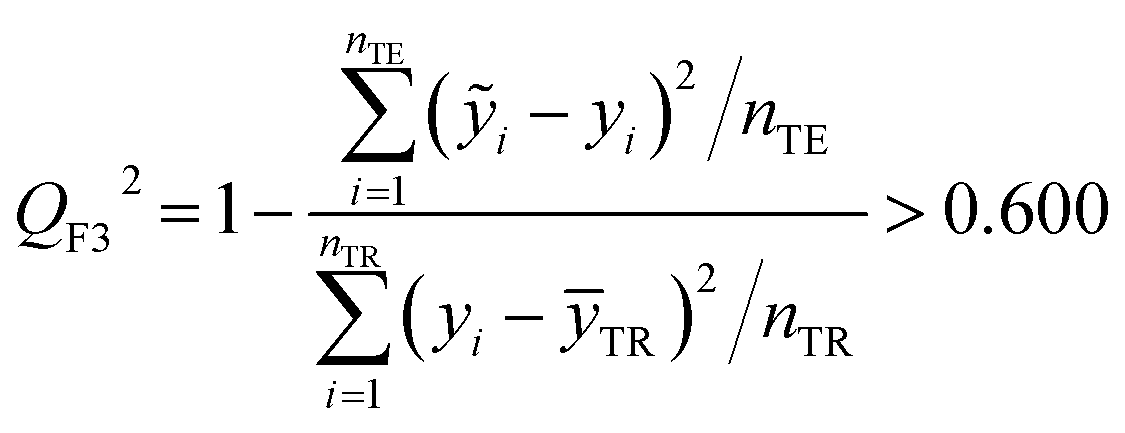
 is the average of the calculated values; nTR and nTE are the numbers of samples in the training and test sets, respectively.