 Open Access Article
Bio-cleaning improves the mechanical properties of lignin-based carbon fibers†
Tanushree Ghosh a,
Jiawei Chena,
Aloke Kumar
 b,
Tian Tang
 *a and
Cagri Ayranci*a
aDepartment of Mechanical Engineering, University of Alberta, 116 St & 85 Ave, Edmonton, Alberta, Canada. E-mail: tian.tang@ualberta.ca; cayranci@ualberta.ca; Tel: +1 780 492 5467 Tel: +1 780 492 2791
bDepartment of Mechanical Engineering, Indian Institute of Science, CV Raman Rd, Bangalore, Karnataka 560012, India
First published on 16th June 2020
Abstract
Production of carbon fibers (CF) using renewable precursors has gained importance particularly in the last decade to reduce the dependency on conventional petroleum-based precursors. However, pre-treatment of these renewable precursors is still similar to that of conventional ones. Little work is put into greener pre-treatments and their effects on the end products. This work focuses on the use of bio-cleaned lignin as a green precursor to produce CF by electrospinning. Bio-cleaned kraft lignin A (Bio-KLA) and uncleaned kraft lignin A (KLA) were used to explore the effect of bio-cleaning on the diameter and mechanical properties of lignin fibers and CF. The effect of electric field, lignin-to-poly(ethylene oxide) (PEO) ratio and PEO molecular weight (MW) were evaluated by 33 factorial design using Design of Experiment (DOE). The electrospinning process parameters were optimized to obtain a balance between high elastic modulus and small fiber diameter. The model predicted optimized conditions were 50 kV m−1 electric field, 95/5 lignin-to-PEO ratio and 1000 kDa MW of PEO. When compared to KLA, Bio-KLA CFs showed a 2.7-fold increase in elastic modulus, 2-fold increase in tensile strength and 30% decrease in fiber diameter under the same optimum conditions. The results clearly show that bio-cleaning improved the mechanical properties of lignin derived CF.
Introduction
Carbon fibers (CF) and CF reinforced composite materials are heavily used in a broad range of fields that are strategically critical, such as composite materials and energy. Some of the important applications that utilize CF are aviation,1 aerospace,2 sensors, batteries,3,4 and supercapacitors.5,6 The advantages of using CF in various applications include its light weight, large surface area to volume ratio and strength to weight ratio, high flexibility, corrosion resistance, etc.7 More than 97% of all produced CF are used in composite material applications,8 where mechanical properties of the reinforcements play vital roles. CF-reinforced polymer composites benefit immensely from its high modulus and tensile strength.9,10 The wide range of applications and their critical importance result in the need for a large amount of CF all over the world. The projected value of global CF demand was estimated to be 120.5 thousand tons by 2020.11Conventional CF are produced from polyacrylonitrile (PAN) or pitch-based precursors that are petroleum products. Various efforts have been spent to improve the mechanical properties of commercially available PAN-based CF by γ-irradiation,12–15 surface modification16 and functionalization.17,18 Although having good mechanical, thermal, chemical and physical properties, PAN-based CF are not environmentally friendly. In the last few decades, there has been a high demand for environmentally sustainable, high performance, and lightweight CF materials.10
Lignin has been recognized as a potential alternative to PAN for CF preparation since 1970 to reduce cost, carbon dioxide emissions and energy expenses.19,20 Tensile strength, elastic modulus and surface morphologies of lignin-based CF are studied and documented. Mechanical properties of precursor lignin fibers (LF) and the resulting CF depend on the lignin source, lignin purity, precursor fiber spinning techniques, polymer additives, fiber diameter etc.10,11,21–23 Among these, purity of lignin is one of the crucial factors that alter the mechanical properties of the produced fibers. Impurities in lignin may include carbohydrates, ash, sulphur, proteins, inorganic salts, extractives, lignin-derived phenolics, metal-containing salts, and water.24 These impurities were reported to cause difficulties in production, and defective fibers with poor mechanical properties.25
Regardless of the manufacturing techniques, lignin needs to be purified. Several lignin purification and fractionation techniques including acid precipitation,26 organosolv technique,25,27–29 ionic liquid technologies,30,31 green liquor process32,33 and biodegradation34–37 were adopted to obtain clean lignin to be used as CF precursor. Commercially available kraft lignin (Indulin-AT), organosolve lignin (Alcell™) were reported to be used for the production of carbon fibers by many researchers.10,38–42 In most of these studies, lignin samples were sequentially acid cleaned, fractionated with methanol and methanol–dichloromethane mixtures.38–41 A few other studies reported extensive desalting and acid washing,10 fractionation with methyl isobutyl ketone (MIBK), ethanol and sulfuric acid.42 The above-mentioned articles reported tensile strength of 5–8 MPa and elastic modulus of 500–700 MPa for lignin fibers, and tensile strength of 30–700 MPa and elastic modulus of 2–40 GPa for carbon fibers. Other techniques for lignin purification have also been reported with carbon fibers having tensile strength of 300–600 MPa and elastic modulus as high as 40 GPa.43–47 Lignin purification by acid precipitation, organic solvent and ionic liquid fractionation etc. is proved to be effective, but with added cost to lignin which in turn increases the cost of carbon fibers. Also, these cleaning methods use harsh and toxic chemical treatments which pollute the environment. In contrast, biodegradation or bio-cleaning of waste lignin was found to be a comparatively effective, environmentally sustainable and low-cost technique.34,48,49
The purified lignin can be fabricated into fibers with submicron diameter.10,21,50–53 Due to its simplicity and tailorability, electrospinning is often utilized to produce fibers with sub-micron to nanoscale diameters that have high surface area.20,54–58 Several studies demonstrated successful electrospinning of lignin fibers (LF); however, higher lignin content, improper lignin-to-polymer ratio resulted in poor spinnability, bead-on-a-string structure, rough to fused fiber morphologies.22 Plasticizers (such as PEO, PVA) were introduced to gain good spinnability (via increased viscosity) as well as smooth LF.59,60 The LF mats produced by electrospinning showed poorer mechanical properties compared to fibers obtained by other process.11 Improved mechanical properties with finer fibers (lower fiber diameter) could be achieved by manipulating and optimizing electrospinning parameters such as lignin content, and molecular weight of additive polymer, applied electric field, feed rate, gap distance etc. The motivation to achieve finer LF (minimize fiber diameter) with improved mechanical property (maximize elastic modulus and tensile strength) would lead to the production of LF as well as CF with versatile applicability. The finer and robust fibers always contribute to higher surface area per volume,61 which is the most preferable property of functional materials used in drug delivery, cell adhesion, gas or chemical absorption, electrode preparation etc.
Process optimization to obtain targeted response can be achieved by using Design of Experiment (DOE). DOE is a multivariate technique to determine the influence of various experimental factors on a certain response, either independently or cooperatively. The cooperative influence or interaction between factors on the response cannot be captured by the varying single parameter approach. A full factorial design can detect interaction effects between the factors and provide precise information for response surface methodology. Factorial designs of experiment are widely adopted for optimizing electrospinning parameters.62,63 However other optimization models such as Taguchi method,64,65 fractional factorial design,62 central composite design,66 and many more has been reported with their own benefits and limitations. Fractional factorial and Taguchi sacrifice information of certain factors to achieve fewer runs. Full factorial design detects interaction effects and has better precision in analysis of the effect of each factor on the responses. The 33 full factorial designs provide more accurate estimation for the curvature of the model in response surface methodology. It also provides better estimation than 23 full factorial design and Box Behnken Design.67 Full factorial can be tailorable to fit any design points which are neither a center point nor any extreme point.
In a recent work, we demonstrated the success of using Pseudomonas fluorescens to bio-clean Kraft lignin A (KLA) by selectively degrading carbohydrate impurities, leading to purified form of KLA (Bio-KLA).34 The present work explores the possibility of using the bio-cleaned lignin to produce CF precursors and CF. Here, both lignin samples (KLA and Bio-KLA) were used for lignin-based CF preparation by electrospinning lignin/PEO solution in N,N-dimethyleformamide (DMF). The spinnability was tested separately for each solution. The influences of applied electric field (F), lignin/PEO ratio (r), and PEO molar mass (W) were analyzed to get optimum operating parameters using 33 full factorial design. The effects of independent variable and their interactive effects were evaluated on fiber diameter (D), elastic modulus (E), and tensile strength (σ). The optimum operating parameters were validated by producing LF and CF from both KLA and Bio-KLA. This is the first report of the production of LF and CF from bio-cleaned lignin as best of our knowledge. Also, the electrospinning parameter optimization for lignin/PEO solutions using DOE has not been reported earlier. The novelty of this study lies in; (i) demonstrating the effect of bio-cleaned lignin via the electrospinning of Bio-KLA for CF preparation and (ii) detailed electrospinning operating parameter optimization on the large body of experimental findings to improve mechanical property of resulting CF.
Materials and methods
Biomass and chemicals
KLA was provided by InnoTech, Alberta; milled and prepared in West Fraser pulp mill (Hinton, Canada). It was then bio-cleaned using the same method described in our previous work.34 Bio-KLA contains 57% less carbohydrates and 87% less ash compared with KLA.34 Both KLA and Bio-KLA was vacuum dried at 100 °C before sample preparation for electrospinning. Other chemicals such as poly(ethylene oxide) (PEO) and anhydrous N,N-dimethyleformamide (DMF) were purchased from Sigma Aldrich, Canada. Three molecular weights of PEO (1000 kDa, 2000 kDa and 5000 kDa) were used as polymer additive to lignin solutions without further purification.Preparation of electrospinning solutions
Electrospinning solutions were prepared as described by Aslanzadeh et al.21,22 PEO solution was prepared by heating at 80 °C for 15 min and lignin was added to the PEO solution to prepare spinning solution. The lignin-PEO mixtures were heated at 80 °C and continuously stirred at 600 rpm for 3 h. The solutions were then allowed to stand (12–18 h) overnight and cooled to room temperature (20–22 °C) to ensure complete dissolution. Prior to electrospinning, solutions were stirred vigorously and reheated to 80 °C for 30 min and cooled down again to room temperature to ensure complete homogeneity of the solutions. Lignin–PEO solutions with three different total solid fractions of 22 wt%, 30 wt% and 35 wt% were investigated. At each solid fraction, three PEO MW were used (1000 kDa, 2000 kDa and 5000 kDa) and the lignin/PEO ratio (wt/wt) was varied at seven levels of ratio: 95/5, 96/4, 97/3, 99/1, 99.5/0.5, 99.75/0.25, and 99.9/0.1.Lignin fiber preparation
The electrospinning set-up includes a syringe pump (Geneq Inc., Canada) equipped with a 10 ml syringe (BD syringes, Fisher Scientific, Canada) and a blunt-tip 20G needle, a high voltage supply (GAMMA High Voltage Research, Ormond Beach, FL) and a stationary metal collector. Here, the needle is acting as spinneret to eject and spin the lignin/PEO solution. The 20 G needle was purchased from BD PrecisionGlide, Fisher Scientific, Canada. For all the electrospinning parameters, the distance from the needle tip to the collector (20 cm) and the solution feed rate (0.42 μl s−1) were kept constant. Three different electric fields (50 kV m−1, 60 kV m−1, 70 kV m−1) were applied and each mat was collected for 30 min during electrospinning.CF preparation
The electrospun LF mats were thermostabilized and carbonized to produce CF. The LF mats were placed on a combustion boat inside a tube-furnace (Lindberg/Blue M™) and thermostabilized at 250 °C under room atmospheric conditions. The thermostabilization heating rate was maintained at 0.5 °C min−1 to avoid fiber fusion. Thermo stabilization was then performed isothermally for 60 min at 250 °C. The fiber was cooled down to room temperature. The thermostabilized fibrous mats were then carbonized under argon (Ar) flow by first heating at a rate of 5 °C min−1 to 1000 °C and then holding isothermally at 1000 °C for 60 min.Characterization
The electrospun LF mats were peeled off of the stationary collector and small pieces from the center and sides were imaged under scanning electron microscope (SEM, Zeiss EVO MA10, Oberkochen, Germany) to investigate fiber morphology and homogeneity of the mat. SEM images were taken at 20 kV at various resolutions and all the samples were gold coated (Gold sputtering Unit DESK II, Denton Vacuum, Moorestown, USA) for 120 s before imaging to avoid sample burning due to high beam. Fiber diameters were measured manually among over 100 fibers with ImageJ (version 1.52p). All the diameter values are presented as average diameter ± standard deviation.The mechanical properties of the fiber mats were measured with a uniaxial testing machine (ElectroForce 3200 Series III, Bose Corporation) at an average temperature of 25 °C and relative humidity of 25%. The fiber mats were clamped inside C-shaped paper holders to reduce stress concentration from the grippers (Fig. S-1, ESI†). The tensile tests were conducted with a 250 g load cell, strain rate of 0.01 mm s−1, and gauge length of 30 mm. Only the specimens that failed in the middle section of the gauge length were considered to avoid effects of premature failure due to stress concentrations at the grips. Fiber extension higher than 40% could not be measured due to stroke limit of the machine. Since force was recorded in gram from the tensile test machine, the stress on the fiber mats was derived from the specific stress (g per tex) by eqn (1) and (2) using the sample width of 10 mm and length of 50 mm.68
 | (1) |
 | (2) |
Specific stress with the unit of N per tex can be calculated by multiplying the specific stress in eqn (1) with the gravitational constant (9.81 N kg−1). The specific stress can then be converted to the nominal stress (MPa) by multiplying it with the mass density of lignin fibers (1.35 g cm−3)68,69 and carbon fibers (1.70 g cm−3),70 respectively.
Experimental design
To optimize the electrospinning parameters, a 33 full factorial design was constructed using Design-Expert® (Stat-Ease. v11) software. The parameters investigated were electric field (factor F, kV m−1), lignin/PEO ratio (factor r) and PEO MW (factor W, kDa), while the selected responses were fiber diameter (D, nm), elastic modulus (E, MPa) and ultimate tensile strength (σ, MPa). Each factor consisted of 3 levels coded as −1 (low), 0 (center), and +1 (high). Table 1 summarizes the factorial design parameters with their actual and coded values. The designed 27 experimental runs were required to analyze factor interactions for accurate model prediction. The optimal condition was obtained with desirability function. In this design, importance +++ (3) was assigned to fiber diameter, elastic modulus and tensile strength by default. The objective was set to simultaneously minimize fiber diameter and maximize tensile strength, elastic modulus. In order to adopt the response surface methodology, the data were fitted to a quadratic model with polynomial equation eqn (3).| ŷ = β0 + β1x1 + β2x2 + β3x3 + β12x1x2 + β13x1x3 + β23x2x3 + β11x12 + β22x22 + β33x32 | (3) |
| Factor | Unit | Code | Low (−1) | Center (0) | High (+1) |
|---|---|---|---|---|---|
| Electric field | kV m−1 | F | 50 | 60 | 70 |
| Lignin/PEO ratio | — | r | 95/5 | 96/4 | 97/3 |
| PEO MW | kDa | W | 1000 | 2000 | 5000 |
Results and discussion
Morphology and spinnability
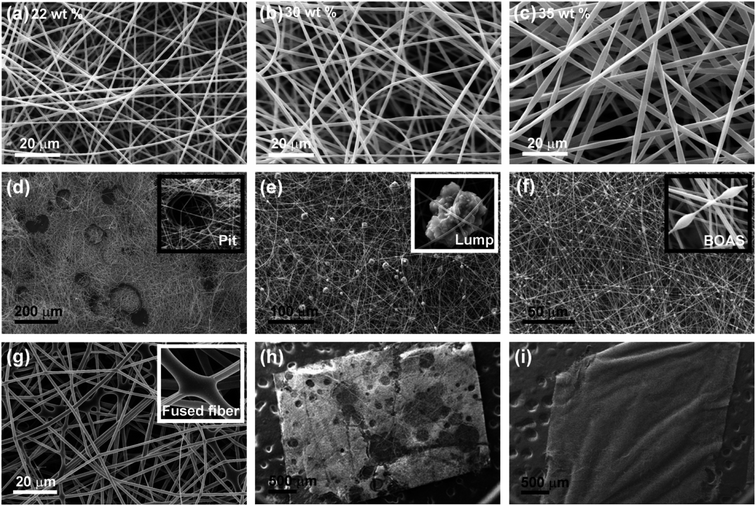
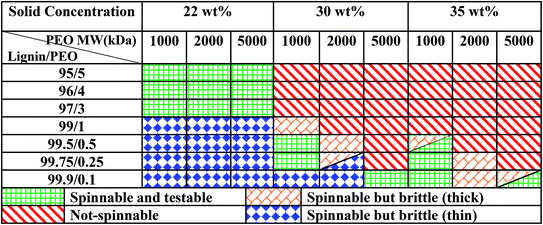
Fig. 1 shows different morphologies or defects of LF mat produced from KLA, identified by scanning electron microscopy. Smooth-rounded fibers were obtained in the majority of the electrospun samples using 22 wt% solutions (Fig. 1a) while flat-twisted ribbon-like fibers were obtained under all spinnable conditions at total solid concentration of 30–35 wt% (Fig. 1b and c). Although most fibers were smooth rounded for 22 wt%, LF mats were observed to contain several defects. Typical defects were encountered as bead-on-a-string (BOAS), fused fibers, lumps and pits (Fig. 1d–g) in the fibrous mats. Similar BOAS was also reported by other researchers for electrospun LF.21,22,71 The defects were observed to form from the solutions with high MW PEO or from high electric field that changes the electrospinning behavior. Four types of electrospinning behaviors were observed – electrospraying or spitting, dripping (not spinning at all), spinning with occasional dripping and spinning consistently. Occurrence of more than one spinning behaviors were also observed in some experiments, for example, dripping followed by electrospraying or vice versa. Electrospraying contributed to pits and beads formations on the LF mat (Fig. 1h). Dripping caused less deposition and generated thinner LF mats. A smooth and consistent spinning produced defect free fibrous mat (Fig. 1i).Different spinning behavior or spinnability of the lignin/PEO solutions was studied systematically. For each solution, five representative mats were taken into account to analyze the resulting LF mat. The observed spinnabilities are tabulated in Table 2, where different colors correspond to different electrospinning outcomes. The first outcome, “not-spinnable” shown by ‘red, diagonal pattern’, occurs for the majority of the solutions prepared with 30 wt% and 35 wt% total solid content, especially when the PEO fraction is high (>1 as in 99/1 lignin/PEO ratio). In those cases, the solution was either too viscous to spin or electrospraying. The second outcome, “spinnable and testable” shown by ‘green, small grid pattern’, resulted in fibrous mats for which the mechanical properties can be tested. This was found for solutions with 22 wt% total solid at relatively low lignin/PEO ratio (95/5 to 97/3), irrespective of the PEO MW. A few of solutions containing 30 wt% and 35 wt% total solid at relatively high lignin/PEO ratios were also found spinnable and testable. A third outcome, “spinnable but brittle”, corresponds to fibrous mats that could be produced but was not testable for mechanical properties due to brittleness. These non-testable mats can be subdivided into two types: thin mats and thick mats. The color ‘blue, solid diamond pattern’ corresponds to mats that were too thin and brittle; they could not be separated from the collector and hence non-testable. The color ‘orange, diagonal brick pattern’ corresponds to thick and brittle fibers mats which cracked and peeled off from the collector instantly. The 22 wt% solutions with higher lignin fractions (≥99) resulted in thin mats, while the transition from “not-spinnable” to “spinnable but brittle (thick)” to “spinnable and testable” and to “spinnable but brittle (thin)” was observed in the cases of 30 wt% and 35 wt% solutions, as the lignin fraction increased. Similar variations in electrospinnability and fiber quality were also observed by Dallmeyer et al.59 and Poursorkhabi et al.71 As the lignin and PEO form strong hydrogen bonds in the solution, the miscibility and extent of hydrogen bonding differs with increasing PEO molar mass.72 Thus, the solution spinnability is affected by PEO content as well as with PEO molar mass. Proper spinnability is achievable at a certain range of total solid concentration. Low solid concentration induces solution spraying whereas higher concentrations produce viscous solution that required higher electric fields to overcome surface tension.40 Increasing the PEO fraction and PEO molecular weight extends the relaxation time, also resulting in higher viscosity and larger fiber diameter.68,71
From the spinnability study, the solutions with 22 wt% of total solid, 95/5 to 97/3 of lignin/PEO ratio and 2000–5000 kDa of PEO MW were found to consistently producing spinnable and testable LF mats. These solutions were therefore chosen for further screening and optimization of electrospinning factors.
Effects of lignin/PEO, PEO MW and electric field
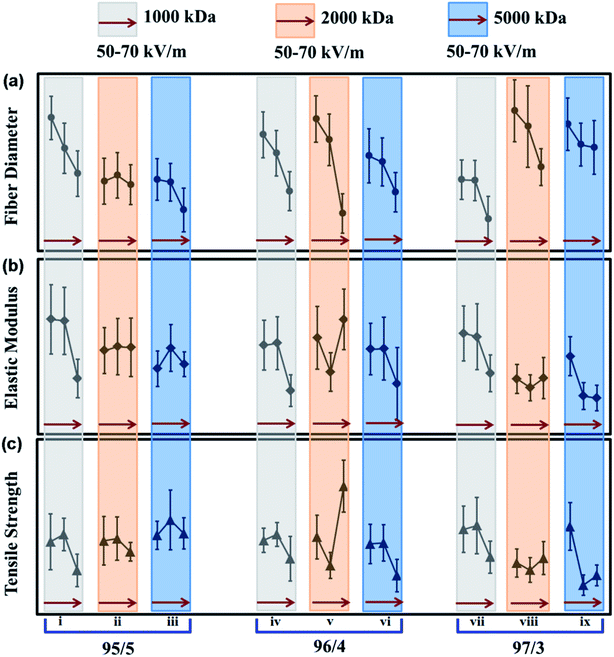
Fig. 2 outlines the individual effect of lignin/PEO ratio, PEO MW and electric field on the fiber diameter, elastic modulus and tensile strength of the LF mats produced from KLA (see Table S-1 for in depth quantitative data in ESI†). These responses were obtained for each solution with 22 wt% of total solid content resulting spinnable and testable LF mats. The average fiber diameter calculated for all the combinations of factors ranged between 543 nm and 1000 nm. Aslanzadeh et al. reported fiber diameters ranging from 667 nm to 1093 nm for bead free smooth fiber at 22 wt% of total solid using sulfur-free softwood lignin.21,22 Dallmeyer et al. reported the best operating parameter resulted into fiber diameter ranging from 702 nm to 1517 nm for seven different technical lignin samples.59 The fiber diameters calculated in our study are in agreement with these values. For the elastic modulus and tensile strength, the values were ranging from 72–229 MPa (Fig. 2b) and 3.66–0.84 MPa (Fig. 2c), respectively.As can be seen from Fig. 2, the trends of the outputs (fiber diameter, elastic modulus and tensile strength) with the changes in individual factors (lignin/PEO ratio, PEO MW and electric field) are fairly complicated. The average fiber diameter was found to decrease with increasing electric field irrespective of the PEO MW and lignin/PEO ratio (Fig. 2a), while no clear trends are observed in other curves. A few combinations of the factors led to the highest elastic modulus (229 MPa), for example, 50–60 kV m−1 electric field with 1000 kDa PEO at 95/5 lignin/PEO ratio (Fig. 2b, panel i), and 70 kV m−1 electric field with 2000 kDa PEO at 96/4 lignin/PEO ratio (Fig. 2b, panel v). When comparing the fiber morphology, the later showed occasional bead and lump formation in the mat while the former one was found to contain smooth bead-free fibers. The highest tensile strength was obtained at 70 kV electric field with 2000 kDa PEO at 96/4 lignin/PEO ratio. No clear correlation was found between the fiber diameter and elastic modulus or tensile strength. The three factors examined here appear to affect the diameter and mechanical properties of the fibers in a synergetic way, instead of individually. Optimization of these factors is necessary to achieve the best LF and eventually CF that show lower fiber diameter with higher elastic modulus.
Optimization model
A total of twenty-seven experiments were designed for KLA fibrous mats using three level (33) full factorial methodologies. The experimental conditions and their responses are shown in Table 3. The model evaluations are shown in Table 4, where the quadratic model contains no aliased factors for all responses. For the tensile strength, p-values were found greater than 0.1 for all fitted model, indicating its insignificance. Tensile strength was therefore not considered in the following analysis. The 2 Factor Interaction (2FI) model and linear model were recommended for fiber diameter and elastic modulus respectively, which showed high adjusted R2, predicted R2, and low p-value. High adjusted R2 and low p-value indicated the data fit the model well, while high predicted R2 suggested the model could provide good estimation of new responses. The model equations for fiber diameter and elastic modulus were predicted and constructed using Design Expert®. Table 5 showing the numerical models predict the fiber diameter and elastic modulus in terms of the coded (subscribed with c) and actual (subscribed with a) values of electric field (F), PEO/KLA ratio (r), and molecular weight of PEO (W). These models are correlational functions that can be used to estimate the responses from known variables.| Run | Coded variables | Responses | ||||
|---|---|---|---|---|---|---|
| F | r | W | D (nm) | E (MPa) | σ (MPa) | |
| 1 | −1 | −1 | −1 | 1000.48 | 229.79 | 2.08 |
| 2 | 0 | −1 | −1 | 863.47 | 226.83 | 2.29 |
| 3 | 1 | −1 | −1 | 749.85 | 111.30 | 1.26 |
| 4 | −1 | 0 | −1 | 924.51 | 177.87 | 2.12 |
| 5 | 0 | 0 | −1 | 840.95 | 182.08 | 2.29 |
| 6 | 1 | 0 | −1 | 669.59 | 87.11 | 1.59 |
| 7 | −1 | 1 | −1 | 721.45 | 201.56 | 2.43 |
| 8 | 0 | 1 | −1 | 718.09 | 194.59 | 2.54 |
| 9 | 1 | 1 | −1 | 543.86 | 121.64 | 1.64 |
| 10 | −1 | −1 | 0 | 714.36 | 167.53 | 2.10 |
| 11 | 0 | −1 | 0 | 741.10 | 175.11 | 2.16 |
| 12 | 1 | −1 | 0 | 699.23 | 173.62 | 1.79 |
| 13 | −1 | 0 | 0 | 995.82 | 192.75 | 2.21 |
| 14 | 0 | 0 | 0 | 901.54 | 124.26 | 1.40 |
| 15 | 1 | 0 | 0 | 569.21 | 229.35 | 3.66 |
| 16 | −1 | 1 | 0 | 1022.08 | 110.71 | 1.47 |
| 17 | 0 | 1 | 0 | 961.74 | 93.02 | 1.27 |
| 18 | 1 | 1 | 0 | 778.89 | 112.21 | 1.60 |
| 19 | −1 | −1 | 1 | 722.42 | 130.88 | 2.26 |
| 20 | 0 | −1 | 1 | 710.23 | 172.32 | 2.70 |
| 21 | 1 | −1 | 1 | 584.93 | 139.66 | 2.31 |
| 22 | −1 | 0 | 1 | 829.21 | 170.16 | 2.01 |
| 23 | 0 | 0 | 1 | 801.67 | 170.93 | 2.04 |
| 24 | 1 | 0 | 1 | 665.41 | 100.83 | 1.11 |
| 25 | −1 | 1 | 1 | 971.57 | 155.77 | 2.51 |
| 26 | 0 | 1 | 1 | 880.11 | 76.56 | 0.84 |
| 27 | 1 | 1 | 1 | 867.48 | 72.30 | 1.12 |
| Response | Source | Sequential p-value | Adjusted R2 | Predicted R2 | Remarks |
|---|---|---|---|---|---|
| D | Linear | 0.0050 | 0.3460 | 0.1736 | |
| 2FI | 0.0158 | 0.5463 | 0.3738 | Suggested | |
| Quadratic | 0.5038 | 0.5332 | 0.2344 | ||
| Cubic | 0.0275 | 0.7845 | 0.1812 | Aliased | |
| E | Linear | 0.0069 | 0.3261 | 0.1990 | Suggested |
| 2FI | 0.9273 | 0.2423 | −0.0310 | ||
| Quadratic | 0.8483 | 0.1486 | −0.3461 | ||
| Cubic | 0.2794 | 0.2872 | −0.4665 | Aliased | |
| σ | Linear | 0.3179 | 0.0270 | −0.1521 | |
| 2FI | 0.3736 | 0.0391 | −0.3123 | Not significant | |
| Quadratic | 0.9600 | −0.1113 | −0.7923 | ||
| Cubic | 0.4578 | −0.0901 | −1.6627 | Aliased |
| Coded | |
|---|---|
| D | = 793.42 − 94.36Fc + 52.36rc − 5.97 Wc − 10.13Fc × rc + 24.97Fc × Wc + 87.78 rc × Wc |
| E | = 148.90 − 21.61Fc − 21.59rc − 17.91Wc |
| Numerical | |
|---|---|
| D | = 3369.60 + 84.11Fa − 18.50ra − 4.29Wa − 1.01Fa × ra + 0.001Fa × Wa + 0.04 ra × Wa |
| E | = 2378.32 − 2.16Fa − 21.59ra − 0.01Wa |
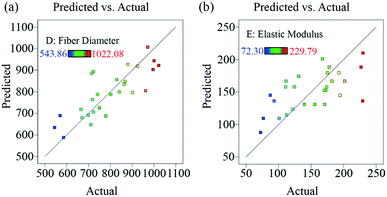
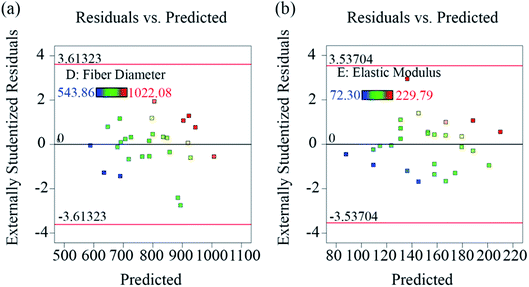
Analysis of variance (ANOVA) of the developed models was performed and the results are shown in Tables 6 (for fiber diameter) and 7 (for elastic modulus). The ANOVA test was used to evaluate the model fitting to the responses with confidence level of 95%. Both models were significant (p-value < 0.01). The adequate precisions were greater than 4, demonstrating that the signal-to-noise ratio was sufficient to detect effect of each factor. Electric field (F) had the most significant effect among all the main factors on fiber diameter. Molecular weight of PEO (W) did not show significant independent correlation to fiber diameter, but its interaction with lignin/PEO ratio (r) had strong impact on fiber diameter (p-value < 0.01). Lignin/PEO ratio (r) was also significant to fiber diameter (0.05 < p-value < 0.1). The other interaction effects and main factor effect were not significant to fiber diameter (p-value > 0.1). Lignin/PEO ratio (r) and electric field (F) were significantly correlated to elastic modulus, whereas molecular weight of PEO (W) had marginally significant effect on elastic modulus (0.05 < p-value < 0.1). The validity of the model was analyzed using predicted vs. actual values plots (Fig. 3) and residual vs. predicted value plots (Fig. 4) for both responses. No significant outliers were observed, and no systematic trend was present for the residuals. It suggested the model fitted the data sufficiently well.
| Source | Sum of squares | Df | Mean square | F-Value | p-Value |
|---|---|---|---|---|---|
| Model | 310562.10 | 6 | 51760.35 | 6.22 | 0.0008 |
| F | 154340.04 | 1 | 154340.04 | 18.54 | 0.0003 |
| R | 47525.58 | 1 | 47525.58 | 5.71 | 0.0269 |
| W | 694.29 | 1 | 694.29 | 0.08 | 0.7757 |
| Fr | 1232.50 | 1 | 1232.50 | 0.15 | 0.7045 |
| FW | 8107.35 | 1 | 8107.35 | 0.97 | 0.3355 |
| rW | 100173.71 | 1 | 100173.71 | 12.03 | 0.0024 |
| Residual | 166513.10 | 20 | 8325.651 | ||
| Total | 477075.20 | 26 | |||
| Std. Dev. | 91.25 | R2 | 0.6510 | ||
| Mean | 794.42 | Adjusted R2 | 0.5463 | ||
| C. V. % | 11.49 | Predicted R2 | 0.3738 | ||
| Adeq. precision | 9.0200 | ||||
| Source | Sum of squares | Df | Mean square | F-Value | p-Value |
|---|---|---|---|---|---|
| Model | 23052.20 | 3 | 7684.07 | 5.19 | 0.0069 |
| F | 8406.41 | 1 | 8406.41 | 5.68 | 0.0258 |
| r | 8392.39 | 1 | 8392.39 | 5.67 | 0.0259 |
| W | 6253.40 | 1 | 6253.40 | 4.23 | 0.0513 |
| Residual | 34028.24 | 23 | 1479.49 | ||
| Total | 57080.44 | 26 | |||
| Std. Dev. | 38.46 | R2 | 0.4039 | ||
| Mean | 151.88 | Adjusted R2 | 0.3261 | ||
| C. V. % | 25.33 | Predicted R2 | 0.1990 | ||
| Adeq. precision | 8.2556 | ||||
The dependencies of fiber diameter and elastic modulus on the three electrospinning factors can now be predicted from the models are illustrated in Fig. 5. As shown in Fig. 5a and d, the fiber diameter and elastic modulus decreased with increasing electric field. As the electric field increased, higher electrostatic force generated thinner jet and smaller fiber diameters. The decrease in lignin fiber diameters with increasing electric field is in agreement with previous study.21 However, it should be mentioned that very high electric field may induce electrospraying and cause poorer mechanical properties of the fiber mats. Fig. 5b and e are showing the effects of lignin/PEO ratio and Fig. 5c and f are representing the influence of PEO MW on fiber diameter and elastic modulus, respectively. Although with lower lignin/PEO ratio and/or higher PEO MW, the polymer solution can become more viscous which in turn can increase fiber diameter. However, no significant changes in the fiber diameter were observed with the increase in lignin/PEO ratio and PEO MW. The PEO fractions used in our study were too small to contribute observable difference in fiber diameter. The elastic modulus, on the other hand, showed linear dependence on electric field, lignin/PEO ratio and PEO MW. The elastic modulus decreased with increasing electric field, lignin/PEO ratio as well as PEO MW.
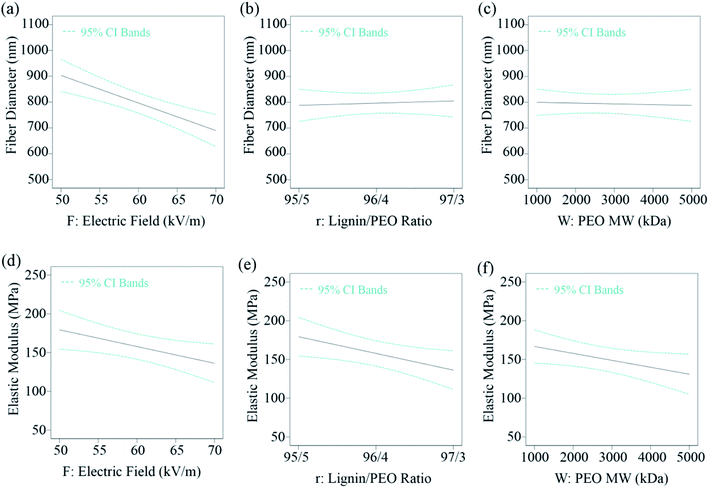 | ||
| Fig. 5 The main effects of electric field (a and d), PEO/KLA ratio (b and e), and molecular weight of PEO (c and f) on fiber diameter and elastic modulus of LF mats. | ||
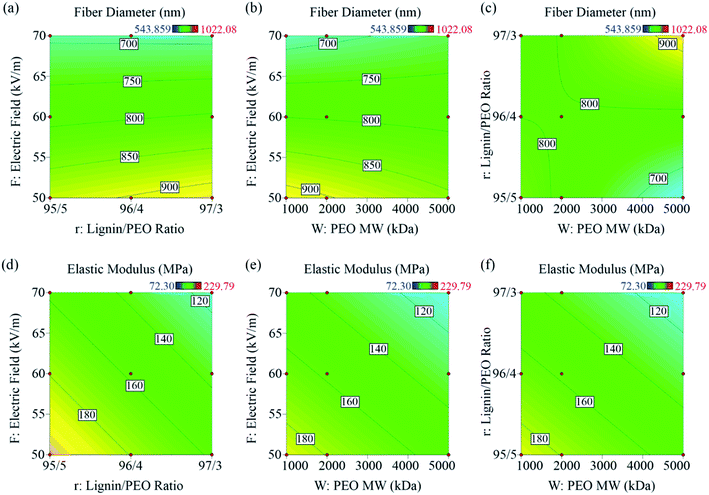
While the main effects are straight forward, the interacting factors showed interesting effects. Contour plots were employed to understand the interaction effects for both responses in Fig. 6. Since linear model was chosen for elastic modulus, the interaction plots in Fig. 6d–f indicated no interaction effects were present. Elastic modulus was in linear relationship with the three factors. The red dots on the plots correspond to the data at the experimental design points. Fig. 6a and b shows the interaction effects of electric field with lignin/PEO ratio, and electric field with PEO MW respectively. They were not significant in correlation to fiber diameter. The substantial curvature in Fig. 6c demonstrates strong interaction effects of lignin/PEO ratio and PEO MW on fiber diameter. Fiber diameter increased with PEO MW and decreased with lignin/PEO ratio as discussed earlier.
Using the models above, optimization of the electrospinning conditions was conducted in Design Expert®, resulting in the electric field of 50 kV m−1, PEO/KLA ratio of 5/95 and PEO MW of 1000 kDa (Table 8). The predicted responses were tensile strength of 2.34 MPa, elastic modulus of 210.42 MPa, and fiber diameter of 944.01 nm. The predicted values were close to experimental data, showing that the models are relatively accurate (Table 9).
| Number | Optimum parameters | Predicted response | Desirability | ||||
|---|---|---|---|---|---|---|---|
| F | r | W | D | E | |||
| 1 | 50 | 95/5 | 1000 | 944 | 210 | 0.075 | Selected |
| 2 | 50 | 95/5 | 2000 | 884 | 201 | 0.035 | |
| Lignin | Morphology | Diameter | Tensile strength (MPa) | Elastic modulus (MPa) | Strain at failure (%) |
|---|---|---|---|---|---|
| KLA, LF | Bead-free, smooth | 1000.48 ± 97.48 | 2.08 ± 0.80 | 229.79 ± 69.21 | 19.29 ± 6.44 |
| KLA, CF | Bead-free, smooth | 663.17 ± 64.51 | 5.52 ± 4.05 | 886.29 ± 471.47 | 4.28 ± 4.01 |
| Bio-KLA, LF | Bead-free, smooth | 582.86 ± 90.07 | 3.19 ± 0.70 | 358.61 ± 109.53 | 7.93 ± 3.76 |
| Bio-KLA, CF | Bead-free, smooth | 464.69 ± 75.55 | 11.64 ± 6.94 | 2374.28 ± 778.34 | 2.38 ± 1.48 |
Effect of bio-cleaning
Untreated electrospun KLA fibers under optimum conditions identified above were carbonized into CFs. Bio-KLA fibers were also electrospun under the same condition. Table 9 summarizes the observation on morphology, fiber diameter, elastic modulus, tensile strength and strain at failure for KLA, Bio-KLA and their corresponding CFs. The produced fibers were uniform, smooth and bead-free in all 4 cases. Fig. 7 shows morphologies of LF (a and b), thermostabilized LF (c and d) and CF (e and f) produced from KLA and Bio-KLA, respectively. After thermostabilization and carbonization, the rounded fibers shrink and showed little curved features. The average mass loss after carbonization was 65% for KLA fiber mats and 58% for Bio-KLA fiber mats. In comparison to KLA CFs, the average fiber diameters of Bio-KLA CFs were 30% smaller with 2.7-fold increase in elastic modulus, 2-fold increase in tensile strength. The bio-cleaning process was adapted to remove carbohydrates and ash present in the KLA. The impurities were contributing in the formation of defects in the LF mats which in turn also lowering the mechanical properties. The BOAS structure makes the LF mats susceptible to break at lower force at the bead-string junctions, resulted into poor quality mats. The LF mats containing pits and lumps are also found weak due to uneven force distribution throughout the mats. As the Bio-KLA contains 57% lesser carbohydrates and 87% lesser ash than KLA, it resulted into high throughput, defect-free smooth and strong LF as well as CF.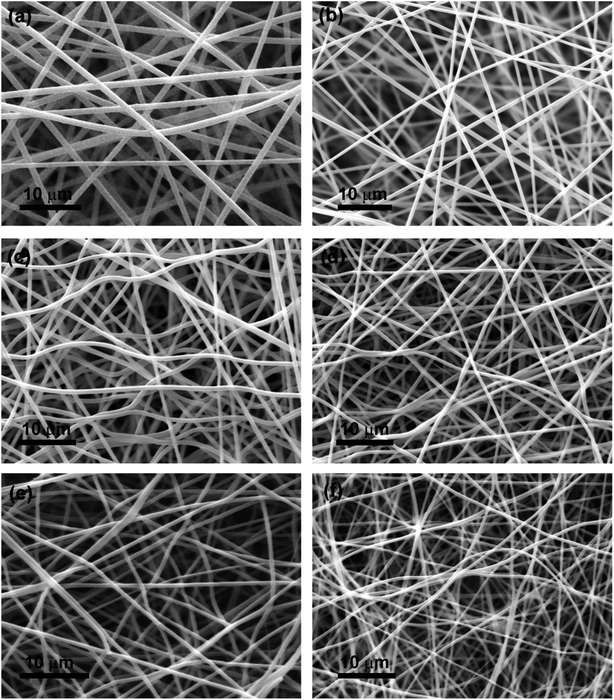 | ||
| Fig. 7 SEM images of KLA fibers (a), thermostabilized KLA fibers (c), carbonized KLA fibers (e), and Bio-KLA fibers (b), thermostabilized Bio-KLA fibers (d), carbonized Bio-KLA fibers (f). | ||
Conclusion
Lignin-based carbon fiber preparation from Bio-cleaned lignin was successfully achieved. The electrospinning and preparation conditions for the lignin fibers were optimized using a full factorial design of experiments method to minimize fiber diameter and maximize mechanical properties. The main and cooperative effects of the factors – such as lignin to PEO ratio, PEO MW and electric field – were investigated to explore their effect on the average fiber diameter, elastic modulus and tensile strength. The defects in the lignin fiber mats, such as BOAS, lumps and pores, were detected in lignin fibers produced from untreated lignin (KLA). At the optimized conditions (i.e. 95/5 lignin to PEO ratio, 1000 kDa PEO MW and 50 kV m−1 electric field), smooth and bead-free fibers were obtained from both KLA and Bio-KLA. The carbon fibers obtained from both KLA and Bio-KLA were compared. Carbon fibers obtained from Bio-KLA at optimized conditions showed 30% decrease in fiber diameter and >2-fold increase in elastic modulus and tensile strength. Bio-cleaning improved the mechanical properties and morphological quality of lignin fibers as well as carbon fibers. Bio-KLA resulted in stronger CF with finer fibers. Since the bio-cleaning of lignin has been proposed as an alternative purification process in our recent work, a successful electrospinning of Bio-KLA for lignin fiber production provides positive evidence and strength to the bio-cleaning process for lignin purification and its applicability. The Bio-KLA derived LF and CF showed improved elastic modulus and tensile strength with lower (sub-micron) fiber diameter which proves a great contribution of the bio-cleaning in the lignin purification process. The findings provide additional great hope to the decades-long research conducted world-wide on the use of lignin as a precursor as our results show that a greener approach can be followed during this process.Conflicts of interest
There are no conflicts to declare.Abbreviations and acronyms
| CF | Carbon fibers |
| LF | Lignin fibers |
| KLA | Kraft lignin A |
| Bio-KLA | Bio-cleaned kraft lignin A |
| PEO | Poly(ethylene oxide) |
| MW | Molecular weight |
| DMF | N,N-Dimethyleformamide |
| 2FI | 2-Factor interaction |
| PAN | Polyacrylonitrile |
| PVA | Poly(vinyl alcohol) |
| DOE | Design of experiment |
| F | Electric field |
| r | Lignin/PEO ratio |
| W | PEO MW |
| D | Fiber diameter |
| E | Elastic modulus |
| σ | Tensile strength |
Acknowledgements
This study was performed as part of a research project “Engineering lignin as a precursor for carbon fibers, using novel biodegradation and purification techniques” (BFR032). All the authors would like to thankfully acknowledge the funding provided by AI-BIO – Alberta Bio Future Research and Innovation Program, Canada. The authors also acknowledge West Fraser pulp mill, Hinton, Canada, for providing lignin samples.References
- B. Chatterjee and S. Bhowmik, in Sustainable Engineering Products and Manufacturing Technologies, Elsevier, 2019, pp. 199–219 Search PubMed.
- C. Barile, C. Casavola and F. De Cillis, Composites, Part B, 2019, 162, 122–128 CrossRef CAS.
- S. Yang, Y. Cheng, X. Xiao and H. Pang, Chem. Eng. J., 2019, 123294 Search PubMed.
- A. Yadav, B. De, S. K. Singh, P. Sinha and K. K. Kar, ACS Appl. Mater. Interfaces, 2019, 11, 7974–7980 CrossRef CAS PubMed.
- H. Li, J. Liang, H. Li, X. Zheng, Y. Tao, Z.-H. Huang and Q.-H. Yang, J. Energy Chem., 2019, 31, 95–100 CrossRef.
- J. Cherusseri, K. Sambath Kumar, D. Pandey, E. Barrios and J. Thomas, Small, 2019, 15, 1902606 CrossRef CAS PubMed.
- P. Bhatt and A. Goe, Mater. Sci. Res. India, 2017, 14, 52–57 CAS.
- J. Zhang, V. S. Chevali, H. Wang and C.-H. Wang, Composites, Part B, 2020, 193, 108053 CrossRef.
- W. D. Callister and D. G. Rethwisch, Materials science and engineering: an introduction, Wiley, New York, 2018 Search PubMed.
- J. F. Kadla, S. Kubo, R. A. Venditti, R. D. Gilbert, A. L. Compere and W. Griffith, Carbon, 2002, 40, 2913–2920 CrossRef CAS.
- S. O. Ismail and E. I. Akpan, in Sustainable Lignin for Carbon Fibers: Principles, Techniques, and Applications, Springer, 2019, pp. 395–426 Search PubMed.
- T. Feng, Y. Zhao, J. Shi, L. Liu, N. Li, Z. Xu, L. Zhao, X. Tian, W. Mai and Y. Li, RSC. Adv., 2018, 8, 2373–2376 RSC.
- M. Shan, H. Wang, Z. Xu, N. Li, C. Chen, J. Shi, L. Liu, L. Kuang, M. Ma and C. Zhang, Anal. Methods, 2018, 10, 496–503 RSC.
- Z. Xu, Y. Huang, C. Min, L. Chen and L. Chen, Radiat. Phys. Chem., 2010, 79, 839–843 CrossRef CAS.
- X. Sui, Z. Xu, C. Hu, L. Chen, L. Liu, L. Kuang, M. Ma, L. Zhao, J. Li and H. Deng, Compos. Sci. Technol., 2016, 130, 46–52 CrossRef CAS.
- A. K. Pathak, M. Borah, A. Gupta, T. Yokozeki and S. R. Dhakate, Compos. Sci. Technol., 2016, 135, 28–38 CrossRef CAS.
- E. Moaseri, M. Maghrebi and M. Baniadam, Mater. Des., 2014, 55, 644–652 CrossRef CAS.
- F. De Luca, A. J. Clancy, N. R. Carrero, D. B. Anthony, H. G. De Luca, M. S. Shaffer and A. Bismarck, Mater. Horiz., 2018, 5, 668–674 RSC.
- S. Otani, Y. Fukuoka, B. Igarashi and K. Sasaki, US Pat., Patent No. 3,461,082, 1969.
- D. A. Baker and T. G. Rials, J. Appl. Polym. Sci., 2013, 130, 713–728 CrossRef CAS.
- S. Aslanzadeh, B. Ahvazi, Y. Boluk and C. Ayranci, J. Appl. Polym. Sci., 2016, 133, 44172 CrossRef.
- S. Aslanzadeh, Z. Zhu, Q. Luo, B. Ahvazi, Y. Boluk and C. Ayranci, Macromol. Mater. Eng., 2016, 301, 401–413 CrossRef CAS.
- S. Aslanzadeh, B. Ahvazi, Y. Boluk and C. Ayranci, J. Eng. Fibers Fabr., 2017, 12, 155892501701200405 Search PubMed.
- D. Montané, D. Nabarlatz, A. Martorell, V. Torné-Fernández and V. Fierro, Ind. Eng. Chem. Res., 2006, 45, 2294–2302 CrossRef.
- O. Hosseinaei, D. P. Harper, J. J. Bozell and T. G. Rials, ACS Sustainable Chem. Eng., 2016, 4, 5785–5798 CrossRef CAS.
- J. J. Bozell, BioResources, 2010, 5, 1326–1327 CAS.
- A. S. Jääskeläinen, T. Liitiä, A. Mikkelson and T. Tamminen, Ind. Crops Prod., 2017, 103, 51–58 CrossRef.
- X. Pan, C. Arato, N. Gilkes, D. Gregg, W. Mabee, K. Pye, Z. Xiao, X. Zhang and J. Saddler, Biotechnol. Bioeng., 2005, 90, 473–481 CrossRef CAS PubMed.
- E. K. Pye and J. H. Lora, Tappi J., 1991, 74, 113–118 CAS.
- J. B. Binder and R. T. Raines, J. Am. Chem. Soc., 2009, 131, 1979–1985 CrossRef CAS PubMed.
- Y. Wang, M. Radosevich, D. Hayes and N. Labbé, Biotechnol. Bioeng., 2011, 108, 1042–1048 CrossRef CAS PubMed.
- Y. Jin, H. Jameel, H. M. Chang and R. Phillips, J. Wood Chem. Technol., 2010, 30, 86–104 CrossRef CAS.
- R. Gonzalez, T. Treasure, R. Phillips, H. Jameel and D. Saloni, BioResources, 2011, 6, 2551–2567 CAS.
- T. Ghosh, T.-D. Ngo, A. Kumar, C. Ayranci and T. Tang, Green Chem., 2019, 21, 1648–1659 RSC.
- D. Salvachúa, E. M. Karp, C. T. Nimlos, D. R. Vardon and G. T. Beckham, Green Chem., 2015, 17, 4951–4967 RSC.
- S. L. Mathews, J. Pawlak and A. M. Grunden, Appl. Microbiol. Biotechnol., 2015, 99, 2339–2354 CrossRef PubMed.
- J. Pérez, J. Muñoz-Dorado, T. De La Rubia and J. Martínez, Int. Microbiol., 2002, 5, 53–56 CrossRef PubMed.
- L. Lin, Y. Li and F. K. Ko, J. Fiber Bioeng. Inf., 2013, 6, 335–347 CrossRef.
- N.-Y. Teng, I. Dallmeyer and J. F. Kadla, J. Wood Chem. Technol., 2013, 33, 299–316 CrossRef CAS.
- I. Dallmeyer, L. T. Lin, Y. Li, F. Ko and J. F. Kadla, Macromol. Mater. Eng., 2014, 299, 540–551 CrossRef CAS.
- M. Cho, M. A. Karaaslan, S. Renneckar and F. Ko, J. Mater. Sci., 2017, 52, 9602–9614 CrossRef CAS.
- O. Hosseinaei, D. P. Harper, J. J. Bozell and T. G. Rials, Int. J. Mol. Sci., 2017, 18, 1410 CrossRef PubMed.
- K. Sudo, K. Shimizu, N. Nakashima and A. Yokoyama, J. Appl. Polym. Sci., 1993, 48, 1485–1491 CrossRef CAS.
- K. Sudo and K. Shimizu, J. Appl. Polym. Sci., 1992, 44, 127–134 CrossRef CAS.
- Y. Uraki, S. Kubo, N. Nigo, Y. Sano and T. Sasaya, Holzforschung, 1995, 49, 343–350 CrossRef CAS.
- S. Kubo, N. Ishikawa, Y. Uraki and Y. Sano, Mokuzai Gakkaishi, 1997, 43, 655–662 CAS.
- S. Kubo, Y. Uraki and Y. Sano, Carbon, 1998, 36, 1119–1124 CrossRef CAS.
- M. K. Bakare, I. O. Adewale, A. O. Ajayi, A. I. Okoh and O. O. Shonukan, Afr. J. Biotechnol., 2005, 4, 838–843 CAS.
- S. Sethi, A. Datta, B. L. Gupta and S. Gupta, ISRN Biotechnol., 2013, 2013, 985685 Search PubMed.
- M. Cho, M. Karaaslan, S. Chowdhury, F. Ko and S. Renneckar, ACS Sustainable Chem. Eng., 2018, 6, 6434–6444 CrossRef CAS.
- H. H. Kim, M. J. Kim, S. J. Ryu, C. S. Ki and Y. H. Park, Fibers Polym., 2016, 17, 1033–1042 CrossRef CAS.
- S. Kubo and J. F. Kadla, Macromolecules, 2004, 37, 6904–6911 CrossRef CAS.
- R. Ruiz-Rosas, J. Bedia, M. Lallave, I. G. Loscertales, A. Barrero, J. Rodríguez-Mirasol and T. Cordero, Carbon, 2010, 48, 696–705 CrossRef CAS.
- J. Spender, A. L. Demers, X. Xie, A. E. Cline, M. A. Earle, L. D. Ellis and D. J. Neivandt, Nano letters, 2012, 12, 3857–3860 CrossRef CAS PubMed.
- C. J. Thompson, G. G. Chase, A. L. Yarin and D. H. Reneker, Polymer, 2007, 48, 6913–6922 CrossRef CAS.
- Q. Wang, J. Yan and Z. Fan, Energy Environ. Sci., 2016, 9, 729–762 RSC.
- W. Zhang, J. Yin, Z. Lin, H. Lin, H. Lu, Y. Wang and W. Huang, Electrochim. Acta, 2015, 176, 1136–1142 CrossRef CAS.
- K. Peuvot, O. Hosseinaei, P. Tomani, D. Zenkert and G. Lindbergh, J. Electrochem. Soc., 2019, 166, A1984–A1990 CrossRef CAS.
- I. Dallmeyer, F. Ko and J. F. Kadla, J. Wood Chem. Technol., 2010, 30, 315–329 CrossRef CAS.
- A. E. Imel, A. K. Naskar and M. D. Dadmun, ACS Appl. Mater. Interfaces, 2016, 8, 3200–3207 CrossRef CAS PubMed.
- F. K. Ko and H. Yang, J. Fiber Bioeng. Inf., 2008, 1, 81–92 CrossRef.
- E. Svinterikos and I. Zuburtikudis, J. Polym. Environ., 2017, 25, 465–478 CrossRef CAS.
- S. F. Dehghan, F. Golbabaei, B. Maddah, M. Latifi, H. Pezeshk, M. Hasanzadeh and F. Akbar-Khanzadeh, J. Air Waste Manage. Assoc., 2016, 66, 912–921 CrossRef CAS PubMed.
- A. Nazir, Doctoral Dissertation, 2016 Search PubMed.
- H. Mohammad Khanlou, B. Chin Ang, S. Talebian, A. Muhammad Afifi and A. Andriyana, Text. Res. J., 2015, 85, 356–368 CrossRef.
- S. Charola, H. Patel, S. Chandna and S. Maiti, J. Clean. Prod., 2019, 223, 969–979 CrossRef CAS.
- T. Rakić, I. Kasagić-Vujanović, M. Jovanović, B. Jančić-Stojanović and D. Ivanović, Anal. Lett., 2014, 47, 1334–1347 CrossRef.
- I. Dallmeyer, F. Ko and J. F. Kadla, Ind. Eng. Chem. Res., 2014, 53, 2697–2705 CrossRef CAS.
- D. Dong and A. L. Fricke, Polymer, 1995, 36, 2075–2078 CrossRef CAS.
- R. Ding, H. Wu, M. Thunga, N. Bowler and M. R. Kessler, Carbon, 2016, 100, 126–136 CrossRef CAS.
- V. Poursorkhabi, A. K. Mohanty and M. Misra, J. Appl. Polym. Sci., 2015, 132 Search PubMed.
- S. Kubo and J. F. Kadla, Holzforschung, 2006, 60, 245–252 CAS.
Footnote |
| † Electronic supplementary information (ESI) available. See DOI: 10.1039/d0ra03412f |
| This journal is © The Royal Society of Chemistry 2020 |

