 Open Access Article
Creative Commons Attribution 3.0 Unported Licence
Impact of sediment parameters in the prediction of benthic microbial fuel cell performance†
Kevin L. Joiner *a,
Gabriel L. Tukemanb,
Anna Y. Obraztsovaa and
Yolanda Meriah Arias-Thodea
aNaval Information Warfare Center, San Diego, USA. E-mail: kevin.l.joiner1@navy.mil
bBaylor College of Medicine, Houston, Texas, USA
First published on 10th July 2020
Abstract
The benthic microbial fuel cell (BMFC) is a promising technology for harvesting renewable energy from marine littoral environments. The scientific community has researched BMFC technology for well over a decade, but the in situ performance remains challenging. To address this challenge, BMFC power experiments were performed on sediment collected from San Diego Bay (CA, USA), La Spezia (Italy) and Honolulu (HI, USA) in the ever-changing littoral environment. Analysis of BMFC laboratory data found the power density varied substantially across 11 sites in San Diego Bay. In addition, data from experiments repeated at four locations in San Diego Bay showed significant differences between experiments performed in 2014, 2016 and 2019. Multivariable linear analysis showed BMFC 90 day cumulative power density was positively correlated with the total organic carbon (p < 0.05) and negatively correlated with the black carbon in the sediment (p < 0.05). Regression coefficients trained on the San Diego Bay data from 2014 facilitated accurate predictions of BMFC performance in 2016 and 2019. The modeling paradigm accurately explained variations in BMFC power performance in La Spezia and showed sediment parameters can impact BMFC performance differently across geographic regions. The results demonstrate a great potential to use sediment parameters and statistical modeling to predict BMFC power performance prior to deployment in oceanographic environments, thereby reducing cost, work force and resources.
1 Introduction
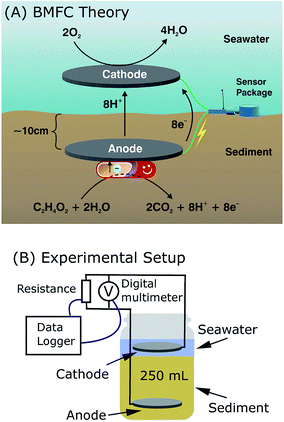
Traditionally, oceanographic devices and sensors are powered via battery or similar sources, that become depleted and need constant replacement, maintenance, or are discarded in place. Benthic microbial fuel cells (BMFCs) are nature friendly, low maintenance, bioelectrochemical systems for harvesting continuous electrical power from marine environments.1–5 Though the amount of power produced by BMFCs in the field is on the order of 0.1–0.5 watts,3,6 recent field deployments have demonstrated their ability to sustain low-power oceanographic equipment, either as a sole energy source or by supplementing traditional power sources, with little or no maintenance.6 This increased practicality of BMFCs has increased the need to know their potential power performance prior to field deployment by identifying and quantifying certain site-specific sediment qualities that optimize their power output.2,7–10 While BMFCs are desirable alternative power sources for low-power marine devices and sensors,1,3,4,8,11 their in situ predictability presents a challenge.During the harvesting process, naturally occurring anaerobic microorganisms in sediment convert chemical energy into electrical energy through oxidation and reduction reactions.1,9,12,13 These catalytic reactions are facilitated with electrically connected anodes, which are buried in sediment, and cathodes, which are suspended in the overlying water column. Microbes at the anode metabolize organic substrates and electrons are transferred to oxygen, which serve as the terminal electron acceptor at the cathode. Finally, current production is sustained in these benthic environments via a constant influx of replacement nutrients, supplying electrons by way of natural water flow, often through pore water.14
Microbial fuel cell field performance in marine environments has been researched for approximately two decades, but most studies have focused on fairly isolated geographic areas.2,3,8–11,15,16 For example, in more classical studies, Reimers et al. (2001)8 simulated the marine environment in a laboratory using sediments extracted from a salt marsh near Tuckerton (NJ, USA) and an estuarine site within Raritan Bay (NJ, USA) to show microbial fuel cells could power oceanographic instruments deployed for long-term monitoring. Tender et al. (2002)10 deployed two SMFCs in coastal marine environments, in Tuckerton, and Yaquina Bay Estuary (OR, USA) to observe the potential gradient between an anode buried in marine sediment and a cathode in overlying seawater and show the possibility of power generation from marine sediment. Reimers et al. (2006) showed that a cold seep has the potential to provide more power than neighboring ocean sediments in Monterey Canyon (CA, USA).11 Donovan et al. (2008) deployed a SMFC in the Palouse River (WA, USA) to power a wireless temperature sensor2 and Tender et al. (2008) demonstrated MFCs can power sonobuoys located in the Potomac River, Washington D.C and a salt marsh near Tuckerton.3 In more recent and relevant studies, Zhao et al. (2016) collected sediment from Horseshoe Lake (North China) to investigate how variation in organic matter loading affected electricity generation in SMFCs15 and Kubota et al. (2019) operated a set of five SMFC's at a single site on the seafloor in Tokyo Bay, to evaluate their electrochemical characteristics and effects of sediment on the anode.16 Such geographically confined case studies may vastly misrepresent MFC performance across large regions as microbial communities may shift or adapt due to varying substrate distributions or other environmental pressures. This is crucial, as locations with different sediment quality may yield varying results in sediment based MFC power leading to either the success or failure of their desired application.
One means of determining sediment quality is by measuring the total organic carbon (TOC) present in the sediment.17 Under relatively dry conditions, soil/sediment minerals act as adsorbents of organic matter, where sorbed organic compounds are held on the minerals surface.17 Previous studies have shown some amount of positive correlation between sediment TOC concentration and power production in microbial fuel cells.11,18 However, there have been few studies demonstrating how or if total organic carbon, either solely or in combination with other predictors, can be used to efficiency predict BMFC power production. Another means of determining sediment quality, is by measuring its amount of black carbon (BC)—the carbonaceous residue of incomplete combustion of organic matter and includes compounds such as charred biomass and soot.19 Numerous studies of sediment carbon have demonstrated the ubiquitous presence of BC in the environment.19–21 For instance, black carbon is deposited into marine sediments via rivers and (or) atmospheric transport mechanisms.20 Previous studies have shown that BC accounts for 4–22% of marine dissolved organic matter and 9% of TOC in sediments worldwide.19,21 These compounds are resistant to thermal or chemical degradation, and their resistivity to breakdown makes BC representative of a carbon sink in the environment.22–24 Additionally, BC is resistant to microbial breakdown preventing its use as a nutrient source in the case of BMFC's.22 Given the promising potential of BMFC's as an alternative energy source and the relatively unknown effect of BC on BMFC power production, this makes the impact of BC on BMFC power production an important and interesting topic for study.
We hypothesize BMFC power performance can be forecasted using sediment characteristics (such as TOC, BC, C![[thin space (1/6-em)]](https://www.rsc.org/images/entities/char_2009.gif) :
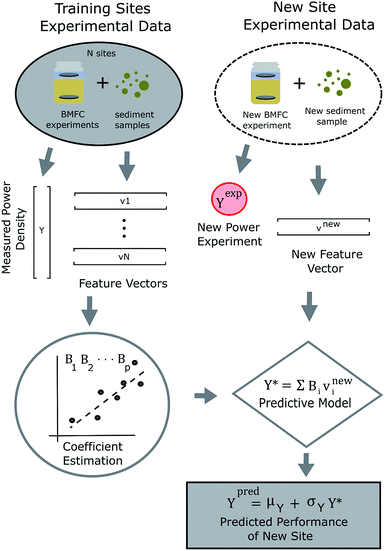
:![[thin space (1/6-em)]](https://www.rsc.org/images/entities/char_2009.gif) N and grain size) as predictors. To test this hypothesis, a relatively simple statistical learning process for predicting BMFC power performance was conceived and its schematic is shown in Fig. 1. For the process, feature vectors of sediment characteristics from sites near one another were used to described larger geographic regions in a quantitative manner. A generalized statistical model, using tunable parameters (an array of B's), makes predictions on BMFC performance at new sites within a region. For this study, the process was put into practice using sediment samples collected from San Diego Bay (see Fig. 2) that provided natural fuel for BMFC power density experiments in the laboratory. A multivariable linear regression model was constructed and trained on the BMFC power density response to TOC and BC sediment features in local sediment. The model was then used to predict BMFC performance for experiments repeated two and three years later for four sites in San Diego Bay. Training the model on sediment and BMFC power performance data from four sediment samples from La Spezia (Italy) and three sediment samples from Honolulu (HI, USA) tested the robustness of modeling parameters outside the San Diego region. The predictors relative dispersion and a measure of their contribution to the predicted BMFC power performance response provided insight into possible physical mechanisms behind long-term BMFC performance in different sediment conditions.
N and grain size) as predictors. To test this hypothesis, a relatively simple statistical learning process for predicting BMFC power performance was conceived and its schematic is shown in Fig. 1. For the process, feature vectors of sediment characteristics from sites near one another were used to described larger geographic regions in a quantitative manner. A generalized statistical model, using tunable parameters (an array of B's), makes predictions on BMFC performance at new sites within a region. For this study, the process was put into practice using sediment samples collected from San Diego Bay (see Fig. 2) that provided natural fuel for BMFC power density experiments in the laboratory. A multivariable linear regression model was constructed and trained on the BMFC power density response to TOC and BC sediment features in local sediment. The model was then used to predict BMFC performance for experiments repeated two and three years later for four sites in San Diego Bay. Training the model on sediment and BMFC power performance data from four sediment samples from La Spezia (Italy) and three sediment samples from Honolulu (HI, USA) tested the robustness of modeling parameters outside the San Diego region. The predictors relative dispersion and a measure of their contribution to the predicted BMFC power performance response provided insight into possible physical mechanisms behind long-term BMFC performance in different sediment conditions.
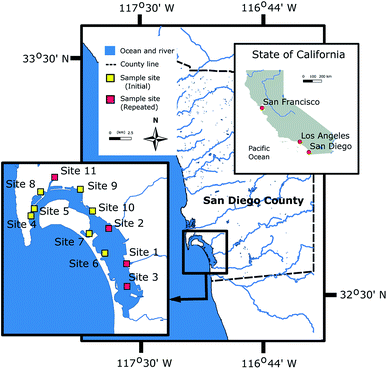 | ||
| Fig. 2 Location of sediment sampling in San Diego Bay. Multiple samples were collected at all locations. See the ESI Table S.1† for precise locations. Sites labeled as “repeated” denote BMFC experiments and sediment analyses performed three years after those labeled as “Initial”. | ||
2 Experimental
2.1 Station sediment sampling and preparation for analyses
Sediments were collected from eleven locations in San Diego Bay (CA, USA) (Fig. 2) and two sites in La Spezia (Italy) (see Table S1† for exact locations) during sampling campaigns conducted between 2014 and 2016. Some sediment samples from the same locations in San Diego Bay and two additional sites in Honolulu (HI, USA) were obtained in 2019 to repeat sediment analyses and BMFC experiments. Sample collections were dictated by areas where BMFC systems were deployed. The collection depths of sediment were about 5 (San Diego Bay), 10 (La Spezia) and 12–14 m (Honolulu). The bulk of the sediment was scooped from approximately 20 cm into the surface with a Van Veen grab sampler, placed into glass jars and brought to the cold room (4 °C) to store until use.Sediment samples were analyzed at ALS (Australian Laboratory Services) Environmental (Tucson, AZ) for carbon, hydrogen and nitrogen (C![[thin space (1/6-em)]](https://www.rsc.org/images/entities/char_2009.gif) :
:![[thin space (1/6-em)]](https://www.rsc.org/images/entities/char_2009.gif) N ratio), total organic carbon (TOC), total black carbon, and grain size (for sand and silt percentages). In order to prepare sediments for analyses, approximately 1 kg of each sample were homogenized and large organic and non-organic fragments were removed. Then, duplicate samples (0.15 kg each) were sent for analysis to ALS Environmental where sediments were lightly ground and split into sub-samples, one for particle size and one for elemental analyses. Wet sediment samples were air dried at 40 °C for several days and measured for moisture loss to determine water content. Afterwards, the sub-samples were ground to a fine powder. For grain size analysis, sediments were classified using a wet sieve analysis for cementation of sediment particles. Samples were mixed with a 4% sodium hexametaphosphate dispersing agent and allowed to soak for 16 hours. This slurry solution was then blended with deionized rinse water at 10
N ratio), total organic carbon (TOC), total black carbon, and grain size (for sand and silt percentages). In order to prepare sediments for analyses, approximately 1 kg of each sample were homogenized and large organic and non-organic fragments were removed. Then, duplicate samples (0.15 kg each) were sent for analysis to ALS Environmental where sediments were lightly ground and split into sub-samples, one for particle size and one for elemental analyses. Wet sediment samples were air dried at 40 °C for several days and measured for moisture loss to determine water content. Afterwards, the sub-samples were ground to a fine powder. For grain size analysis, sediments were classified using a wet sieve analysis for cementation of sediment particles. Samples were mixed with a 4% sodium hexametaphosphate dispersing agent and allowed to soak for 16 hours. This slurry solution was then blended with deionized rinse water at 10![[thin space (1/6-em)]](https://www.rsc.org/images/entities/char_2009.gif) 000 RPM for one minute prior to sieving. The silt clay boundary was taken at 100 μm and sediment components that passed through were considered silt (per ALS Environmental procedures) (Fig. 3).
000 RPM for one minute prior to sieving. The silt clay boundary was taken at 100 μm and sediment components that passed through were considered silt (per ALS Environmental procedures) (Fig. 3).
2.2 BMFC power production experiments
In all subsequent experiments, MadgeTech™ 8 Channel ± 100 mV data loggers were used to collect current measurements of each BMFC system. Customized potentiostat boards25 were fitted with 1000 Ω, 499 Ω, 100 Ω, and 49.9 Ω resisters to ensure that the fuel cells were held at 0.4 V while remaining within the reading-frame of the MadgeTech™, which was −100 mV to 100 mV. Each potentiostat board was powered by a 9 V battery, which was changed when needed. Electronics were housed within a 2.9 gallon leak-proof container with a desiccant to remove excess moisture. The cathode–anode voltage was recorded manually every day for power output calculations. The MadgeTech data loggers were programmed to record voltage measurements once every five minutes for a sample rate of 12 times per hour. The data was downloaded every few days to track progress and determine the need for battery or resistor replacement.
2.3 Statistical analysis and modeling
 , was calculated over i = 1, …, K replicate experiments. Summing the average power densities together and dividing by the total number of sampling weeks, W, gave each sites cumulative average power density:
  for WΔt days. For example, if W = 13 weeks then WΔt = 90 days. Independent t-tests were used to determine any difference between power density curves. Two way mixed analysis of variance (ANOVA) was used to test for significant correlations between cumulative average power densities and sediment qualities (carbon concentrations and grain size). The significance level of the p-values for all tests was set at p ≤ 0.05.
![[thin space (1/6-em)]](https://www.rsc.org/images/entities/char_2009.gif) :
:![[thin space (1/6-em)]](https://www.rsc.org/images/entities/char_2009.gif) N, grain size) and one dependent variable
N, grain size) and one dependent variable  was specified as
where βj was the regression coefficient associated with the jth predictor, Xj, and ε was the random error with variance σ2 and zero mean.26 A randomly selected set of n observations from a given region consisted of the set {yi, xi1, xi2, …, xip}, i = 1, 2, …, n where each entry represented the ith sites response (yi) to the predictors (xi1, xi2, …, xip). Using this data set, the response and predictor variables where expressed in a standardized form, having zero mean and vector length one, via the formulas
 | (1) |
 | (2) |
 . Estimated responses (predictions) were computed as ŷ = μy + σyy*.
 different submodels each with k variables, k = 0, 1, …, (p − 1). Expressed mathematically,
where xh is any subset of k predictors with xj excluded and
 denotes the sum over all
  submodels. The proportion of variance explained, R2 (abbreviated Rsq.), was calculated using the formula
| R2 = 1 − RSS/TSS |
 and
and  . Then, Dj is obtained by averaging over all p submodel sizes, namely;
 | (3) |
In this way, Dj offers a general framework for determination of relative impact of predictors in the linear multiple regression model.
3 Results and discussion
3.1 San Diego Bay 2014 experiments and modeling
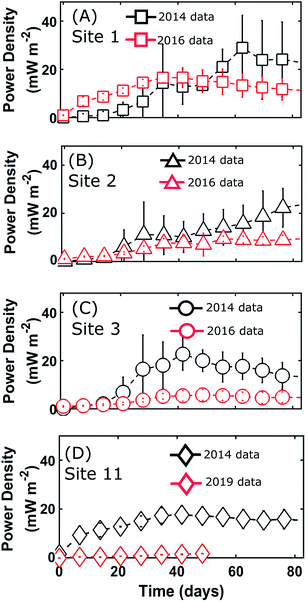
BMFC power experiments were performed on sediments from 11 sites around San Diego Bay in 2014 (Fig. 2). During these BMFC experiments, the power density curves for each of the 11 sites tended to begin with a lag-phase lasting anywhere from days to weeks, with a slight peak followed by either a steady or slowly decaying state (see Fig. 4 and ESI Fig. S.1†). These traits are typical of power density curves observed in BMFCs—during the startup phase, there is a sufficient supply of nutrient to the biofilm, but as nutrients are consumed over time, power production becomes dependent on a fresh supply of nutrient presumably through pore water. The cumulative average power densities, , of the lab experiments ranged from 0.38 to 14.0 mW m−2 (ESI Table S.2†), that were on the same order of average power densities found in previous studies of benthic microbial fuel cells8,10,11,29 (10–34 mW m−2). The BMFC population mean cumulative average power density from the San Diego Bay sediments was μPd = 6.92 mW m−2 with standard deviation σPd = 4.99. These results indicated BMFC power performance was not constant, but instead varied across the different sites in the San Diego Bay region.
Laboratory analysis revealed sediment quality was highly varied throughout San Diego Bay and its geochemical and textural properties is given in ESI Table S.2.† Carbon to nitrogen ratios varied near or around typical values (8 to 17) found in soil samples throughout the world.30 The sediment TOC content ranged from 0.15 to 1.96 (wt%). The extreme high values of TOC were found at site 11 where the sediment grain size was fairly fine at 94.1 (wt%) silt & clay. The lowest value of TOC was 0.15 (wt%) and found at site 10 which was composed of 11.4 (wt%) silt & clay with coarse, sandy sediment conditions. The BC content of sediment ranged from a low of 0.10 to a high of 0.25 (wt%) but did not appear to be well correlated with any other sediment characteristics. The sample means and standard deviations of TOC and BC where μTOC = 0.97 (wt%), σTOC = 0.60 and μBC = 0.18 (wt%), σBC = 0.05 respectively.
Testing different linear combination of the sediment parameters (TOC, BC, C![[thin space (1/6-em)]](https://www.rsc.org/images/entities/char_2009.gif) :
:![[thin space (1/6-em)]](https://www.rsc.org/images/entities/char_2009.gif) N and grain size) analyzed for this study revealed TOC and BC to be the most significant predictors in explaining the variance in BMFC cumulative average power densities across test samples. Thus, the final model was specified to be
N and grain size) analyzed for this study revealed TOC and BC to be the most significant predictors in explaining the variance in BMFC cumulative average power densities across test samples. Thus, the final model was specified to be
 | (4) |
Ordinary least squares was applied using data on the 11 initial samples in San Diego Bay (ESI Table S.2†) giving the fitted parameters BTOC = 1.55 and BBC = −1.06. ANOVA statistics (ESI Table S.3†) revealed, for the model defined by eqn (4), the TOC and BC concentrations together explained 71% of the variation in cumulative average power density (Rsq. = 0.71) and the model using both TOC and BC as predictors fit the power data better than only the mean cumulative average power density (p < 0.05, ANOVA). Interestingly, the cumulative average power densities for the 2014 San Diego Bay data were positively correlated (p < 0.05, ANOVA) with the percent of TOC and negatively correlated (p < 0.05, ANOVA) with the percent of BC found in the sediment.
Co-linear relationships existed (p < 0.05, ANOVA) between TOC, and the grain size and BC concentration in the sediment, according to the simple linear regression models26
 | (5) |
3.2 Predicting BMFC performance in San Diego Bay
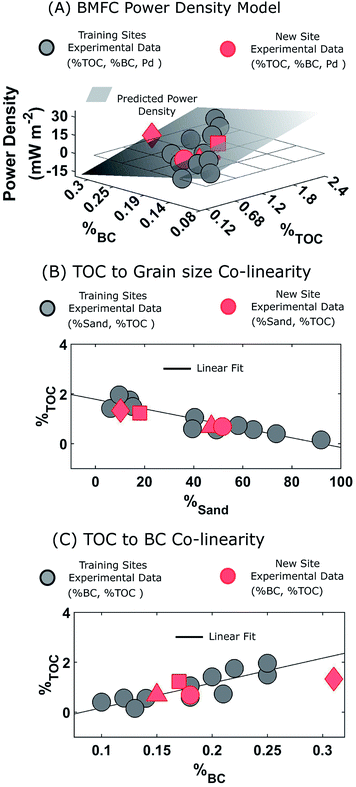
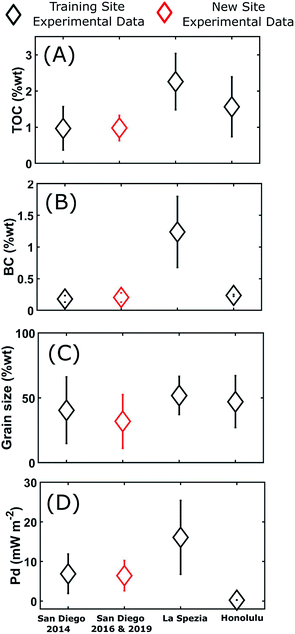
Sediment collection and BMFC experimental data from three San Diego Bay sites (site 1, site 2, site 3) in 2016 and one site (site 11) in 2019 facilitated “New Sites” (see Fig. 1) whose BMFC power performance could be predicted using eqn (4) and compared with actual experimental data. Analysis of the average power density curves, , between the 2014 and later experiments in 2016 and 2019 (Fig. 4) showed similar power performances for site 1 but significant differences between those conducted for sites 2,3 and 11 (p < 0.05, 95% CI, t-test). Sediment TOC and BC data for the four repeated experiments (Table 1) had sample means: μTOC = 0.98 (wt%) and μBC = 0.20 (wt%) with standard deviations σTOC = 0.35 and σBC = 0.07. Thus, the new site data was comparatively similar to the 2014 experiments (Fig. 6) and therefore did not constitute any major extrapolation of the predictive model. The TOC and sand percentages in each of the samples were closely correlated (Fig. 5B) as predicted by eqn (5).
| Sample | TOC (wt%) | BC (wt%) | Sand (wt%) | |||
|---|---|---|---|---|---|---|
| San Diego Bay (CA, USA) | Site 1 | 1.23 | 0.17 | 18.0 | 11.8 | 11.3 |
| Site 2 | 0.68 | 0.15 | 47.2 | 6.23 | 6.25 | |
| Site 3 | 0.68 | 0.18 | 51.7 | 3.89 | 3.20 | |
| Site 11 | 1.33 | 0.31 | 10.3 | 0.89 | −1.67 | |
| La Spezia (Italy) | ITBG 1 | 2.13 | 1.66 | 65.4 | 6.08 | 10.0 |
| ITBG 2 | 1.37 | 1.71 | 61.2 | 10.9 | 7.57 | |
| ITSM 1 | 3.26 | 1.06 | 33.0 | 23.7 | 20.8 | |
| ITSM 2 | 2.29 | 0.52 | 47.7 | 25.8 | 26.0 | |
| Honolulu (Hawaii, USA) | HIWA 1 | 1.67 | 0.22 | 33.3 | 0.28 | 0.25 |
| HIWA 2 | 2.33 | 0.24 | 37.8 | 0.31 | 0.29 | |
| HIHI | 0.69 | 0.25 | 70.0 | 0.26 | 0.29 |
The TOC and BC predictors in eqn (4) were standardized using the population means and standard deviations from the 2014 data. The regression coefficients were as trained on the San Diego Bay 2014 data (i.e. BTOC = 1.55 and BBC = −1.06). Fig. 5A shows, for all four sites laboratory experiments, the cumulative average power densities fell near the plane defined by eqn (4) indicating a good predictive quality of the power performance model. The BMFC power performance from the laboratory experiments and the model for the San Diego Bay locations in 2016 and 2019 is shown in Table 1. The results show, although the power curves were significantly different between several of the 2014 and follow on experiments, BMFC power performance could be accurately forecasted (Rsq. = 0.90) using the TOC and BC characteristics of the surrounding sediment and a trained model.
As a check to rule out variations in the experimental setup between experiments, it was verified the anodes and cathodes for all reactors and all experiments where the same distance apart. Since the geochemical and grain size data of the sediment so closely fit the initial model in eqn (5), anomalies in the laboratory measurements of the replicate data were ruled out. For all four sites, the C![[thin space (1/6-em)]](https://www.rsc.org/images/entities/char_2009.gif) :
:![[thin space (1/6-em)]](https://www.rsc.org/images/entities/char_2009.gif) N ratios were similar between the initial 2014, 2016 and 2019 BMFC experiments (see ESI Table S.2†) and grain size was well correlated with TOC (see Fig. 5A). However, there were different TOC and BC content between the two and three year time frames of the initial and follow on experiments. Therefore, it was concluded the variability of power production observed at the replicated site data was attributed to bacterial distribution, their decomposition rates of the organic carbon, and the content of black carbon present in the sediments as predicted by the model.
N ratios were similar between the initial 2014, 2016 and 2019 BMFC experiments (see ESI Table S.2†) and grain size was well correlated with TOC (see Fig. 5A). However, there were different TOC and BC content between the two and three year time frames of the initial and follow on experiments. Therefore, it was concluded the variability of power production observed at the replicated site data was attributed to bacterial distribution, their decomposition rates of the organic carbon, and the content of black carbon present in the sediments as predicted by the model.
3.3 Extending the modeling paradigm to other regions: La Spezia and Honolulu
The results of the San Diego Bay analysis indicated large-scale site monitoring is essential for identifying trends and drivers of BMFC power performance across a particular region of interest. However, this is highly challenging and costly in terms of coordination, labor and funding – particularly in marine littorals, where access to field sites is difficult and working conditions are harsh. Thus, it was of great interest if the modeling paradigm could capture the variation in BMFC performance, , at two sites in La Spezia (ITBG and ITSM) and two sites in Honolulu (HIWA and HIHI) based on their respective TOC and BC feature vectors. For the interested reader, ESI Fig. S.2† depicts power curves for La Spezia (panels A and B) and Honolulu (panels C and D).
The La Spezia sites were only approximately 3 meters from each other, but their sediment characteristics were quite varied (Table 1). One site (ITBG) was close to a seawall (about 3 meters on either side) and had detritus from bushes and trees. The other site (ITSM) was closer to the La Spezia Bay and had less detritus. The sediment samples, ITBG 1, ITBG 2, ITSM 1 and ITSM 2, had on average higher levels of TOC and BC and were sandier than the San Diego Bay sites (Fig. 6). For the La Spezia sites: μTOC = 2.26 (wt%) and μBC = 1.24 (wt%) with standard deviations σTOC = 0.78 and σBC = 0.56. Therefore, it was concluded the La Spezia sediment data would have resulted in a significant extrapolation of the BMFC power performance model, and its parameters were recomputed. The BMFC population mean cumulative average power density from the La Spezia sediments was much higher than that from San Diego Bay with mean μPd = 16.1 mW m−2 and standard deviation σPd = 9.31 (Fig. 6). Using eqn (1) to standardize the La Spezia TOC and BC concentrations and fitting eqn (4) for BTOC = 0.15 and BBC = −0.64 explained 89% of the variation in cumulative average power density (Rsq. = 0.89). Although it should be noted the data size consisted of only four samples, the results indicated a positive increase in the mean response with respect to TOC and a negative increase with respect to the BC predictor variables.
The first Hawaii sample, HIWA 1, was 14.0 meters deep and located approximately 185 meters from Waipi'o point; situated in the continuously dredged channel entering Pearl Harbor. The second Hawaii sample, HIWA 2, was 12.2 meters deep and was located approximately 13 meters away from a pier. Both samples consisted of very fine unconsolidated sediment. The third Honolulu site HIHI, was situated close to Hickam Airfield. These sites were found to have, on average, higher levels of TOC and were more sandy than the San Diego Bay sites, but with similar concentrations of BC (Fig. 6). For the Honolulu sites: μTOC = 1.56 (wt%) and μBC = 0.24 (wt%) with standard deviations σTOC = 0.83 and σBC = 0.02. The BMFC population mean cumulative average power density from the Honolulu sediments was very low with respect to the San Diego Bay sediments with μPd = 0.29 mW m−2 with standard deviation σPd = 0.03 (Fig. 6). As shown in Table 1, repeating the standardization procedure and solving eqn (4) gave BTOC = 0.28 and BBC = 0.84 which explained 100% of the variation in cumulative average power density (Rsq. = 1.00), but importantly, the data size consisted of only three samples. It remains unknown why such low power performance was observed for the Honolulu samples although very high C![[thin space (1/6-em)]](https://www.rsc.org/images/entities/char_2009.gif) :
:![[thin space (1/6-em)]](https://www.rsc.org/images/entities/char_2009.gif) N ratios ∼100 was recorded for the samples.
N ratios ∼100 was recorded for the samples.
3.4 Impact of sediment parameters on BMFC performance
The investigations of this study found TOC and BC to be the most significant predictors of BMFC power performance. Multivariate analysis on the San Diego Bay region revealed (p < 0.05) TOC levels were positively related (BTOC > 0) to power performance while BC levels were negatively related to power performance (BBC < 0). These observed relationships were also expressed for the La Spezia region. In regards to the contribution of TOC, it is noted bacteria are needed to act as the biocatalysts for generating BMFC power from marine sediment, but their growth rate (and thereby BMFC power production) can be affected by organic carbon availability.10 Therefore, fluctuations of TOC drive likewise fluctuations in BMFC cumulative average power density. Additionally, the results of this study suggest for some environments, black carbon also plays a role in limiting BMFC power output. These results are especially interesting in light of other findings in the literature which have shown several types of black carbons found in the environment, such as activated carbon, graphite powder, chars, and soot are chemically active in specific oxidation and reduction reactions31–33 which are the driving mechanism of BMFC power production. However, the different magnitude of B's between the San Diego (BTOC = 1.55 and BBC = −1.06) and La Spezia (BTOC = 0.28 and BBC = −0.84) regions suggest for BMFC's deployed in vastly different oceanographic environments, the extent to which TOC and BC contribute to BMFC power performance may be different.To better illustrate the TOC and BC contribution phenomena, the relative contribution of TOC and BC were estimated using eqn (3) to rank the TOC and BC contribution for explaining BMFC power performance based on their dominance indices, DTOC and DBC respectively. The dominance indices for the San Diego Bay, La Spezia and Honolulu regression models is shown in Fig. 7 along with the associated BMFC power performance model's R-squared values. For San Diego Bay, TOC explained 0.52/0.71 = 73% to 0.78/0.90 = 87% of the total variance in BMFC performance,  . Including BC into the multivariate model further explained 27% to 13% more variance than TOC alone. A similar analysis on the La Spezia results show BC explained 75% more variance than TOC alone. Hence, the negative impact of BC on BMFC power performance was more pronounced in the La Spezia sediments than those from San Diego Bay.
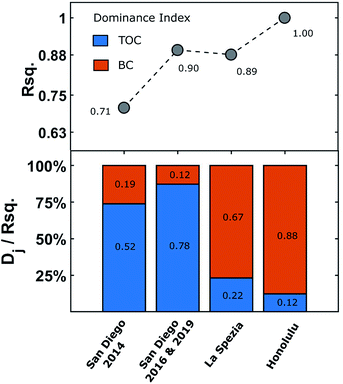 | ||
Fig. 7 Dominance indices of regression parameters (TOC and BC) contribution on BMFC cumulative average power density:  . . | ||
4 Conclusions
This study addressed the in situ predictability, expansion of research geography and the impact of sediment parameters on BMFC power performance research. The natural environment presents a host of variables which may affect BMFC performance in intercorrelated and unknown ways. By considering an array of parameters (TOC, BC, C![[thin space (1/6-em)]](https://www.rsc.org/images/entities/char_2009.gif) :
:![[thin space (1/6-em)]](https://www.rsc.org/images/entities/char_2009.gif) N and grain size) this study isolated two parameters (TOC and BC) as significant contributors to BMFC performance in terms of BMFC cumulative average power density. Sampling campaigns were conducted over a broad area of interest in San Diego Bay (CA, USA) and methods were extended to La Spezia (Italy) and Honolulu (HI, USA). Importantly, multivariate modeling successfully generated parameters (B's) to capture the impact of TOC and BC on BMFC power performance across spatially and temporally separated sediment samples. Dominance analysis was utilized to illustrate the negative impact of BC on BMFC power performance.
N and grain size) this study isolated two parameters (TOC and BC) as significant contributors to BMFC performance in terms of BMFC cumulative average power density. Sampling campaigns were conducted over a broad area of interest in San Diego Bay (CA, USA) and methods were extended to La Spezia (Italy) and Honolulu (HI, USA). Importantly, multivariate modeling successfully generated parameters (B's) to capture the impact of TOC and BC on BMFC power performance across spatially and temporally separated sediment samples. Dominance analysis was utilized to illustrate the negative impact of BC on BMFC power performance.
Multivarate analysis proved to be a valuable tool to be employed by research scientists and engineers to predict large scale BMFC performance in diverse littoral environments and facilitate optimal sensor placement. However, the observed dissimilarities of organic carbon contributions across the San Diego Bay, La Spezia and Honolulu regions (Fig. 7) may indicate shifts in the diversity of the bacteria comprising the anode biofilm or an adaptation of the microbial population. Hence, accurate BMFC prediction requires regionally specific modeling. The observed higher levels of BC inhibited or, at the very least, restricted optimal BMFC power performance of in marine sediments. It remains unknown what types of black carbon where encountered between the San Diego Bay, La Spezia and Honolulu sampling territories. More so, the precise mechanism for how black carbon effects BMFC power production (as an adsorbent, electron acceptor or otherwise). Thus, the effects of black carbon on BMFC performance should remain an interesting topic of further research.
As a final remark, while the power densities produced in the laboratory for this study are consistent with those from previous in situ studies,8,10,29 it is important to note that in the natural coastal aquatic environment, daily variations in temperature, salinity, and water velocity can introduce variations in BMFC power performance8,10,29 not captured in the laboratory. Therefore, the laboratory results of this study should represent typical BMFC performance in the field with variations due to contributions from naturally occurring variables.
Conflicts of interest
There are no conflicts to declare.Acknowledgements
Special thanks to Dr Bart Chadwick and Dr Ken Richter for recommending the experiments and Dr Antoni Luque and James Mullinix from the Viral Information Institute at San Diego State University for offering statistical insight. K. L. J. acknowledges the support by the Department of Defense SMART program. All authors acknowledge support by the Navy Innovation Science and Engineering Section 219 funds and ONR Grant: N0001419WX01686. All authors acknowledge Stephen Smith, the U.S. Navy diver who collected the sediment samples.Notes and references
- D. J. Lee, J. S. Chang and J. Y. Lai, J. Power Sources, 2015, 198, 891–895 CAS.
- C. Donovan, A. Dewan, D. Heo and H. Beyenal, Environ. Sci. Technol., 2008, 42, 8591–8596 CrossRef CAS PubMed.
- L. Tender, S. Gray, E. Groveman, D. Lowy, P. Kauffman, J. Melhado, R. C. Tyce, D. Flynn, R. Petrecca and J. Dobarrog, J. Power Sources, 2008, 179, 571–575 CrossRef CAS.
- A. Wotawa-Bergen, D. Chadwick, K. Richter, L. Tender, C. Reimers and Y. Gong, Oceans - St. John's, IEEE, 2006, pp. 1–5 Search PubMed.
- D. Lovely, Curr. Opin. Biotechnol., 2006, 17, 327–332 CrossRef PubMed.
- Y. M. Arias-Thode, L. Hsu, G. Anderson, R. Babauta, J. Fransham, A. Obraztsova and D. B. Chadwick, J. Power Sources, 2017, 356, 419–429 CrossRef CAS.
- J. Kagan, L. Hsu, A. Higier, Y. Arias-Thode, D. Chadwick and H. Beyenal, Oceans – St. John's, 2014, pp. 1–5 Search PubMed.
- C. Reimers, L. Tender, S. Fertig and W. Wang, Environ. Sci. Technol., 2001, 35, 192–195 CrossRef CAS PubMed.
- F. Rezaei, T. L. Richard, R. A. Brennan and B. E. Logan, Environ. Sci. Technol., 2007, 41, 4053–4058 CrossRef CAS PubMed.
- L. M. Tender, C. E. Reimers, H. A. Stecher III, D. E. Holmes, D. R. Bond, D. A. Lowy, K. Pilobello, S. J. Fertig and D. R. Lovley, Nat. Biotechnol., 2002, 20, 821 CrossRef CAS PubMed.
- C. Reimers, P. Girguis, H. Stecher, L. Tender, N. Ryckelynck and P. Whaling, Geobiology, 2006, 4, 123–136 CrossRef CAS.
- D. R. Lovley and E. J. Phillips, Appl. Environ. Microbiol., 1988, 54, 1472–1480 CrossRef CAS PubMed.
- C. E. Reimers, H. A. Stecher, J. C. Westall, Y. Alleau, K. A. Howell, L. Soule, H. K. White and P. R. Girguis, Appl. Environ. Microbiol., 2007, 73, 7029–7040 CrossRef CAS PubMed.
- D. A. Hansell and C. A. Carlson, Biogeochemistry of marine dissolved organic matter, Academic Press, 2014 Search PubMed.
- Q. Zhao, R. Li, M. Ji and Z. J. Ren, Bioresour. Technol., 2016, 220, 549–556 CrossRef CAS PubMed.
- K. Kubota, T. Watanabe, H. Maki, G. Kanaya, H. Higashi and K. Syutsubo, Bioresour. Technol. Rep., 2019, 6, 39–45 CrossRef.
- C. Chiou and D. Kile, U.S. Geological Survey Fact Sheet, 2000 Search PubMed.
- K. Richter and J. Ayers, Appl. Sci., 2018, 8, 2628 CrossRef CAS.
- A. A. Koelmans, M. T. Jonker, G. Cornelissen, T. D. Bucheli, P. C. Van Noort and Ö. Gustafsson, Chemosphere, 2006, 63, 365–377 CrossRef CAS PubMed.
- A. Malits, R. Cattaneo, E. Sintes, J. M. Gasol, G. J. Herndl and M. G. Weinbauer, Aquat. Microb. Ecol., 2015, 75, 27–42 CrossRef.
- C. Bogdal, T. D. Bucheli, T. Agarwal, F. S. Anselmetti, F. Blum, K. Hungerbühler, M. Kohler, P. Schmid, M. Scheringer and A. Sobek, J. Environ. Monit., 2011, 13, 1316–1326 RSC.
- T. Kuhlbusch and P. Crutzen, Global Biogeochem. Cycles, 1995, 9, 491–501 CrossRef CAS.
- G. Shrestha, S. J. Traina and C. W. Swanston, Sustainability, 2010, 2, 294–320 CrossRef CAS.
- M. W. Schmidt and A. G. Noack, Global Biogeochem. Cycles, 2000, 14, 777–793 CrossRef CAS.
- J. T. Babauta, M. Kerber, L. Hsu, A. Phipps, D. B. Chadwick and Y. M. Arias-Thode, J. Power Sources, 2018, 395, 98–105 CrossRef CAS.
- R. H. Myers and J. S. Milton, A First Course in the Theory of Linear Statistical Models, McGraw-Hill, New York, 1998 Search PubMed.
- Y.-C. E. Chao, Y. Zhao, L. L. Kupper and L. A. Nylander-French, J. Occup. Environ. Hyg., 2008, 5, 519–529 CrossRef PubMed.
- D. V. Budescu, Psychol. Bull., 1993, 114, 542 Search PubMed.
- K. Scott, I. Cotlarciuc, I. Head, K. Katuri, D. Hall, J. Lakeman and D. Browning, J. Chem. Technol. Biotechnol., 2008, 83, 1244–1254 CrossRef CAS.
- A. F. Pitty, Geography and soil properties, Routledge, 2020 Search PubMed.
- X. Zhang, K. Guo, D. Shen, H. Feng, M. Wang, Y. Zhou, Y. Jia, Y. Liang and M. Zhou, Sci. Rep., 2017, 7, 6981 CrossRef PubMed.
- W. Xu, K. E. Dana and W. A. Mitch, Environ. Sci. Technol., 2010, 44, 6409–6415 CrossRef CAS PubMed.
- F. P. Van Der Zee, I. A. Bisschops, G. Lettinga and J. A. Field, Environ. Sci. Technol., 2003, 37, 402–408 CrossRef CAS PubMed.
Footnote |
| † Electronic supplementary information (ESI) available. See DOI: 10.1039/d0ra03459b |
| This journal is © The Royal Society of Chemistry 2020 |

