 Open Access Article
Defect ferromagnetism induced by lower valence cation doping: Li-doped SnO2 nanoparticles†
S. Akbar *ab,
S. K. Hasanain‡
b,
O. Ivashenko§
 a,
M. V. Dutkaa,
N. Z. Ali¶
 c,
G. R. Blake
 a,
J. Th. M. De Hosson
 a and
P. Rudolf
 a
a
aZernike Institute for Advanced Materials, University of Groningen, Nijenborgh 4, NL-9747AG Groningen, The Netherlands. E-mail: sadafakbarsadaf@gmail.com
bDepartment of Physics, Quaid-i-Azam University, Islamabad, Pakistan
cNational Centre for Physics, QAU Campus, Shahdra Valley Road, P.O. Box No. 2141, Islamabad, 44000, Pakistan
First published on 13th July 2020
Abstract
To explore the role of Li in establishing room-temperature ferromagnetism in SnO2, the structural, electronic and magnetic properties of Li-doped SnO2 compounds were studied for different size regimes, from nanoparticles to bulk crystals. Li-doped nanoparticles show ferromagnetic ordering plus a paramagnetic contribution for particle sizes in the range of 16–51 nm, while pure SnO2 and Li-doped compounds below and above this particular size range are diamagnetic. The magnetic moment is larger for compositions where the Li substitutes for Sn than for compositions where Li prevalently occupies interstitial sites. The observed ferromagnetic ordering in Li-doped SnO2 nanoparticles is mainly due to the holes created when Li substitutes at a Sn site. Conversely, Li acts as an electron donor and electrons from Li may combine with holes to decrease ferromagnetism when lithium mainly occupies interstitial sites in the SnO2 lattice.
Introduction
The role of non-magnetic dopants in inducing ferromagnetic properties in oxide semiconductors such as stannic oxide is still not completely understood, despite many efforts in the past two decades.1–8 A theoretical study by Peng et al.1 demonstrated that lower valence cation doping of SnO2 introduces holes or weaker anion electronegativity, which in turn play a vital role in mediating ferromagnetism in d0 semiconductors. From the experimental point of view, magnetism induced by non-magnetic doping has been observed in N-, Na-, Mg-, K-, Zn- and Ce-doped SnO2.2–7 Rahman et al.8 theoretically predicted that Li-doped SnO2 is a good candidate in the field of spintronics since Li behaves as a spin polarizer. These authors also found that Li can act as a vacancy stabilizer by reducing the defect formation energies of the native defects and that Li induces magnetism in SnO2 when substituted at the Sn site but not when occupying O and interstitial sites. In a perfect SnO2 crystal, the nominal valence of Sn is Sn4+ and when Li1+ is introduced at the Sn site, it donates one electron to compensate one hole among the four holes generated by the absence of Sn. The three uncompensated holes, localized at the O sites, give a magnetic moment of 3.00 μB per supercell.8 There have been a few experimental studies of this system; Srivastava et al. reported that in Sn1−xLixO2, for a small window of concentrations (0.03 ≤ x ≤ 0.09), Li induces paramagnetism at low temperatures (3 K).9 Although long-range ferromagnetic coupling was not observed, other experimental reports on Li-doped SnO2 thin films10 and nanoparticles11 have shown room-temperature ferromagnetism (RTFM). However, the part played by Li as a cation substitutional or interstitial defect in SnO2 remains unclear. In this paper, we study the structural, electronic and magnetic properties of Li-doped SnO2 compounds in different size regimes, from nanoparticles to bulk crystals, and we discuss the role of Li in establishing room-temperature ferromagnetism in SnO2.Experimental
Sn1−xLixO2 nanoparticles with varying Li concentrations (x = 0.0, 0.02, 0.04, and 0.1) were synthesized by a simple solvothermal method at room temperature. All chemicals were of analytical grade and were used without further purification. SnCl4·5H2O and Li(NO3)2 (0.1 mol) were dissolved separately in 100 mL of a water/ethanol mixture (1![[thin space (1/6-em)]](https://www.rsc.org/images/entities/char_2009.gif) :
:![[thin space (1/6-em)]](https://www.rsc.org/images/entities/char_2009.gif) 1, v/v) to obtain 1 M solutions and then mixed together to form a single solution. Then, a solution of ethanol and deionized water containing 2.8 g NaOH was slowly added drop wise into the above solution under constant stirring. The resulting mixture was maintained at a pH value of ∼11 and transferred into a 100 mL Teflon-lined stainless-steel autoclave, where it was kept at 180 °C for 22 h. The resulting precipitates were centrifugally separated and washed five times with ethanol and deionized water. Finally, the products were dried in air at 80 °C for 24 hours.
1, v/v) to obtain 1 M solutions and then mixed together to form a single solution. Then, a solution of ethanol and deionized water containing 2.8 g NaOH was slowly added drop wise into the above solution under constant stirring. The resulting mixture was maintained at a pH value of ∼11 and transferred into a 100 mL Teflon-lined stainless-steel autoclave, where it was kept at 180 °C for 22 h. The resulting precipitates were centrifugally separated and washed five times with ethanol and deionized water. Finally, the products were dried in air at 80 °C for 24 hours.
To favour the formation of smaller crystallites, we also processed two Sn1−xLixO2 samples with nominal composition x = 0.04 at autoclave temperatures of 160 °C and 170 °C, while the rest of the protocol was kept the same. A bulk powder sample was also prepared by annealing one of the dried Sn1−xLixO2 samples with nominal composition x = 0.04 in a furnace (model PLF 160/3, Protherm, Alser Teknik) at 600 °C for 8 h.
The structural analysis of the samples was performed using a PANalytical X'Pert PRO X-ray diffractometer (XRD) operating with CuKα radiation (λ = 1.5405 Å). A step size of 0.02° and a time-per-step of 1.5 s were used for each scan. The morphology and microstructure of the samples were investigated using a field emission scanning electron microscope (FESEM) setup (XL30-FEI ESEM-FEG, 5 kV–30 kV) equipped with an energy-dispersive X-ray (EDX) spectrometer, and a high-resolution transmission electron microscope (HRTEM) (JEOL2010FEG) operating at 200 kV. To analyse the chemical composition of the Li-doped SnO2 nanoparticles and to retrieve information on the chemical environment of the dopant, X-ray photoelectron spectroscopy (XPS) data were collected using a Surface Science SSX-100 ESCA instrument equipped with a monochromatic Al Kα X-ray source (hν = 1486.6 eV) and operating at a base pressure of <6 × 10⁻¹⁰ mbar. The energy resolution was set to 1.26 eV, and binding energies were referenced to the C 1s line at 284.6 eV (from adventitious carbon). When more than one component were used to fit a core level photoemission line, binding energies were reported to be ±0.1 eV. Spectral analysis included a Shirley background subtraction and peak deconvolution employing a convolution of Gaussian and Lorentzian functions in a 90/10% ratio using a least-square fitting program (Winspec) developed in the LISE laboratory of the Facultés Universitaires Notre-Dame de la Paix, Namur, Belgium. Magnetic characterization of the samples was carried out using a Quantum Design MPMS-XL7 SQUID magnetometer.
Results and discussion
Structural analysis
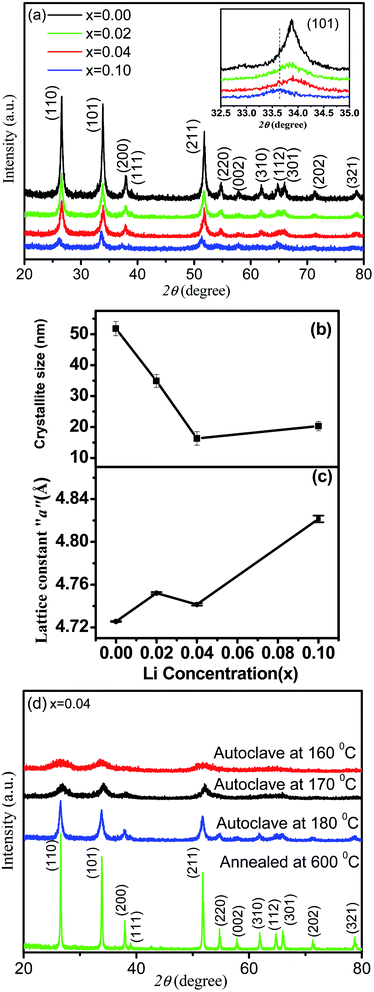
Fig. 1(a) depicts the X-ray diffraction (XRD) patterns for a series of Sn1−xLixO2 (x = 0.0, 0.02, 0.04 and 0.10) samples. All diffraction peaks can be indexed to the rutile structure of SnO2 with tetragonal lattice parameters a = 4.728 Å and c = 3.187 Å (JCPDS No. 45-1445). There was no indication of any secondary phases within the resolution of the diffractometer even up to the highest nominal doping, Sn0.90Li0.10O2. The broad peaks are characteristic of nanometre-sized crystallites. To further confirm the complete absence of lithium segregation, high-resolution scans near the expected positions of Li2O peaks were performed but no such phase was observed. The results in Fig. 1(a) demonstrated that the intensity of the diffraction peaks decreases and the full width at half maximum (FWHM) increases with the increase in Li concentration. The changes in intensity and FWHM showed that the incorporation of Li dopant resulted in the deterioration of crystallinity and a decrease in the crystallite size of the Sn1−xLixO2 samples. The average crystallite size can be obtained using the Scherrer formula12 D = Kλ/β![[thin space (1/6-em)]](https://www.rsc.org/images/entities/char_2009.gif) cos
cos![[thin space (1/6-em)]](https://www.rsc.org/images/entities/char_2009.gif) θ, where D is the average crystallite size, β the FWHM in radians, λ the X-ray wavelength (Cu-Kα = 0.154 nm), θ the Bragg diffraction angle, and K the shape factor, which was taken as 0.9. As shown in Fig. 1(b), the calculated grain size decreased from 51.0 ± 2.2 nm to 16.0 ± 2.2 nm with the increase in Li concentration. The inset in Fig. 1(a) shows that there is a non-monotonic shift of the SnO2 101 diffraction peak with the varying Li concentration. In general, a slight decrease in the lattice parameter was expected when Sn4+ ions were replaced by Li+ ions because of the difference in ionic radius, 0.68 Å for Li+ and 0.71 Å for Sn4+,13 while the incorporation of Li ions at interstitial sites (Lii) expands the lattice.11 Fig. 1(c) shows a general trend of expansion of the lattice with the increase in Li concentration as compared to pure SnO2. There is a dip at x = 0.04, which may indicate that along with interstitial Li, there are also substitutional Li defects, LiSn. This hypothesis will be further elaborated in the discussion of the X-ray photoelectron spectroscopy (XPS) results.
θ, where D is the average crystallite size, β the FWHM in radians, λ the X-ray wavelength (Cu-Kα = 0.154 nm), θ the Bragg diffraction angle, and K the shape factor, which was taken as 0.9. As shown in Fig. 1(b), the calculated grain size decreased from 51.0 ± 2.2 nm to 16.0 ± 2.2 nm with the increase in Li concentration. The inset in Fig. 1(a) shows that there is a non-monotonic shift of the SnO2 101 diffraction peak with the varying Li concentration. In general, a slight decrease in the lattice parameter was expected when Sn4+ ions were replaced by Li+ ions because of the difference in ionic radius, 0.68 Å for Li+ and 0.71 Å for Sn4+,13 while the incorporation of Li ions at interstitial sites (Lii) expands the lattice.11 Fig. 1(c) shows a general trend of expansion of the lattice with the increase in Li concentration as compared to pure SnO2. There is a dip at x = 0.04, which may indicate that along with interstitial Li, there are also substitutional Li defects, LiSn. This hypothesis will be further elaborated in the discussion of the X-ray photoelectron spectroscopy (XPS) results.
For a fixed concentration of Li, different size particles were prepared to study the effect of size on magnetization. Fig. 1(d) shows the XRD patterns of these Sn1−xLixO2 samples, all with x = 0.04. These XRD patterns were fitted by the Rietveld refinement technique using the TOPAS-5 software,14 as shown in Fig. 2(a–d). Changes in the diffraction pattern were noticeable when the autoclave temperature (180 °C, 170 °C and 160 °C) was decreased or when the sample was additionally annealed at 600 °C, but the Rietveld refinement gave no evidence for impurity phases. The changes in crystallite size, lattice parameters and cell volume (as extracted via Rietveld refinement) for samples synthesized at different autoclave temperatures are summarized in Table 1.
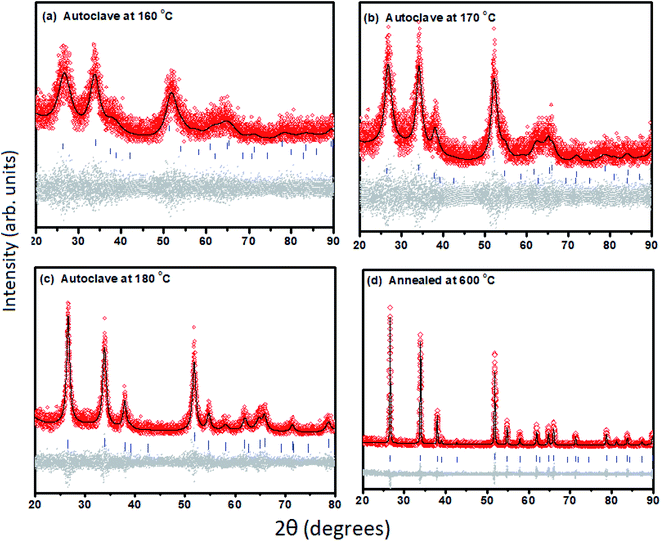 | ||
| Fig. 2 (a–d) Rietveld refinement fitting results of the X-ray powder diffraction patterns of Sn0.96Li0.04O2 prepared under different synthesis conditions (presented in Fig. 1(d)) showing the observed pattern (diamonds in red colour), the best fit Rietveld profile (black solid line), reflection positions (vertical bars), and difference plot (lower grey dots). | ||
| Sn0.96Li0.04O2 | Cassiterite phase (P42/mnm) | Vol. (Å3) | Crystallite size (nm) | |
|---|---|---|---|---|
| a (Å) | c (Å) | |||
| Autoclave at 160 °C | 4.741(26) | 3.198(29) | 71.89(10) | 2.9(71) |
| Autoclave at 170 °C | 4.714(16) | 3.161(17) | 70.244(61) | 4.8(95) |
| Autoclave at 180 °C | 4.738(53) | 3.184(61) | 71.463(21) | 11.7(16) |
| Additional annealing at 600 °C | 4.735(12) | 3.185(14) | 71.411(47) | 133.0(91) |
We conclude that autoclave treatment at lower temperatures yields smaller average particle sizes of 3–12 nm, while additional annealing at 600 °C instead produces a bulk sample with an average crystallite size of ∼130 nm.
Microstructural and morphology analysis
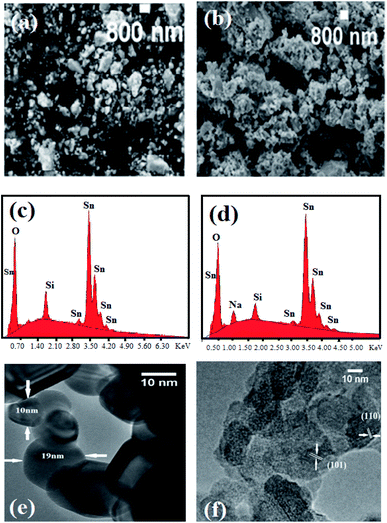
Fig. 3(a) and (b) present scanning electron microscopic (SEM) images of the Sn1−xLixO2 samples with x = 0.02 and x = 0.10, which both consist of agglomerated nanoparticles. The incorporation of Li does not modify the morphology creating differently shaped nanocrystals as was seen in the case of Zn-doped SnO2.15 We also verified the absence of magnetic contaminants in the nanoparticles by energy-dispersive X-ray (EDX) spectroscopy, as shown in Fig. 3(c) and (d). Only signals of Sn, Si, Na, and O were found, which confirmed that within the instrumental limit, no magnetic impurities were present. Si and Na (only at higher concentrations, x = 0.10) are residues from the chemical precursors; since EDX has only limited sensitivity for elements lighter than Na, Li could not be detected. A transmission electron microscopy (TEM) micrograph acquired for Sn0.96Li0.04O2 and shown in Fig. 3(e) evidenced the presence of different nanoparticle sizes – two examples measuring 10 nm and 19 nm are marked with arrows – in agreement; with the data in Table 1. Fig. 3(f) shows a high-resolution transmission electron microscopic (HRTEM) image for Sn0.96Li0.04O2; the two groups of crystallographic planes marked in the images have interplanar distances of ∼0.34 nm and ∼0.26 nm respectively. These values match well with the (110) and (101) planes of rutile SnO2.X-ray photoelectron spectroscopy (XPS) analysis
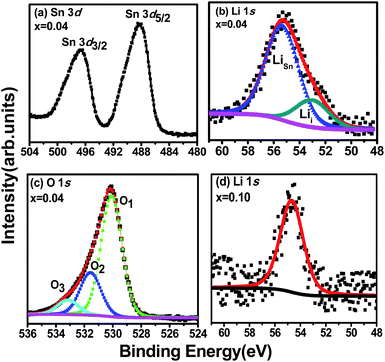
XPS spectra of the Sn 3d, O 1s and Li 1s core-level regions of the Sn0.96Li0.04O2 nanoparticles are shown in Fig. 4(a–c). Fig. 4(d) presents the Li 1s XPS spectrum for nanoparticles with a higher Li content, Sn0.90Li0.10O2. The two components of the Sn 3d doublet are located at binding energies of 488.1 eV (Sn 3d5/2) and 496.6 eV (Sn 3d3/2), in agreement with the literature values for Sn4+ bound to oxygen in the SnO2 matrix.16 The most informative part of the XPS spectra concerns the Li atoms. For Sn1−xLixO2 nanoparticles with composition x = 0.04, the Li 1s peak was asymmetric, indicating the presence of more than one component. When deconvoluting with two Lorentzian–Gaussian curves, the best fit was obtained with components situated at 53.0 eV and 55.4 eV, as shown in Fig. 4(b). The lower binding energy component could be assigned to interstitial lithium,10 Lii, while the higher binding energy component could be related to substitutional lithium, LiSn, involved in LiSn–O bonds.17 The relative intensity of the two components indicates that Li predominantly substitutes at Sn sites, and agrees with the lattice parameter decrease for this composition (x = 0.04) determined by XRD, which suggests that Li+ (with smaller ionic radius) substitutes for larger Sn4+.However, at a higher concentration (x = 0.10), Li prevalently occupies interstitial sites, as deduced from the symmetric single Li 1s peak with a binding energy of 54.5 eV, as shown in Fig. 4(d). This peak has clearly shifted to a higher binding energy as compared to the corresponding component for the x = 0.04 composition (peaked at 53.0 eV). We suggest that this shift to higher binding energies is consistent with an increasing number of Li ions entering the interstitial positions for this higher Li concentration. This again agrees with the XRD results discussed above, where for higher doping (x = 0.10), an expansion of the lattice was found and interpreted as due to additional Li atoms going into interstitial sites (Lii), due to the limited solubility.11
The role of Li defects, both substitutional and interstitial in forming a stable defect complex that includes a Sn vacancy, VSn, has been discussed by Yi et al.18 who found such defects to be magnetic; our observation that both interstitial and substitutional defects are present could thus be an indicator of such a complex defects in the Sn0.96Li0.04O2 nanoparticles. The O 1s core level spectrum in Fig. 4(c) is asymmetric and can be fitted with three components; O1 at a binding energy of 530.3 eV, attributed to oxygen bound to Sn;3,19 O2 peaked at 531.6 eV, associated with the presence of Sn with the nearest neighbour oxygen vacancy (VO); and O3 at 533.0 eV due to the presence of chemisorbed surface hydroxyl, –CO2, and/or adsorbed H2O.19
Magnetic analysis
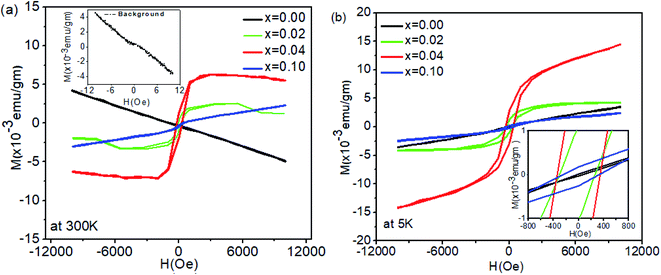
Various defects (LiSn, Lii, and VSn) formed by Li at different concentrations can play a significant role in determining whether defect-mediated ferromagnetism arises in Li-doped SnO2; in the following paragraph, we shall emphasize the mechanisms involved.All samples were handled with particular care to avoid any possibility of magnetic contamination. Ferromagnetic (FM) hysteresis loops were measured at room temperature (300 K) and low temperature (5 K) for all samples. Pure SnO2 was synthesized and treated under the same conditions as the doped SnO2 samples. The diamagnetic response of the sample holder alone is shown in the inset of Fig. 5(a). The background of the sample holder was subtracted from the raw data of all compositions measured at 300 K and 5 K, and the resultant magnetization is shown in Fig. 5(a) and (b). While undoped SnO2 is diamagnetic at room temperature, clear hysteresis loops for Sn1−xLixO2 with x = 0.02 and 0.04 confirm the ferromagnetic behaviour of these compositions. For the sample with x = 0.04, the ferromagnetic moment becomes saturated at fields above ∼2000 Oe; the slightly negative slope at a higher field is presumably from the subtraction of the diamagnetic background. The high field (saturation) magnetization for this composition has a value of 0.0054 ± 0.0003 emu g−1 and the magnetic moment amounts to 0.035 μB per Li atom, whereas for x = 0.02 the magnetization at high fields is 0.0012 ± 0.0002 emu gm−1 (0.0016 μB per Li atom). At the highest Li concentration (x = 0.10), a paramagnetic component can be seen alongside a small ferromagnetic one. The marked difference between the x = 0.04 composition and the other compositions is a significant feature of this data.
The data measured at 5 K and presented in Fig. 5(b) show a paramagnetic response for undoped SnO2, while for all three Li-doped samples, clear hysteresis loops point to ferromagnetic ordering along with a linear part at higher fields indicative of the coexistence of a paramagnetic contribution.15 The saturation magnetization (0.0044 ± 0.0004 emu g−1 for x = 0.02) is enhanced compared to the magnetization at 300 K. For the highest Li concentration (x = 0.10), the M versus H curve indicates a mainly paramagnetic response, with a very small ferromagnetic moment. The inset in Fig. 5(b) shows an enlarged view in order to highlight the coercivity, estimated as 255 ± 3 Oe, 177 ± 3 Oe and 329 ± 3 Oe for x = 0.02, 0.04, and 0.10 respectively.
Comparing the variation in magnetic moment with the Li concentration, the largest moment was found for x = 0.04, where both XRD and XPS indicate the presence of substitutional Li. Conversely, where the sample contains mainly interstitial Li (x = 0.10), the FM moment is lowest.
To further explore the observed ferromagnetism, the temperature-dependent zero-field-cooled (ZFC) and field-cooled (FC) magnetization of Sn1−xLixO2 with x = 0.04 and x = 0.10 was measured; the results are shown in Fig. 6. In the case of the ZFC measurement, the sample was cooled under zero field down to 5 K, and the magnetization was measured on warming under an applied field of 300 Oe. For FC magnetization measurement, the field of 300 Oe was applied during both cooling and warming.
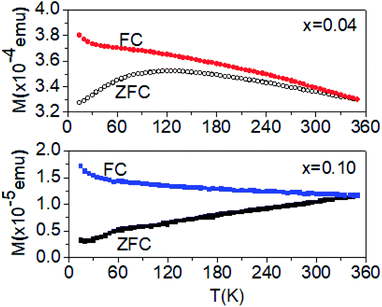 | ||
| Fig. 6 FC and ZFC magnetization versus temperature for Sn1−xLixO2 nanoparticles with x = 0.04 and x = 0.10, measured at 300 Oe. | ||
For both compositions, the FC magnetization increases monotonically with the decrease in temperature, but shows a slight upturn at the lowest temperatures. For the x = 0.04 sample, this upturn occurs below about 30 K. The ZFC magnetization for the same composition exhibits a broad maximum at about 120 K, suggesting the blocking of the moment below this temperature. However, the fact that the ZFC and FC magnetization curves remain separated up to room temperature points to the progressive blocking of moments. For x = 0.10, the FC magnetization increases very gradually when the temperature is lowered and then increases significantly below ∼60 K, with a more pronounced upturn below 15 K. The FC and ZFC magnetizations converge at ∼315 K, below which the ZFC magnetization decreases with the decrease in temperature. The ZFC magnetization also shows a clear change of slope at ∼60 K, where the FC magnetization shows an upturn.
These results suggest both the presence of a local anisotropy that blocks the moments and a spread in the sizes of the magnetically correlated entities. This latter conclusion is drawn from the observation of gradual freezing of the moments, presumably due to the larger magnetic entities being blocked at higher temperatures and the smaller entities being blocked at lower temperatures. Below 120 K (for x = 0.04), a large number of smaller clusters become blocked, which leads to the peak in the ZFC magnetization. This blocking temperature implies that the anisotropy energy is moderate. The corresponding activation energy, Ea ∼ kBT = 12 mV, is consistent with a picture of defect-induced moments on various sites that couple to form clusters, which are, in turn, blocked along a locally preferred direction. In contrast, the blocking even at 315 K for x = 0.10 indicates the presence of larger size magnetic entities, albeit with a smaller net moment. The presence of irreversibility may be attributed, as is usual, to the presence of a magnetically glassy phase. The system is inherently disordered since the Li ions that induce the magnetic behaviour are randomly distributed in the SnO2 host material. The interactions between these randomly distributed magnetic complexes can result in a phase with glassy-like magnetic properties.20
Fig. 7 shows the diamagnetic behaviour of Sn0.96Li0.04O2 nanoparticles with different particle sizes. It is clear that in addition to the Li dopant concentration, the particle size also has an important influence on the magnetic behaviour. This may be due to the prevalence of different defects (interstitial or substitutional) in particles of different sizes. Combining the results of XRD and XPS, we can draw the following conclusions on the origin of ferromagnetism in Li-doped SnO2 nanoparticles. As predicted by Rahman et al.8 the substitution of Sn atoms by Li introduces three holes in the O 2p state, which give a total magnetic moment of 3.00 μB. Li behaves as a spin polarizer and the polarized oxygen atoms surrounding the LiSn are the main contributors to the magnetism.8 In this picture, the MS value is large when Li is present on substitutional sites. The presence of LiSn is key for enhancing ferromagnetism in these nanoparticles. The spin ordering occurs via p–p interactions between holes trapped in oxygen 2p orbitals adjacent to the LiSn sites.
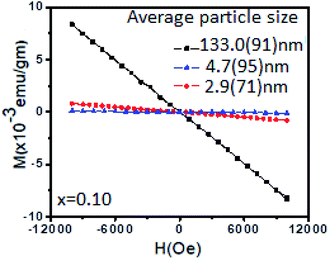 | ||
| Fig. 7 M–H curves for differently sized nanoparticles of Sn0.96Li0.04O2 at 300 K, showing diamagnetic behaviour. | ||
Conclusion
In summary, Sn1−xLixO2 nanoparticles with different Li concentrations (x = 0.00, 0.02, 0.04, and 0.10) have been synthesized and their structural, morphology, electronic and magnetic properties have been systematically investigated. The polycrystalline structure of the nanoparticles has been confirmed by XRD, and no diffraction from other phases such as Li2O has been detected. The incorporation of Li in the SnO2 lattice has been deduced from XRD and confirmed by XPS. Li-doped nanoparticles showed ferromagnetic ordering (plus a paramagnetic contribution) for particle sizes in the range of 16–51 nm. However, Li-doped samples with particle sizes outside this range, including undoped SnO2, are diamagnetic. This is unlike the study of Srivastava et al.9 who reported that magnetization increases sharply with the average nanoparticle radius. We determined the variation in the moment with the increase in Li content and correlated it with the presence of Li at substitutional or interstitial sites. XPS data demonstrated the presence of LiSn and Lii defects. The observed general trend of lattice expansion by XRD showed that Li in general occupies the interstitial positions, and substitutes for Sn at moderate concentrations. Comparing the variation in magnetic moment with the Li concentration, the moment for compositions where the Li substitutes for Sn is larger than that of compositions where Li prevalently occupies interstitial sites.The ferromagnetism of this system is verified to be intrinsic. We conclude that the observed ferromagnetic ordering in Li-doped SnO2 nanoparticles is mainly due to holes created by LiSn. Lii acts as an electron donor and may combine with the holes induced by LiSn to decrease the degree of ferromagnetic order. The saturation magnetization of the Sn1−xLixO2 nanoparticles is dependent on the Li concentration. Sn1−xLixO2 nanoparticles with x = 0.04 have the highest magnetic moment because at that concentration, Li occupies more substitutional sites than interstitial sites. The role of Li defects, both substitutional and interstitial, in forming a stable defect complex that includes a Sn vacancy has also been discussed in the literature.17 The significance of such a complex defect is that it is also magnetic. Thus, our observation of the presence of both interstitial and substitutional defects could also be an indicator of such a complex defect. However, beyond a certain concentration of Li dopants, when Lii is dominant, the degree of ferromagnetism decreases. To stabilize such defects also at higher dopant concentrations, where the magnetic moments and critical temperatures are larger, remains a major challenge for the development of materials with defect-mediated ferromagnetism.
Conflicts of interest
There are no conflicts of interest to declare.Acknowledgements
We gratefully acknowledge T. T. M. Palstra for the use of the SQUID facility of the Solid State Materials for Electronics (SSME) group and thank J. Baas for unconditional and constant support during the measurements. Many stimulating discussions with G. Rehman are gratefully acknowledged. This work was supported by the Advanced Materials research program of the Zernike National Research Centre under the Bonus Incentive Scheme of the Dutch Ministry for Education, Culture and Science.References
- H. Peng, H. J. Xiang, S.-H. Wei, S.-S. Li, J.-B. Xia and J. Li, Phys. Rev. Lett., 2009, 102(1), 017201 CrossRef PubMed.
- W. Zhou, X. Tang, P. Xing, W. Liu and P. Wu, Phys. Lett. A, 2012, 376(3), 203–206 CrossRef CAS.
- J. Wang, D. Zhou, Y. Li and P. Wu, Vacuum, 2017, 141, 62–67 CrossRef CAS.
- B. Zhou, P. Wu and W. Zhou, Appl. Phys. Lett., 2012, 101(18), 182406 CrossRef.
- R. Long and N. J. English, Phys. Lett. A, 2009, 374(2), 319–322 CrossRef CAS.
- F. P. Delgado, F. C. Vasquez, J. T. Holguín-Momaca, C. R. Santillán-Rodríguez, J. A. Matutes-Aquino and S. F. Olive-Méndez, J. Magn. Magn. Mater., 2019, 476, 183–187 CrossRef.
- A. Ahmed, M. N. Siddique, T. Ali and P. Tripathi, Appl. Surf. Sci., 2019, 483, 463–471 CrossRef CAS.
- G. Rahman, N. U. Din, V. M. García-Suárez and E. Kan, Phys. Rev. B, 2013, 87(20), 205205 CrossRef.
- S. K. Srivastava, A. Hadj-Azzem and G. Bouzerar, J. Supercond. Novel Magn., 2013, 27(2), 487–492 CrossRef.
- J. Wang, W. Zhou and P. Wu, Appl. Surf. Sci., 2014, 314, 188–192 CrossRef CAS.
- N. Wang, W. Zhou and P. Wu, J. Mater. Sci.: Mater. Electron., 2015, 26(6), 4132–4137 CrossRef CAS.
- A. L. Patterson, Phys. Rev., 1939, 56(10), 978–982 CrossRef CAS.
- H. Ren, X. Mu, Y. Huang, Z. Li, Y. Wang, P. Cai, Z. Peng and Y. Zhou, Ionics, 2010, 16(6), 497–502 CrossRef CAS.
- A. A. Coelho, Version 5, TOPAS Academic, 2015 Search PubMed.
- S. Akbar, S. K. Hasanain, O. Ivashenko, M. V. Dutka, N. Akhtar, J. Th. M. De Hosson, N. Z. Ali and P. Rudolf, RSC Adv., 2019, 9, 4082–4091 RSC.
- Y. C. Her, J. Y. Wu, Y. R. Lin and S. Y. Tsai, Appl. Phys. Lett., 2006, 89(4), 043115 CrossRef.
- J. G. Lu, Y. Z. Zhang, Z. Z. Ye, Y. J. Zeng, H. P. He, L. P. Zhu, J. Y. Huang, L. Wang, J. Yuan, B. H. Zhao and X. H. Li, Appl. Phys. Lett., 2006, 89(11), 112113 CrossRef.
- J. B. Yi, C. C. Lim, G. Z. Xing, H. M. Fan, L. H. Van, S. L. Huang, K. S. Yang, X. L. Huang, X. B. Qin, B. Y. Wang, T. Wu, L. Wang, H. T. Zhang, X. Y. Gao, T. Liu, A. T. S. Wee, Y. P. Feng and J. Ding, Phys. Rev. Lett., 2010, 104(13), 137201 CrossRef CAS PubMed.
- J. Moulder, W. Stickle, P. Sobol and K. Bomben, Handbook of X-Ray Photoemission Spectroscopy: A Reference Book of Standard Spectra for Identification and Interpretation of XPS Data, Perkin-Elmer Corp., Physical Electronics Division, Eden Prairie, Minnesota, USA, 1995 Search PubMed.
- S. K. Neogi, S. Chattopadhyay, R. Karmakar, A. Banerjee, S. Bandyopadhyay and A. Banerjee, J. Alloys Compd., 2013, 573, 76–82 CrossRef CAS.
Footnotes |
| † Electronic supplementary information (ESI) available. See DOI: 10.1039/d0ra03644g |
| ‡ Now at the COMSTECH Secretariat, 33-Constitution Avenue, G-5/2, Islamabad 44000, Pakistan. |
| § Now at Centre for Materials Science and Nanotechnology, University of Oslo, Sem Sælands vei 26, Kjemibygningen, 0371 Oslo, Norway. |
| ¶ Now at the BAM Federal Institute for Materials Research and Testing, Richard-Willstaetter-Strasse 11, Berlin, Germany. |
| This journal is © The Royal Society of Chemistry 2020 |

