 Open Access Article
Spiropyran-modified upconversion nanocomposite as a fluorescent sensor for diagnosis of histidinemia†
Jian Suab,
Yiwei Liab,
Wen Gu*ab and
Xin Liu *ab
*ab
aCollege of Chemistry, Nankai University, Tianjin 300071, China. E-mail: guwen68@nankai.edu.cn; liuxin64@nankai.edu.cn
bCollaborative Innovation Center of Chemical Science and Engineering, Key Laboratory of Advanced Energy Materials Chemistry (MOE), College of Chemistry, Nankai University, Tianjin 300071, China
First published on 16th July 2020
Abstract
Histidinemia is a congenital metabolic disorder where the histidine (His) metabolism is blocked, resulting in increased concentrations of His in blood and urine. The disease causes an abnormal development of the patient's nervous system, which leads to many serious illnesses. Therefore, it is very important to diagnose early. In this study, we developed a novel fluorescent nanosensor NaGdF4:Yb3+, Er3+@SiO2–spiropyran (UCNP@SiO2–SP). The nanosensor displayed a “turn-off” fluorescence response towards His. When His was mixed with UCNP@SiO2–SP, His could specifically bind to SP, which could cause the isomerization of SP. The structure of SP was changed from spiroform into merocyanine form. The luminescence of the sensor was overlapped with the absorption of the merocyanine form. As a result, His will lead to fluorescence quenching of the sensor based on inner filter effects (IFE), which can be used to detect His. Importantly, as the first report of a UCNP@SiO2–SP nanosensor for detecting His, this method exhibits good selectivity and anti-interference capability. The detection limit is 4.4 μM. In addition, the amount of His in urine was also measured, suggesting the applicability of this sensor for histidinemia diagnosis.
Introduction
Histidinemia is a congenital metabolic disease, which may lead to abnormal development of the nervous system of patients.1,2 Due to the lack of histidase in the patient's body, the metabolism of His is hindered and cannot be converted into urocanic acid, which causes the accumulation of His. As a result, the concentration of His in the blood rises, the concentration of His in the cerebrospinal fluid also rises and a large amount of His will be excreted in the urine. The concentration of His in patient's urine is several times that of normal people.3,4 The patient's clinical manifestations are intellectual disability, growth retardation, short stature, autism, and repeated respiratory infections.5,6 Therefore, the early diagnosis of histidinemia is particularly important and it is carried out by the determination of His concentration in urine samples.7To date, many analytical methods have been used to detect His. For example, high performance liquid chromatography,8,9 capillary electrophoresis,10,11 spectrophotometry,12,13 colorimetric analysis14,15 and electrochemistry.16 Because these methods have some shortcomings that cannot be ignored, including complex sample preparation, expensive equipment, cumbersome and long-term instrument operation, etc., which greatly limits their further application. Compared with these detection techniques, the recently popular fluorescence spectroscopy is more suitable for the detection of His.17–19 This is because it has the advantages of simple instrument operation, low cost, low time consumption, and no need for complicated sample preparation. Such as, Song et al.20 synthesized bovine serum albumin-stabilized gold nanoclusters for detection of His. Dai et al.21 used nickel-mediated allosteric manipulation of G-quadruplex DNAzyme for detection of His. Ding et al.22 developed a carbon quantum dots-Hg(II) system to detect His. However, the above-mentioned fluorescent sensors used high-cost precious metals and DNAzyme, unstable quantum dots, and toxic metal ions, so it is more necessary to develop a low-cost, eco-friendly and stable fluorescent sensor to detect His. So far, upconversion fluorescent sensor have been rare reported for determination of His. Therefore, it is desirable to develop a novel upconversion fluorescent sensor to detect His.
Upconversion nanoparticles are a special type of rare earth doped inorganic luminescent materials. It can convert near-infrared light into short-wave light through a multi-photon mechanism, emitting ultraviolet or visible light, that is, anti-Stökes luminescence.23 This type of material has many advantages as follows:24–27 1. Good chemical stability. The luminescence process is almost not affected by temperature, humidity, pH etc. 2. Good photochemical stability. It has high optical stability and is not easy to be photolysis under strong light or excitation light for a long time. 3. The upconversion luminescent material emits anti-Stökes light, and its excitation wavelength is generally near infrared or infrared light. In biological samples, most interfering substances will not be excited. The detection background is reduced, and the sensitivity is greatly improved. 4. Compared with some commonly used fluorescent dyes, upconversion nanoparticles are safe, environmentally friendly and inexpensive. 5. The emission wavelength is adjustable. The emission fluorescence of different color can be obtained by doping different rare earth ions. These advantages make it have great development in applications such as bioimaging,28,29 biosensing,30,31 photothermal/photodynamic therapy32,33 and multi-mode diagnosis.34
In this work, we have developed a upconversion fluorescent nanosensor for the diagnosis of histidinemia. The preparation procedure and detection principle were demonstrated in Scheme 1. First, UCNP were synthesized by thermal decomposition method. Then, we obtained UCNP@SiO2 by silica coating. Finally, the UCNP@SiO2 nanospheres were modified with SP, the nanosensor of UCNP@SiO2–SP was produced. In this nanocomposite, UCNP can produce a strong green light emission near 540 nm under 980 nm laser excitation. Once introducing His, His can specifically bind to SP on the sensor surface, which can cause the isomerization of SP.35 The SP–His complex has strong light absorption near 540 nm. Therefore, the introduction of His into the detection system will lead to fluorescence quenching, which can be used to determine the concentration of His in urine samples of patients with histidinemia.
 | ||
| Scheme 1 Schematic illustration of the preparation procedure of UCNPs@SiO2–SP nanosensor and detection process for His. | ||
Experimental section
Reagents and chemicals
Gadolinium nitrate hexahydrate (Gd(NO3)3·6H2O, 99.99%), ytterbium nitrate hexahydrate (Yb(NO3)3·6H2O, 99.9%), erbium nitrate hexahydrate (Er(NO3)3·6H2O, 99.99%) and ethanol (C2H5OH, AR) were purchased from Hengshan Chemistry Co., Ltd. Oleic acid (OA, 85%), sodium hydroxide (NaOH, 99.99%) and ammonium fluoride (NH4F, 99.99%) were obtained from Aladdin Chemistry Co., Ltd. Ammonium hydroxide (NH3·H2O, 28 wt%), N,N-dimethylformamide (DMF, AR) and cyclohexane (AR) were purchased from Fuchen Chemistry Co., Ltd. Tetraethyl orthosilicate (TEOS, 98%) was obtained from Alfa Aesar. 3′,3′-Dimethyl-6-nitro-spiro[2H-1-benzopyran-2,2′-indoline]-1′ ethanol (SP, 95%) was obtained by Heowns biochemical technology Co., Ltd. CO-520 was provided by Sigma-Aldrich. 3-Isocyanatopropyltriethoxysilane (IPTS, 95%) was purchased from Macklin Biochemical Co., Ltd. Other chemicals are all analytical grade and used without further purification. Ultrapure water (18.2 MΩ) was used in whole of the experimental process.Instrumentation
Transmission electron microscope (TEM) and high resolution transmission electron microscope (HRTEM) micrographs were obtained from FEI Tecnai G2 s-twin transmission electron microscopy with a working voltage of 200 kV. The X-ray photoelectron spectra (XPS) were performed on Thermo Fischer ESCALAB 250Xi. Powder X-ray diffraction (PXRD) measurements were made on the Rigaku Ultima IV diffractometer with Cu-Kα radiation (λ = 0.15405 nm) and a graphite monochromator by scanning over the range of 5–60° at a speed of 0.2° s−1. Fourier transform infrared spectra were measured on a Bruker TENOR 27 spectrophotometer. The UV-visible absorption spectrum was performed on a Cary 100 spectrophotometer (Agilent). All fluorescence measurements were made at room temperature on the EDINBURGH instrument FLS920 equipped with a 980 nm laser.Synthesis of UCNPs
The synthetic process of UCNP was based on a literature protocol with slight modifications.36 In a typical process, oleic acid (10 mL), 1-octadecene (15 mL) and a ReNO3 mixture (1.0 mmol, comprising 80 mol% Gd3+, 18 mol% Yb3+ and 2 mol% Er3+) were added into a 100 mL three-necked flask. The mixture was heated to 150 °C and kept for 40 min under an argon atmosphere to obtain a transparent solution. As the solution was cooled to room temperature, a 5 mL NaOH-methanol solution (0.5 M) and 8.25 mL NH4F–methanol solution (0.4 M) was added slowly into the reaction mixture and heated to 50 °C for 0.5 h. Then the solution was heated to 110 °C and kept at 110 °C for 0.5 h to remove the methanol. It was then stirred vigorously, and heated to 280 °C, and kept at this temperature for 1.5 hour under an argon atmosphere. And then the solution was allowed cool to room temperature. Next, the UCNPs-OA were precipitated by adding ethanol. Then the precipitate was collected and washed three times with ethanol. The product was eventually dispersed and preserved in 10 mL cyclohexane.Synthesis of UCNP@SiO2
2 mL of the above solution which contained UCNP was dispersed in 25 mL of cyclohexane. After adding 1.5 mL of CO-520, it was sonicated for 30 minutes. 200 μL of NH3·H2O was added and stirring was continued for 1 h. 80 μL of TEOS was added dropwise, stirred at room temperature for 48 hours, and finally centrifuged and washed three times with ethanol. The particles were dried overnight at room temperature.Synthesis of UCNP@SiO2–SP
100 mg SP was dispersed in 10 mL DMF, then added 3 mL IPTS. The mixture was heated to 80 °C under Ar atmosphere and maintained for 24 hours. Subsequently, 1 mL of DMF containing 40 mg UCNP@SiO2 was added to the above reaction system, and the reaction temperature was raised to 120 °C for 24 hours. Then the solution was cooled down to room temperature and the precipitate was obtained by centrifugal separation, which was washed twice with ethanol. The sample was dried in an oven at 80 °C to obtain the final product.Procedure for determination of His
In order to detect His, refer to this work,37 0.1 mL of UCNP@SiO2–SP (1 mg mL−1), 0.1 mL of Tris–HCl (pH = 7.4, 100 mM) and 0.01 mL of different concentrations of His were added to 0.79 mL of H2O and mixed well. The solution was placed in the dark at room temperature for 2 hours. Then the upconversion emitting of the solution was measured under 980 nm excitation.In the anti-interference experiment: group A, 0.1 mL of UCNP@SiO2–SP (1 mg mL−1), 0.1 mL of Tris–HCl (pH = 7.4, 100 mM) and 0.01 mL of different kinds of amino acid or urine components were added to 0.79 mL of H2O and mixed well. The concentrations of different amino acids were maintained at 5 mM, and the concentrations of different urine components were maintained at 10 mM. The solution was placed in the dark at room temperature for 2 hours. Then the upconversion emitting of the solution was measured under 980 nm excitation. Group B, 0.1 mL of UCNP@SiO2–SP (1 mg mL−1), 0.1 mL of Tris–HCl (pH = 7.4, 100 mM) and 0.01 mL of different kinds of amino acid or urine components were added to 0.78 mL of H2O and mixed well. The concentrations of different amino acids were maintained at 5 mM, and the concentrations of different urine components were maintained at 10 mM. Continue to add 0.01 mL of His until the concentration reaches 1 mM. The solution was placed in the dark at room temperature for 2 hours. Then the upconversion emitting of the solution was measured under 980 nm excitation.
Process for detection of His in real samples
According to this work,38 0.1 mL of UCNP@SiO2–SP (1 mg mL−1), 0.1 mL of artificial human urine (no background value of His, no pretreatment) and 0.01 mL of different concentrations of His were added to 0.79 mL of Tris–HCl (pH = 7.4, 10 mM) and mixed well. The solution was placed in the dark at room temperature for 2 hours. Then the upconversion emitting of the solution was measured under 980 nm excitation.Results and discussion
UCNP synthesized by thermal decomposition. Fig. 1a and d shows the TEM and HRTEM images of oleic acid stabilized UCNP prepared by thermal decomposition method. These nanoparticles exhibit good crystal structure with perfect uniformity and monodispersity. Their average diameter is 20 nm. Subsequently, by using CO-520 and TEOS, a SiO2 shell is formed on the periphery of UCNP to convert the hydrophobic UCNP into the water-dispersible UCNP@SiO2. TEM and HRTEM images (Fig. 1b and e) clearly show the core–shell structure of the UCNP@SiO2 nanocomposite, the thickness of the SiO2 shell is about 3.5 nm. The resulting UCNP@SiO2 nanoparticles were then modified with silane functionalized SP. Fig. 1c and f shows the TEM and HRTEM images of UCNP@SiO2–SP. The thickness of the shell is about 5 nm, which means that a layer of 1.5 nm thick SP was modified on the outside of the SiO2 shell.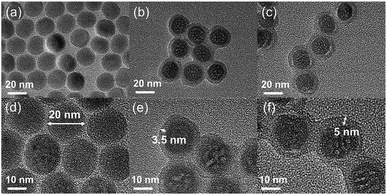 | ||
| Fig. 1 TEM images of UCNP (a), UCNP@SiO2 (b) and UCNP@SiO2–SP (c); HRTEM images of UCNP (d), UCNP@SiO2 (e) and UCNP@SiO2–SP (f). | ||
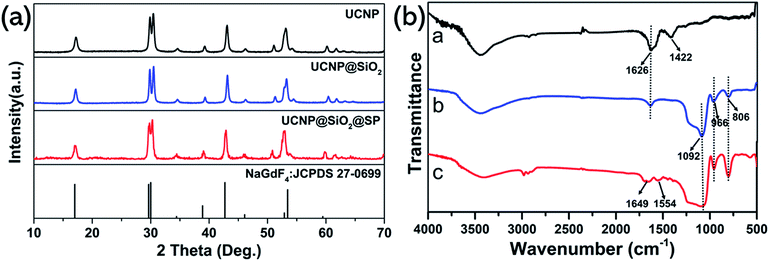
Fig. 2a presents the XRD patterns of the as-prepared samples. The XRD diffraction peaks of UCNP were matched with the standard patterns of NaGdF4 (JCPDS 27-0699). At the same time, no impurity peaks appeared. When SiO2 was coated on the outside of UCNP, the diffraction peak of UCNP@SiO2 did not change relative to UCNP, indicating that the modification of SiO2 have not destroyed the UCNP crystal form. Similarly, the diffraction peaks of UCNP@SiO2–SP was consistent with UCNP, the modification of SP did not change UCNP crystal form. FT-IR spectra were used to further prove that SP was successfully modified on the surface of nanoparticles. As shown in Fig. 2b, in the curve of UCNPs, the 1626 cm−1 and 1422 cm−1 bands could be assigned to the asymmetric and symmetric stretching vibration of the carboxylic group (–COOH) in OA. For UCNPs@SiO2, the absorption bands at 1092 cm−1 (Si–O–Si), 806 cm−1 (Si–O–Si) and 966 cm−1 (Si–OH) were present. In the spectrum of UCNPs@SiO2–SP, the absorption bands at 1649 cm−1 corresponding to the stretching vibration of amide bond (C–O). The absorption bands at 1554 cm−1 is due to the coupling of N–H and C–N in the amide bond.39–41
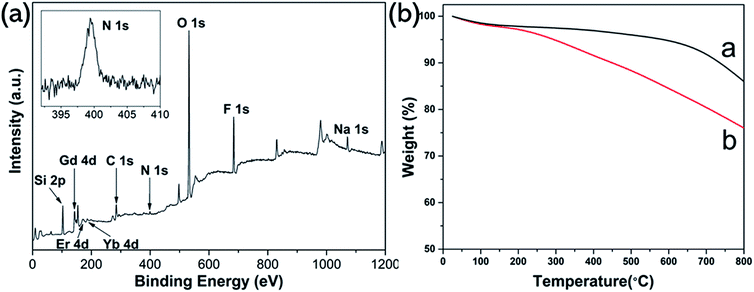
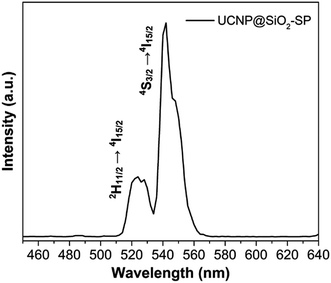
XPS analysis was carried out to further investigate the composition of UCNP@SiO2–SP. As shown in Fig. 3a, from the survey XPS spectra of UCNP@SiO2–SP, the presence of the N element from SP can be observed. The results mentioned above indicate the successful preparation of UCNP@SiO2–SP. In order to quantitatively determine the content of SP grafted onto the surface of UCNP@SiO2, TGA measurement was performed. As can be seen from Fig. 3b, in the range of 100–800 °C, the content of SP in the nanocomposite is about 10 wt%. from the TG curves. Fig. 4 shows the upconversion emission spectrum of UCNP@SiO2–SP was measured upon excitation at 980 nm. The emission peak centered at 520 and 540 nm, which could be assigned to the 2H11/2 → 4I15/2, 4S3/2 →4I15/2 transitions of Er3+ of NaGdF4:Er, Yb respectively.42
Stability is very important to the sensor, so soaking the sensor in the detection solution for three days, fluorescence and XRD tests (Fig. S1†) showed that the upconversion fluorescence and crystal morphology of the sensor remained unchanged. This indicates that the sensor has good stability.
Analytical performance of sensor for detection of His
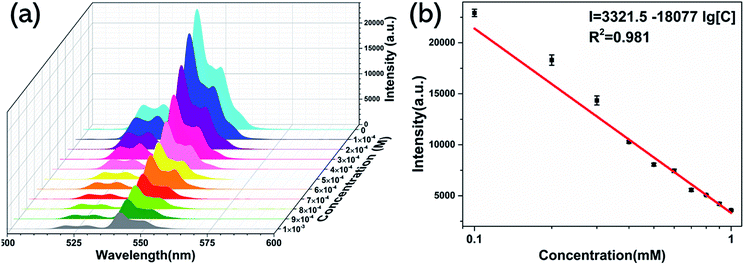
To investigate the ability of UCNP@SiO2–SP to detect His, the fluorescence experiment was performed. Fig. 5a shows the fluorescence response of UCNP@SiO2–SP with different amounts of His. With the increase of His concentration, the fluorescence emission intensity at 540 nm of the UCNP@SiO2–SP gradually decreased and good linear correlation was obtained (R2 = 0.981). The corresponding linear regression equation is I = 3321.5 − 18077![[thin space (1/6-em)]](https://www.rsc.org/images/entities/char_2009.gif) lg[C], where I represent the fluorescence intensity of UCNP@SiO2–SP and C is the concentration of His (Fig. 5b). The sensor gave a low detection limit of 4.4 μM for His based on 3σ/slope. Standard deviation (σ) were calculated from five blank measurements. This nanosensor showed significant advantages over other fluorescence sensors which were shown in Table 1.
lg[C], where I represent the fluorescence intensity of UCNP@SiO2–SP and C is the concentration of His (Fig. 5b). The sensor gave a low detection limit of 4.4 μM for His based on 3σ/slope. Standard deviation (σ) were calculated from five blank measurements. This nanosensor showed significant advantages over other fluorescence sensors which were shown in Table 1.
| Sensing system | Sample | LOD (μM) | Comments | Ref. |
|---|---|---|---|---|
| Metallo-supramolecular complex | THF | 4.6 | Cannot be used for biological sample testing | 43 |
| dsDNA–Cu2+ | Urine | 5.0 | Low selectivity | 44 |
| CdTe–Ni2+ | Serum | 0.5 | Poor anti-interference ability | 45 |
| Tb3+coordination polymer–Cu2+ | Plasma | 1.5 | Interfering substance: cysteine | 46 |
| Pyrene–imidazole conjugate | Aqueous solution | 3.1 | Cannot be used for biological sample testing | 47 |
| L-His-dependent DNAzyme | HEPES buffer | 50 | Cannot be used for biological sample testing | 48 |
| UCNP@SiO2–SP | Urine | 4.4 | Low cost, stable, high selectivity and anti-interference ability | This work |
Selectivity and anti-interference ability
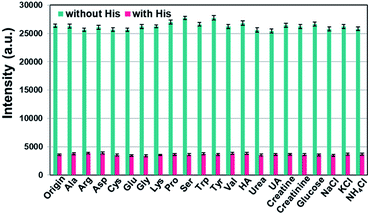
In order to investigate whether UCNP@SiO2–SP is used as a highly selective fluorescent sensor for His, anti-interference experiments were conducted. Ala, Arg, Asp, Cys, Glu, Gly, His, Lys, Pro, Ser, Trp, Tyr and Val were chosen. For practical use in urine, the common components of urine such as hippuric acid (HA), urea, uric acid (UA), creatine, creatinine, glucose and Na+, K+, NH4+, Cl− were also tested selectively.49 As shown in Fig. 6, no significant changes in Er3+'s emission of UCNP@SiO2–SP were observed when the system was treated with other amino acids and common components of urine except rifampicin. This shows that UCNP@SiO2–SP can be used as a luminescence sensor to identify and detect His. At the same time, Fig. 6 revealed that the decrease in the emission intensity at 540 nm caused by His is not affected in the background of other amino acids and common components of urine, demonstrating the high anti-interference capability and superior selectivity of UCNP@SiO2–SP.The detection mechanism
We explored the detection mechanism in detail subsequently. When His was mixed with UCNP@SiO2–SP, the fluorescence of UCNP was quenched by a combination of SP and His. Based on this previous report,35 His induced SP isomerization and formation of a complex SP–His. The absorption and the emission spectra of the detection system were shown in Fig. 7. With the addition of His, the UV-visible absorption band of SP at 529 nm was increased, leading to a spectral overlap between the upconversion fluorescence emission of the UCNP and the UV-visible absorption band of SP–His complex. This resulted in a fluorescence quenching of probe at 540 nm through IFE, IFE means that the absorption spectrum of the absorber (SP–His complex) overlaps with the excitation or emission spectrum of the fluorescent donor (UCNP).50 To further confirm the fluorescence quenching mechanism,51 as shown in UV-vis absorption spectroscopy of UCNP@SiO2 and UCNP@SiO2–SP (Fig. S2†), the absorption bands intensity around 540 nm had almost no significant change after SP modification, which verified that original SP cannot quenched the fluorescence of UCNP. Furthermore, the upconversion fluorescence spectra of UCNP@SiO2 was unchanged after adding the His, which shown that only His cannot quenched the fluorescence of UCNP (Fig. S3†). Therefore, it was confirmed that the observed fluorescence quenching resulted from IFE between SP–His complex and UCNP.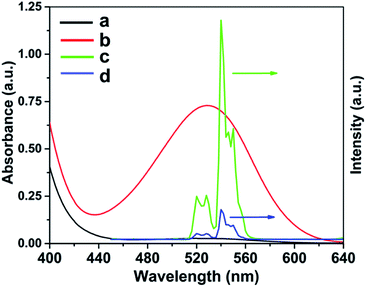 | ||
| Fig. 7 UV-vis absorption spectrum of SP (curve a) and SP–His (curve b). Emission spectrum of UCNP@SiO2–SP (curve c) and UCNP@SiO2–SP with His under a 980 nm laser. | ||
According to this paper,35 SP–His complex can be unbinded under strong white light irradiation. Therefore, we put the His-probe system under strong LED white light irradiation, and it can be seen from the fluorescence spectrum results that the fluorescence intensity of the sensor is restored (Fig. S4†).
His assay in real samples
The feasibility of the proposed method for practical applications was investigated in the human urine samples. For the determination of His in urine samples, we performed it by adding a standard test substance to the urine samples. As shown in Table 2, for 3 groups of samples, all the His quantities measured by the sensor were close to the additive scalars, and a series of samples obtained the recoveries ranging from 90% to 108%, and the relative standard deviations were lower than 3.3%. These results suggested that the proposed method can accurately and reliably quantify the His in the urine samples.| Sample | Background (mM) | Spiked (mM) | Measure (mM) | Recovery (%) | RSD (%) |
|---|---|---|---|---|---|
| 1 | ND | 0.1 | 0.090 | 90 | 3.3 |
| 2 | ND | 0.50 | 0.54 | 108 | 1.0 |
| 3 | ND | 1.0 | 0.97 | 97 | 1.0 |
Conclusions
In summary, an effective nanosensor for diagnosis of histidinemia based on a UCNP@SiO2–SP nanocomposite was successfully developed. When His was added to the detection system, the luminescence intensity of the nanosensor was decreased. The quenching luminescence of the nanosensor can be used to determine His in urine samples of human with histidinemia. The limit of detection of the nanosensor is 4.4 μM. As the first report of UCNP@SiO2–SP sensor for amino acid, this method also has high selectivity and anti-interference ability for His detection. Meanwhile, the UCNP@SiO2–SP nanosensor shows lower-cost and eco-friendly, suggesting this material can be developed to an efficient luminescence sensor for His detection in the diagnosis of disease.Conflicts of interest
There are no conflicts to declare.Acknowledgements
This work was supported by the National Natural Science Foundation of China (21875117, 21371103).References
- M. S. Attia, Biosens. Bioelectron., 2017, 94, 81–86 CrossRef CAS PubMed.
- C. Selden, D. Calnan, N. Morgan, H. Wilcox, E. Carr and H. J. F. Hodgson, Hepatology, 1995, 21, 1405–1412 CAS.
- Y. Kawai, A. Moriyama, K. Asai, C. M. Coleman-Campbell, S. Sumi, H. Morishita and M. Suchi, Hum. Genet., 2005, 116, 340–346 CrossRef CAS PubMed.
- R. G. Taylor, H. L. Levy and R. R. McInnes, Mol. Biol. Med., 1991, 8, 101–116 CAS.
- C. R. Scriver and H. L. Levy, J. Inherited Metab. Dis., 1983, 6, 51–53 CrossRef CAS PubMed.
- M. Ishikawa, Acta Paediatr. Jpn., 1987, 29, 224–228 CrossRef CAS PubMed.
- V. H. Auerbach, A. M. DiGeorge, R. C. Baldridge, C. D. Tourtellotte and M. P. Brigham, J. Pediatr., 1962, 60, 487–497 CrossRef CAS PubMed.
- N. Tateda, K. Matsuhisa, K. Hasebe, N. Kitajima and T. Miura, J. Chromatogr. B: Biomed. Sci. Appl., 1998, 718, 235–241 CrossRef CAS.
- S. Wadud, M. M. Or-Rashid and R. Onodera, J. Chromatogr. B: Anal. Technol. Biomed. Life Sci., 2002, 767, 369–374 CrossRef CAS.
- L. Y. Zhang and M. X. Sun, J. Chromatogr. A, 2004, 1040, 133–140 CrossRef CAS PubMed.
- H. Yu, L. Xu and T. Y. You, Luminescence, 2013, 28, 217–221 CrossRef CAS PubMed.
- Y. Zhou and J. Y. Yoon, Chem. Soc. Rev., 2012, 41, 52–67 RSC.
- P. G. Besant and P. V. Attwood, Mol. Cell. Biochem., 2009, 329, 93–106 CrossRef CAS PubMed.
- Z. Y. Yao, H. Bai, C. Li and G. Q. Shi, Chem. Commun., 2011, 47, 7431–7433 RSC.
- Y. Zhou and J. Y. Yoon, Chem. Soc. Rev., 2012, 41, 52–67 RSC.
- M. Shahlaei, M. B. Gholivand and A. Pourhossein, Electroanal, 2009, 21, 2499–2502 CAS.
- J. N. Xiao, L. J. Song, M. Y. Liu, X. L. Wang and Z. L. Liu, Inorg. Chem., 2020, 59, 6390–6397 CrossRef CAS PubMed.
- G. Wei, Y. L. Jiang and F. Wang, Tetrahedron Lett., 2020, 61, 151722–151726 CrossRef CAS.
- J. Wang, H. H. Jiang, H. B. Liu, L. B. Liang and J. R. Tao, Spectrochim. Acta, Part A, 2020, 228, 117725–117730 CrossRef CAS PubMed.
- Y. He, X. Wang, J. J. Zhu, S. H. Zhong and G. W. Song, Analyst, 2012, 137, 4005–4009 RSC.
- Z. J. Li, J. Zhao, Z. Y. Wang and Z. H. Dai, Anal. Chim. Acta, 2018, 1008, 90–95 CrossRef CAS PubMed.
- J. Hou, F. S. Zhang, X. Yan, L. Wang, J. Yan, H. Ding and L. Ding, Anal. Chim. Acta, 2015, 859, 72–78 CAS.
- J. Zhou, Q. Liu, W. Feng, Y. Sun and F. Y. Li, Chem. Rev., 2015, 115, 395–465 CrossRef CAS PubMed.
- W. Feng, C. M. Han and F. Y. Li, Adv. Mater., 2013, 37, 5287–5303 CrossRef PubMed.
- Y. S. Liu, D. T. Tu, H. M. Zhu and X. Y. Chen, Chem. Soc. Rev., 2013, 42, 6924–6958 RSC.
- Z. J. Gu, L. Yan, G. Tian, S. J. Li, Z. F. Chai and Y. L. Zhao, Adv. Mater., 2013, 25, 3758–3779 CrossRef CAS PubMed.
- Y. Y. Chen, B. Liu, X. R. Deng, S. S. Huang, Z. Y. Hou, C. X. Li and J. Lin, Nanoscale, 2015, 7, 8574–8583 RSC.
- R. J. Zhang, J. D. Zheng and T. Zhang, RSC Adv., 2020, 10, 15990–15996 RSC.
- Y. You, S. S. Cheng, L. Zhang, Y. X. Zhu, C. L. Zhang and Y. Z. Xian, Anal. Chem., 2020, 92, 5091–5099 CrossRef CAS PubMed.
- H. Q. Liu, J. N. Rong, G. Q. Shen, Y. Song, W. Gu and X. Liu, Dalton Trans., 2019, 48, 4168–4175 RSC.
- M. Y. Liang, B. Zhao, Y. Xiong, W. X. Chen, J. Z. Huo, F. Zhang, L. Wang and Y. Li, Dalton Trans., 2019, 48, 16199–16210 RSC.
- F. Lu, L. Yang, Y. J. Ding and J. J. Zhu, Adv. Funct. Mater., 2016, 26, 4778–4785 CrossRef CAS.
- Y. Y. Li, X. B. Zhang, Y. Zhang, Y. L. He, Y. Liu and H. X. Ju, ACS Appl. Mater. Interfaces, 2020, 12, 19313–19323 CrossRef CAS PubMed.
- D. Wang, B. Xue, X. G. Kong, L. P. Tu, X. M. Liu, Y. L. Zhang, Y. L. Chang, Y. S. Luo, H. Y. Zhao and H. Zhang, Nanoscale, 2015, 7, 190–197 RSC.
- Y. Y. Liu, M. G. Fan, S. X. Zhang, X. H. Sheng and J. N. Yao, New J. Chem., 2007, 31, 1878–1881 RSC.
- F. Wang, R. R. Deng and X. G. Liu, Nat. Protoc., 2014, 9, 1634–1644 CrossRef CAS PubMed.
- P. Gu, G. H. Zhang, Z. Y. Deng, Z. W. Tang, H. F. Zhang, F. Y. Khusbu, K. F. Wu, M. J. Chen and C. B. Ma, Spectrochim. Acta, Part A, 2018, 203, 195–200 CrossRef CAS PubMed.
- Z. Y. Wang and Z. F. Fan, Spectrochim. Acta, Part A, 2018, 189, 195–201 CrossRef CAS PubMed.
- X. Q. Ge, L. Dong, L. N. Sun, Z. M. Song, R. Y. Wei, L. Y. Shi and H. G. Chen, Nanoscale, 2015, 7, 7206–7215 RSC.
- B. S. Tian, S. H. Liu, W. Lu, L. Jin, Q. F. Li, Y. R. Shi, C. Y. Li, Z. L. Wang and Y. P. Du, Sci. Rep., 2016, 6, 21335–21345 CrossRef CAS PubMed.
- B. X. Liu, H. L. Tan and Y. Chen, Anal. Chim. Acta, 2013, 761, 178–185 CrossRef CAS PubMed.
- Y. Song, G. X. Liu, X. T. Dong, J. X. Wang, W. S. Yu and J. M. Li, J. Phys. Chem. C, 2015, 119, 18527–18536 CrossRef CAS.
- P. Munjal and H. M. Chawla, J. Lumin., 2018, 203, 364–370 CrossRef CAS.
- Y. R. Liu, R. Hu, T. Liu, X. B. Zhang, W. H. Tan, G. L. Shen and R. Q. Yu, Talanta, 2013, 107, 402–407 CrossRef CAS PubMed.
- F. P. Shi, S. Y. Liu and X. G. Su, Talanta, 2014, 125, 221–226 CrossRef CAS PubMed.
- S. F. Xue, L. F. Lu, Q. X. Wang, S. Q. Zhang, M. Zhang and G. Y. Shi, Talanta, 2016, 158, 208–213 CrossRef CAS PubMed.
- J. Wang, H. H. Jiang, H. B. Liu, L. B. Liang and J. R. Tao, Spectrochim. Acta, Part A, 2020, 228, 117725–117730 CrossRef CAS PubMed.
- J. Elbaz, B. Shlyahovsky and I. Willner, Chem. Commun., 2008, 13, 1569–1571 RSC.
- J. Su, X. F. Xiang, R. Lv, H. Li, X. Fu, B. Y. Yang, W. Gu and X. Liu, J. Solid State Chem., 2018, 266, 9–15 CrossRef CAS.
- J. N. Hao and B. Yan, Adv. Funct. Mater., 2017, 27, 1603856–1603863 CrossRef.
- Y. Liu, Q. Ouyang, H. H. Li, Z. Z. Zhang and Q. S. Chen, ACS Appl. Mater. Interfaces, 2017, 9, 18314–18321 CrossRef CAS PubMed.
Footnote |
| † Electronic supplementary information (ESI) available. See DOI: 10.1039/d0ra03711g |
| This journal is © The Royal Society of Chemistry 2020 |

