 Open Access Article
Ex situ catalytic fast pyrolysis of soy sauce residue with HZSM-5 for co-production of aromatic hydrocarbons and supercapacitor materials†
Kai Li ,
Dana Bolatibieke,
Shi-guan Yang,
Bo Wang,
Dong-hong Nan and
Qiang Lu
 *
*
National Engineering Laboratory for Biomass Power Generation Equipment, North China Electric Power University, Beijing 102206, China. E-mail: qianglu@mail.ustc.edu.cn; qlu@ncepu.edu.cn; Tel: +86-10-61772030
First published on 18th June 2020
Abstract
A promising approach is proposed for the efficient conversion of soy sauce residue (SSR) into aromatic hydrocarbons and a supercapacitor electrode material by ex situ catalytic fast pyrolysis (CFP) technology with HZSM-5. The thermal decomposition behaviors of SSR were first investigated via thermogravimetry (TG) and pyrolysis-gas chromatography/mass spectrometry (Py-GC/MS) analyses. The ex situ CFP of SSR was conducted to elucidate the aromatic hydrocarbons production under different pyrolysis temperatures and HZSM-5-to-SSR (HZ-to-SSR) ratios using both Py-GC/MS and lab-scale instruments. The results indicated that the aromatic hydrocarbons reached the maximal yields of 22.20 wt% from Py-GC/MS with an HZ-to-SSR ratio of 11 at 650 °C, and 17.61 wt% from the lab-scale device with an HZ-to-SSR ratio of 2, respectively. The as-obtained yield of aromatic hydrocarbons was far higher than those obtained from typical lignocellulosic biomass materials, confirming that SSR is a promising material for aromatics production. The pyrolytic solid product collected with this method was further activated by KOH to synthesize N-doped activated carbon (NAC) for supercapacitors. The physicochemical analysis showed that NAC possessed N-incorporated hierarchical pores, and exhibited a promising capacitance of 274.5 F g−1 at 1 A g−1.
1. Introduction
Soy sauce is a popular seasoning worldwide and is mainly made from soybeans, grains, water and salt. Soy sauce residue (SSR) is an important byproduct of soy sauce fermentation, which has a dark brown color, unpleasant awful smell and complicated constituents, including proteins, lipids, crude fiber, salt, and so on.1 SSR is chiefly employed as livestock feed, especially for pigs. Nevertheless, this application is currently becoming less ideal because of the abundant salts (14–18%) and terrible palatability of SSR, which is not conducive to the growth of pigs, and even leads to the death of pigs.2 Recently, some new utilization methods of SSR were proposed, such as the separation of proteins,3 isoflavone,4 and so on. However, none of these methods have been commercially utilized so far, primarily because of the complicated process, high cost and low yield of targeted products. Therefore, it is imperative to develop new efficient methods to achieve the clean and high-valued utilization of SSR.Fast pyrolysis technology provides an efficient and economical way to achieve the quick conversion of organic solid materials into various pyrolytic products.5,6 The pyrolytic liquid product can be used as liquid fuels or raw chemical materials.7 The solid product can be upgraded into soil amendments,8 activated carbon,9 and supercapacitor electrode materials.10,11 To further ameliorate the quality of pyrolytic products, catalytic fast pyrolysis (CFP) enables the selective production of targeted compounds,11–13 which might be a promising way for the utilization of SSR. However, few relevant studies have been performed for the CFP of SSR at present.
In light of the complicated constituents of SSR, catalyst selection is vital for its CFP conversion.14 HZSM-5 is usually regarded as an ideal option for the CFP of biomass,15 due to its thermal stability, high shape selectivity and excellent selectivity for aromatic hydrocarbons, as well as the strong adaptability of feedstock. Mihalcik et al.16 confirmed the effective capability of HZSM-5 on the aromatic production using the CFP of different lignocellulosic biomass, including switchgrass, corn cobs, oak and their primary components. Thangalazhy-Gopakumar et al.17 investigated the CFP of algae (C. vulgaris) with HZSM-5 and obtained aromatic hydrocarbons with the highest carbon yield of 25.8 wt%. Li et al.18 adopted HZSM-5 to the CFP of pine with calcium formate and the yield of monocyclic aromatic hydrocarbons (MAHs) reached 10.65 wt%. Therefore, based on the previous studies, it is reasonable to infer that HZSM-5 might also be effective for the CFP of SSR to obtain aromatic hydrocarbons as the major liquid product.
In addition to the liquid product, the utilization of the pyrolytic solid product is also important to the economy of the CFP technology. Recently, the preparation of supercapacitor materials from biomass has garnered increasing attention.19 However, the supercapacitors prepared from conventional lignocellulosic biomass only exhibited moderate capacitive performance because of the limited active sites.20 The incorporation of heteroatoms, especially N, into carbon material is an effective way to improve the capacitive performance.21 Generally, N incorporation could be achieved by additional ammonization or co-pyrolysis with N-abundant substances. Xu et al.22 employed bean dregs as N dopants for co-pyrolysis with rice husk to prepare N-doped activated carbons (NAC) for supercapacitors, the corresponding capacitance (Cg) was 319 F g−1 at 0.2 A g−1. However, the NAC obtained in this way is usually heterogeneous. To overcome this deficiency, many researchers have pursued the preparation of NAC directly from N-rich materials, such as egg shells,18 squid gladius chitin,23 camellia oleifera shells,24 etc. The NAC prepared from squid gladius chitin possessed an excellent Cg of 204 F g−1, while the Cgs of NACs obtained from egg shells and camellia oleifera shells were 191 F g−1 and 205 F g−1, respectively. Since SSR is abundant in nitrogen due to its high protein content,1 it might have the unique advantage to produce NAC for supercapacitors.
Therefore, in this study, the ex situ CFP of SSR over HZSM-5 was developed to concurrently produce aromatic hydrocarbons and a supercapacitor electrode material. Considering that the thermal decomposition behaviors of SSR are not well known at present, thermogravimetric (TG) and pyrolysis-gas chromatography/mass spectrometry (Py-GC/MS) analyses were first executed to investigate the thermal degradation of SSR and reveal the pyrolysis kinetics and product distribution.25 Afterwards, ex situ CFP tests of SSR with HZSM-5 were executed via both Py-GC/MS and a scale-up device. The effects of the pyrolytic reaction temperature as well as the HZSM-5-to-SSR (HZ-to-SSR) ratio on the product formation were studied comprehensively to maximize the yield of aromatic hydrocarbons. Moreover, the pyrolytic solid product was directly activated by KOH to synthesize NAC for supercapacitor materials.
2. Experimental
2.1 Materials
SSR was provided by a soy sauce factory in Sichuan Province, China. The received SSR was oven-dried, ground and sieved to obtain dry particles (<0.1 mm) as the feedstock. The ultimate analysis was executed using an elemental analyzer. The proximate analysis was executed based on the national standard, i.e., GB/T 28731–2012. The Van Soest method was adopted to determine the cellulose, hemicellulose and lignin contents. The protein, salt (NaCl), and fat contents were measured according to the relevant national standards in food fields, viz. GB/T 5009.5-2016, GB/T 12457-2008 and GB/T 5009.6-2016, respectively. All the above analyses were conducted on the dry basis. All results met the standard deviations specified in the corresponding standards.HZSM-5 (Si/Al = 27) was provided by Nankai University and calcined at 500 °C before use.
2.2 Thermogravimetric experiments and kinetics analysis
The thermal decomposition behaviors of SSR were determined via a thermogravimetric analyzer (STA6000). In each run, about 10 mg SSR was used. Measurements were executed under N2 flow from 50 °C to 700 °C at 5, 10, 20 and 40 °C min−1.The pyrolysis reaction kinetics of SSR can be expressed as follows:26
 | (1) |
 | (2) |
Considering the constant heating rate, β = dT/dt, eqn (1) can be written as follows:
 | (3) |
The Flynn–Wall–Ozawa (FWO) and Kissinger–Akahira–Sunose (KAS) methods were employed to calculate the kinetics. For the FWO method, under the same condition of α, the value of f(α) does not change with the different heating procedures, thus a more reliable E can be obtained without introducing the dynamic model function. The general expression of FWO is as follows:
 | (4) |
The same conversion value α is selected at different heating rates, and T−1 is linearly regressed by ln![[thin space (1/6-em)]](https://www.rsc.org/images/entities/char_2009.gif) β. The corresponding E can be obtained directly according to the slope of the fitting line.
β. The corresponding E can be obtained directly according to the slope of the fitting line.
The KAS method is a typical integral method, expressed by step-by-step integration with the general expression as follows:
 | (5) |
Under different heating rates, for a given conversion α, according to formula (5), ln(β/T2) and T−1 can be used in linear regression, and the corresponding E can be attained according to the slope.
2.3 Py-GC/MS tests
A micropyrolyzer (CDS 5200HP) was adopted to execute the ex situ CFP of SSR with HZSM-5 and the obtained organic volatiles were immediately delivered to GC/MS (Clarus 560) for on-line analysis. In each run, the usage of SSR was 0.20 mg, while the HZSM-5 amount was determined by the HZ-to-SSR ratios (mass ratios) of 5, 7, 9, 11 and 13, respectively. The SSR was loaded into the quartz tube with HZSM-5 on both sides. The as-prepared tubes were pyrolyzed for 20 s at designated temperatures (500–700 °C). All the important parameters in the tests were determined by exploratory experiments. The yields of aromatic hydrocarbons were quantified by the external standard calibration method. The details of the Py-GC/MS tests were demonstrated in our previous study.272.4 Lab-scale CFP experiments
A lab-scale device was adopted to execute the ex situ CFP experiments of SSR with HZSM-5, as illustrated in the ESI (Fig. S1†).7 The device was chiefly made up with a vertical heating furnace, a quartz tube reactor, a nitrogen gas cylinder, and a condenser cooled with liquid nitrogen. For the ex situ CFP tests, the reactor preplaced with HZSM-5 was heated to 650 °C first, then the SSR was fed in uniformly to be pyrolyzed. For each run, the usage of SSR was 1 g and the amount of HZSM-5 was varied with the HZ-to-SSR ratios of 0.5, 1, 1.5, 2, and 2.5, respectively. The pyrolysis conditions were also determined through exploratory experiments.The pyrolytic solid and liquid yields could be determined by weighing, while the gas yield was attained by the difference. The solid product could be collected from the reactor and stored for further usage. The water content of the liquid product was measured using a Karl-Fisher moisture analyzer, while the organic compounds were analyzed and quantified using a gas chromatograph.
2.5 Preparation and characterization of NAC
The solid product obtained from the lab-scale CFP test of SSR with an HZ-to-SSR ratio of 2 at 650 °C was collected and subjected to activation with KOH to prepare NAC. Wherein, the pyrolytic solid product was first impregnated with KOH and subsequently activated at 800 °C for 90 min. Afterwards, HCl solution and hot distilled water at about 80 °C were successively used to wash the cooled mixture. Finally, the NAC was attained after drying at 110 °C.The physicochemical properties of NAC were measured using an X-ray diffractometer (XRD, D8 advance), nitrogen physisorption (ASAP2460) and X-ray photoelectron spectrometer (XPS, Thermo Escalab 250Xi) to characterize the crystallographic structures, porous characteristics, and chemical states of the main elements in NAC.
The electrochemical tests of NAC were executed using a three-electrode system (CHI660E) with 6 M KOH solution as an electrolyte. Wherein, NAC was used to fabricate the working electrode by homogeneously mixing with polytetrafluoroethylene and acetylene black at a mass ratio of 8![[thin space (1/6-em)]](https://www.rsc.org/images/entities/char_2009.gif) :
:![[thin space (1/6-em)]](https://www.rsc.org/images/entities/char_2009.gif) 1
1![[thin space (1/6-em)]](https://www.rsc.org/images/entities/char_2009.gif) :
:![[thin space (1/6-em)]](https://www.rsc.org/images/entities/char_2009.gif) 1 and pressed on a nickel foam (1 cm × 1 cm). The platinum and saturated calomel were adopted as the counter and reference electrodes, respectively.
1 and pressed on a nickel foam (1 cm × 1 cm). The platinum and saturated calomel were adopted as the counter and reference electrodes, respectively.
The cyclic voltammetry (CV) tests of NAC were measured at 5–100 mV s−1. The galvanostatic charge/discharge (GCD) tests were executed between 1 and 20 A g−1. The electrochemical impedance spectroscopy (EIS) was executed at frequencies varied from 0.01 Hz to 100 kHz in 5 mV.
3. Results and discussion
3.1 Physiochemical characteristics of SSR
Table 1 illustrates the proximate, ultimate and component analyses of SSR. The contents of the volatile and fixed carbon of SSR were 76.46 wt% and 7.15 wt%, accompanied with a high ash content of 16.39 wt%. The high ash content was also consistent with the high salt content of 10.19 wt%, which could function as a template to control the pore structure of NAC during the activation process.28 The contents of C (47.13 wt%), H (6.29 wt%), O (25.46 wt%), N (4.22 wt%), and S (0.51 wt%) were identified, showing a lower O content and higher N content than typical lignocellulosic biomass, such as rice husk, wheat straw and pine.29,30 The main contributor to the high N content was the protein component, due to the high average N content in protein of approximately 17 wt%. Compared with conventional lignocellulosic biomass, the proportions of protein (24.42 wt%) and fat (10.30 wt%) in SSR were very high, but those of cellulose (15.98 wt%) and hemicellulose (9.13 wt%) were very low. The low O contents of the former two components were responsible for the low O content in SSR.| Proximate analysis | Ultimate analysis | Component analysis | |||
|---|---|---|---|---|---|
| Volatile | 76.46 | C | 47.13 | Protein | 24.42 |
| Ash | 16.39 | H | 6.29 | Fat | 10.30 |
| Fixed carbon | 7.15 | O | 25.46 | Cellulose | 15.98 |
| N | 4.22 | Hemicellulose | 9.13 | ||
| S | 0.51 | Lignin | 5.54 | ||
| Salt | 10.19 | ||||
3.2 Thermogravimetric analysis
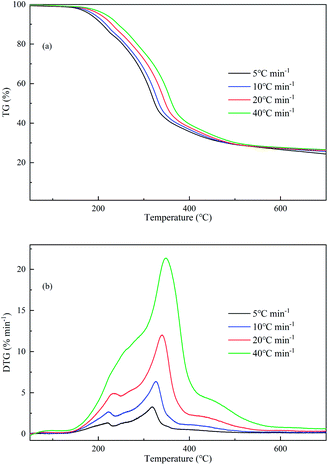
Fig. 1 gives the TG and differential thermogravimetric (DTG) curves of SSR. As the heating rates increase, the TG curves shifted toward the high temperature zone because of the increased thermal lag. According to the curves, the thermal decomposition of SSR took place over three stages. Stage I (50–150 °C) mainly involved the evaporation of water, which was not obvious because dry SSR was employed for analysis. It is notable that the complete drying of biomass in the TG process required a high temperature around 150 °C due to the continuous increasing temperature and thermal hysteresis. SSR mainly decomposed in stage II (150–500 °C) with approximately 71 wt% weight loss. Whereas in stage III (>500 °C), the residue decomposed slowly and formed a porous char including ash. The final mass contents were 24.36–26.58 wt%, which agreed well with the total content of fixed carbon and ash of 23.54 wt% in the proximate analysis of SSR.According to Fig. 1, there were two peaks in the DTG curves under lower heating rates, but only a main peak and a shoulder peak at 40 °C min−1. This might be attributed to the fact that more volatiles were generated in a short time under higher heating rates. The first peak centered at 236.6 °C might be related to the decomposable compounds, like hemicellulose, fat, and so on. The main peak situated at 339.9 °C might result from the overlapping decomposition of lignin, cellulose or protein.31 In addition, the relevant pyrolytic parameters of the main decomposition stage of SSR (stage II) are demonstrated in Table 2. The high heating rates were responsible for the enhanced mass loss rates. The maximum mass loss rate (DTGmax) rose gradually from 3.27% min−1 to 21.37% min−1 as the heating rate rose from 5 to 40 °C min−1.
3.3 Kinetic analysis
As typical equivalent conversion rate methods, the FWO and KAS methods are simple and possess good experimental linearity, regardless of the f(α). The pyrolysis kinetics of SSR were studied with the α range of 0.1–0.7. Fig. 2 shows the corresponding plots of iso-conversional lines with high linear correlation coefficients (>0.98). The linear equations at different conversions show the corresponding activation energy (E) values (Fig. 2c). Apparently, the E values calculated from both the FWO and KAS methods exhibited a monotonous increasing trend with α, indicating that the SSR pyrolysis was a multi-step reaction and decomposing at higher α was more difficult. The E values were about 117.81–178.4 kJ mol−1 from FWO, and 115.77–177.33 kJ mol−1 from KAS, within a variation of only 2.5 kJ mol−1, indicating that both methods were effective in determining the activation energy for SSR pyrolysis.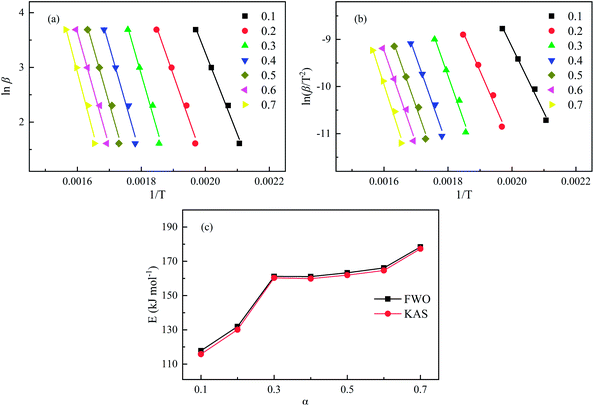 | ||
| Fig. 2 Kinetic plots according to FWO (a) and KAS (b) and the corresponding activation energies (c) of SSR. | ||
3.4 Ex situ CFP experiments via Py-GC/MS
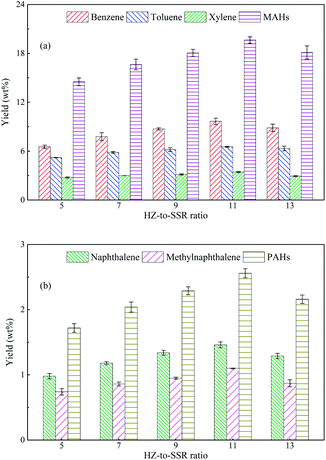
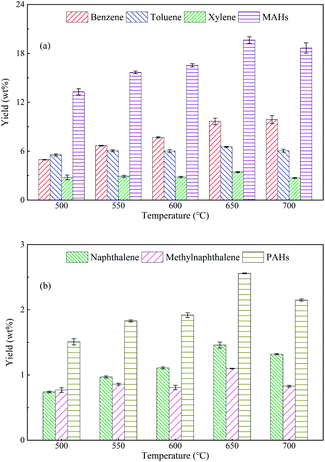
Differently from the pyrolysis of pure SSR, five major aromatic hydrocarbons became the predominant products from the ex situ CFP of SSR, which were benzene, toluene, xylene, naphthalene and methylnaphthalene. The first three products are monocyclic aromatic hydrocarbons (MAHs), while the latter two are polycyclic aromatic hydrocarbons (PAHs). This catalytic effect was attributed to the excellent shape selectivity and aromatization of HZSM-5, and coincided well with the previous literatures.28,34 Therefore, it is interesting to explore the optimal pyrolytic conditions for maximizing the yields of aromatic hydrocarbons.
It is notable that the highest yields of aromatic hydrocarbons from the CFP of typical lignocellulosic biomass with HZSM-5 were reported to be no more than 11 wt% in previous studies15,36 and our work.27 The above results clearly indicated that SSR was more promising than the lignocellulosic biomass to be used for the preparation of aromatic hydrocarbons, with the yield around two times of that from lignocellulosic biomass. This should be attributed to the different chemical compositions between SSR and lignocellulosic biomass. SSR was the byproduct from the soy sauce fermentation process, and fermentation pretreatment could degrade the organic components to facilitate the decomposition of SSR,37 resulting in more volatiles to be further converted into aromatics. Therefore, SSR could be a potential feedstock to produce aromatic hydrocarbons for industrial applications.
3.5 Ex situ CFP experiments via the lab-scale device
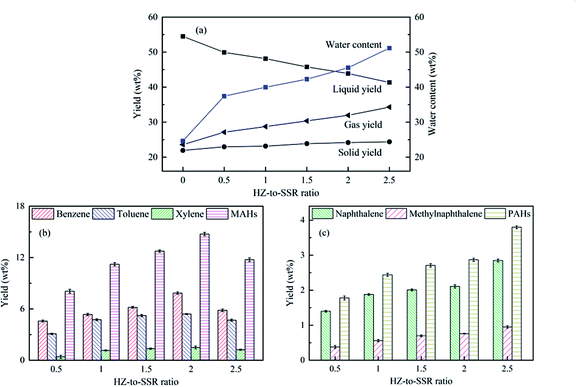
Based on the Py-GC/MS experiments, the lab-scale CFP experiments of SSR with HZSM-5 were performed under 650 °C. The influences of the HZ-to-SSR ratio on the regulation of pyrolytic products were investigated (Fig. 5), wherein the HZ-to-SSR ratios were 0.5, 1, 1.5, 2, and 2.5, respectively. Compared with the pure SSR pyrolysis, HZSM-5 decreased the liquid yield and increased the gas yield obviously, accompanied with a slight increase of the solid yield. Such trends were further enhanced by the augmentation of HZ-to-SSR ratio. The liquid yield dropped from 49.92 wt% to 41.33 wt% as the HZ-to-SSR ratio increased from 0.5 to 2.5, while the gas yield rose from 23.59 wt% to 34.29 wt% monotonically. Moreover, the water content of the liquid product also rose along with the HZ-to-SSR ratio. Unlike the liquid and gas yields, the solid yield rose slightly from 22.96 wt% to 24.38 wt%. Since the CFP was carried out in the ex situ mode and the reaction temperature was fixed at 650 °C, the slight increase of the solid yield should mainly result from the coke deposition on HZSM-5.40 During the ex situ CFP process, the devolatilization of SSR was mainly dependent on the pyrolysis temperature and the pyrolytic volatiles would contact the HZSM-5 and undergo various reactions over it to generate light organic volatiles (mainly aromatic hydrocarbons), water, permanent gases and char/coke. Under a fixed pyrolysis temperature, the catalyst and reaction time were critical for the catalysis process to generate the final products. Larger amounts of catalysts would provide more active sites and increase the vapor residence time, and as a result, more water, permanent gases and solid products were generated at the expense of organic liquid products.40,41The yields of aromatic hydrocarbons are depicted in Fig. 5. Under the non-catalytic condition, the aromatics yield from pure SSR was too low to be accurately quantified, and the relevant results are not given. As demonstrated in Fig. 5b, the MAHs yield had a tendency of increasing first and then decreasing with the increase of the HZ-to-SSR ratio, similar to the results from the Py-GC/MS above. The yields of aromatic hydrocarbons and MAHs had maximum values of 17.61 wt% and 14.74 wt%, respectively, including 7.85 wt% benzene, 5.40 wt% toluene and 1.49 wt% xylene. In addition, the PAHs yield rose monotonically from 1.78 wt% to 3.80 wt% as the HZ-to-SSR ratio rose from 0.5 to 2.5, which might be resulted from the enhanced reactions of MAHs with other oxygenated compounds to generate PAHs under high HZ-to-SSR ratios.42 PAHs are known as undesirable compounds due to their high toxicity, and they are also the precursors of coke. Therefore, high HZ-to-SSR ratios should not be used in the CFP of SSR to avoid the significant formation of PAHs.
3.6 Physicochemical properties of NAC
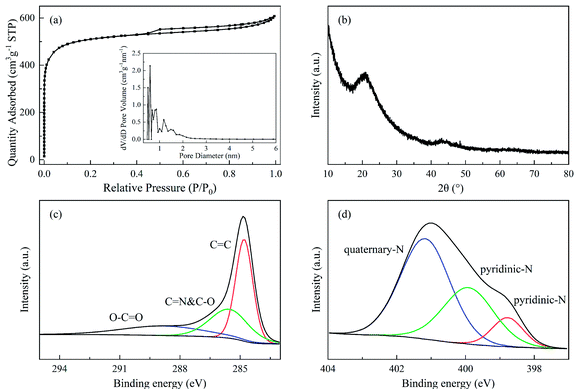
In order to improve the economy of the CFP technology of SSR, the pyrolytic solid product obtained at the optimum condition was activated for the co-production of NAC. The porous properties as well as XRD and XPS analysis results of NAC are illustrated in Fig. 6 and Table 3. Based on the IUPAC nomenclature, the N2 sorption isotherm plots of NAC in Fig. 6a belonged to type-IV, which exhibited the fingerprints of both microporosity and mesoporosity.43 The inset figure in Fig. 6a further demonstrated that the NAC was dominated by micropores with an average pore diameter of 1.90 nm. As shown in Table 3, the corresponding SSA and total pore volume were 1928.6 m2 g−1 and 0.932 cm3 g−1, of which the micropores contributed 70.4% and 57.4%, respectively. The high salt content that remained in the solid product should contribute to the formation of the hierarchical pores of NAC during the activation process,28 which would be instrumental in the ion transfer and charge storage.10,44As demonstrated in Fig. 6b, a prominent diffraction peak centered at 21.2° and a weak peak at 43.2° emerged in the XRD spectrum of NAC. The former was ascribed to the (002) plane, while the latter was to the (100) plane. The (002) plane peak usually appears at approximately 22.5° so the shift of the peak in NAC towards a lower angle was believed to be due to the high N and O contents in NAC.23 This can be verified by the ultimate analysis demonstrated in Table 3, in which the N and O contents were 1.60 wt% and 14.67 wt%, respectively. Moreover, the predominant broad diffraction peak revealed the graphitization of NAC to some extent.45
The XPS spectra of C 1s and N 1s of NAC are demonstrated in Fig. 6c and d. The peaks situated at 284.8, 285.5 and 288.8 eV could be attributed to C![[double bond, length as m-dash]](https://www.rsc.org/images/entities/char_e001.gif) C, C
C, C![[double bond, length as m-dash]](https://www.rsc.org/images/entities/char_e001.gif) N/C–O, and O–C
N/C–O, and O–C![[double bond, length as m-dash]](https://www.rsc.org/images/entities/char_e001.gif) O, respectively. For the N species, three peaks situated at 398.7, 399.9, and 401.1 eV represented pyridinic-N, pyrrolic-N and quaternary-N, respectively. The capacitance of NAC consisted of pseudocapacitance and weight capacitance. The presence of pyridinic-N, pyrrolic-N and C
O, respectively. For the N species, three peaks situated at 398.7, 399.9, and 401.1 eV represented pyridinic-N, pyrrolic-N and quaternary-N, respectively. The capacitance of NAC consisted of pseudocapacitance and weight capacitance. The presence of pyridinic-N, pyrrolic-N and C![[double bond, length as m-dash]](https://www.rsc.org/images/entities/char_e001.gif) O would enhance the pseudocapacitance of NAC, while the existence of quaternary-N would augment the weight capacitance of NAC.24,46
O would enhance the pseudocapacitance of NAC, while the existence of quaternary-N would augment the weight capacitance of NAC.24,46
3.7 Electrochemical characteristics
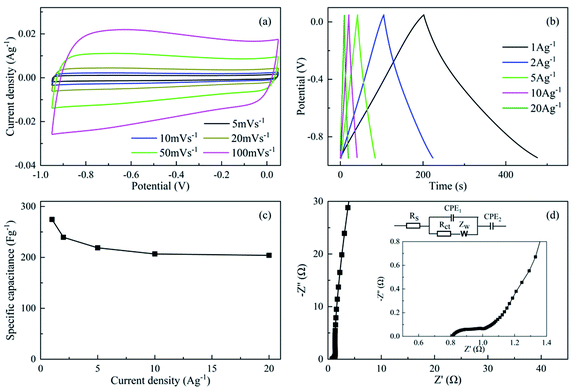
The CV, GCD and EIS results of NAC are illustrated in Fig. 7. All the CV curves of NAC possessed quasi-rectangular shapes (Fig. 7a), implying the high electron ion transfer rate and low inner resistance of NAC.47 The GCD curves of NAC under various current densities exhibited non-liner characteristics, which might be attributed to the extra pseudocapacitance donated by heteroatom-doped groups. Furthermore, the corresponding Cgs were calculated (Fig. 7c). Apparently, the Cg exhibited a tendency of monotonically decreasing with the increase of current densities. The Cg achieved a satisfactory value of 274.5 F g−1 at 1 A g−1 and decreased to 204.0 F g−1 at 20 A g−1 with a 74.3% Cg retention. The reduction of the Cg under high current densities might be ascribed to the large impedance caused by the micropores.48 Generally, large impedance would increase the charging time constant to complete charge, leading to the incomplete charge and decrease of Cg. The high retention implied the excellent electrochemical capacitive properties, which might be ascribed to the synergistic effects of the good pore structure and effective incorporation of N in the NAC.22According to the Nyquist plot of NAC in Fig. 7d, the large line slope in the low frequency region implied the good capacitive behavior of NAC with a low diffusion resistance in the pores.24 The semicircle at high frequencies demonstrated that the NAC possessed a low charge transfer resistance (Rct) of no more than 0.2 Ω and equivalent series resistance (Rs) of approximately 0.8 Ω, suggesting the excellent conductivity of NAC.49 In addition, a low Warburg impedance (Zw) of 0.9 Ω was attained, indicating that electrolyte ions were permitted access to the electrode surface efficiently through a short ion diffusion path. In brief, the synergistic effects of the heteroatom incorporation and hierarchical pores enabled the NAC to be promising as a supercapacitor because the heteroatom-containing groups would facilitate the extra pseudocapacitance as well as the wettability, while the hierarchical pores could enhance the ion transfer and charge storage.
4. Conclusions
The present work provided a creative method for the polygeneration of aromatic hydrocarbons and NAC from the ex situ CFP of SSR with HZSM-5. The pyrolysis of SSR without the catalyst generated various complex pyrolytic products without any dominant ones due to the complicated composition of SSR, which mainly includes protein, fat, cellulose, hemicellulose, lignin and salt. The presence of HZSM-5 for the ex situ CFP of SSR could achieve the selective preparation of aromatic hydrocarbons and moreover, the pyrolytic solid product could be further activated with KOH without an extra N source to produce NAC as a supercapacitor electrode material. The results indicated that the CFP of SSR with HZSM-5 at 650 °C favored the selective preparation of aromatic hydrocarbons. The maximum yield of aromatic hydrocarbons reached 22.20 wt% from Py-CG/MS with an HZ-to-SSR ratio of 11, consisting of 19.64 wt% MAHs and 2.56 wt% PAHs, respectively. In addition, the lab-scale test obtained 17.61 wt% aromatic hydrocarbons with 14.74 wt% MAHs and 2.87 wt% PAHs at an HZ-to-SSR ratio of 2. The aromatic hydrocarbon yields were much higher than those produced from typical lignocellulosic materials with HZSM-5 (<11 wt%). In addition, the prepared NAC possessed hierarchical pores incorporated with N and exhibited an excellent Cg of 274.5 F g−1 at 1 A g−1.Conflicts of interest
There are no conflicts to declare.Acknowledgements
The authors thank the National Natural Science Foundation of China (51906066, 51922040), Grants from Fok Ying Tung Education Foundation (161051) and Fundamental Research Funds for the Central Universities (2020DF01, 2019JG002, 2018ZD08) for financial support.References
- C. Xiang, S. Y. Liu, Y. Fu and J. Chang, Renewable Energy, 2019, 134, 739–744 CrossRef CAS.
- P. Chen, H. Song, Y. Wang, P. Chen, X. Shen and S. Yao, J. Mater. Cycles Waste Manage., 2015, 17, 574–582 CrossRef CAS.
- X. Chen, Y. Luo, B. Qi, J. Luo and Y. Wan, Ultrason. Sonochem., 2017, 35, 351–358 CrossRef CAS PubMed.
- X. Chen, Y. Luo, B. Qi and Y. Wan, Sep. Purif. Technol., 2014, 128, 72–79 CrossRef CAS.
- Q. Lu, Z. Zhang, C. Dong and X. Zhu, Energies, 2010, 3, 1805–1820 CrossRef CAS.
- C. Liu, H. Wang, A. M. Karim, J. Sun and Y. Wang, Chem. Soc. Rev., 2014, 43, 7594–7623 RSC.
- Z. Zhang, K. Li, S. Ma, M. Cui, Q. Lu and Y. Yang, Ind. Crops Prod., 2019, 137, 495–500 CrossRef CAS.
- C. Liang, G. Gascó, S. Fu, A. Méndez and J. Paz-Ferreiro, Soil Tillage Res., 2016, 164, 3–10 CrossRef.
- M. Li and R. Xiao, Fuel Process. Technol., 2019, 186, 35–39 CrossRef CAS.
- J. K. Kim, Y. Yoo and Y. C. Kang, Chem. Eng. J., 2020, 382, 122805 CrossRef CAS.
- Q. Lu, Z. Wang, H. Guo, K. Li, Z. Zhang, M. Cui and Y. Yang, Fuel, 2019, 243, 88–96 CrossRef CAS.
- Q. Lu, M. Zhou, W. Li, X. Wang, M. Cui and Y. Yang, Catal. Today, 2018, 302, 169–179 CrossRef CAS.
- L. Zhu, Y. Zhang, H. Lei, X. Zhang, L. Wang, Q. Bu and Y. Wei, Sustainable Energy Fuels, 2018, 2, 1781–1790 RSC.
- W. Chen, X. Wang, M. Luo, P. Yang and X. Zhou, Waste Manag., 2019, 89, 129–140 CrossRef CAS PubMed.
- Nishu, R. Liu, M. M. Rahman, M. Sarker, M. Chai, C. Li and J. Cai, Fuel Process. Technol., 2020, 199, 106301 CrossRef CAS.
- D. J. Mihalcik, C. A. Mullen and A. A. Boateng, J. Anal. Appl. Pyrol., 2011, 92, 224–232 CrossRef CAS.
- S. Thangalazhy-Gopakumar, S. Adhikari, S. A. Chattanathan and R. B. Gupta, Bioresour. Technol., 2012, 118, 150–157 CrossRef CAS PubMed.
- Z. Li, L. Zhang, B. S. Amirkhiz, X. Tan, Z. Xu, H. Wang, B. C. Olsen, C. M. Holt and D. Mitlin, Adv. Eng. Mater., 2012, 2, 431–437 CAS.
- H. Lu and X. S. Zhao, Sustainable Energy Fuels, 2017, 1, 1265–1281 RSC.
- X. Zhao, C. Yan, X. Gu, L. Li, P. Dai, D. Li and H. Zhang, Chemelectrochem, 2017, 4, 1516–1522 CrossRef CAS.
- J. Wang, Y. Li, L. Yan and Y. Qu, Int. J. Electrochem. Sci., 2018, 13, 6259–6271 CrossRef CAS.
- D. Xu, Y. Su, S. Zhang and Y. Xiong, Energy Sources, Part A, 2020, 42, 1797–1807 CrossRef CAS.
- C. J. Raj, M. Rajesh, R. Manikandan, K. H. Yu, J. Anusha, J. H. Ahn, D.-W. Kim, S. Y. Park and B. C. Kim, J. Power Sources, 2018, 386, 66–76 CrossRef CAS.
- C. Lu, Y. H. Huang, Y. J. Wu, J. Li and J. P. Cheng, J. Power Sources, 2018, 394, 9–16 CrossRef CAS.
- P. A. Alaba, S. I. Popoola, F. Abnisal, C. S. Lee, O. S. Ohunakin, E. Adetiba, M. B. Akanle, M. F. A. Patah, A. A. A. Atayero and W. M. A. W. Daud, J. Therm. Anal. Calorim., 2020, 140, 1181–1823 CrossRef.
- P. A. Alaba, Y. M. Sani and W. M. A. W. Daud, J. Therm. Anal. Calorim., 2016, 126, 943–948 CrossRef CAS.
- K. Li, Z.-x. Wang, G. Zhang, M.-s. Cui, Q. Lu and Y.-p. Yang, Sustainable Energy Fuels, 2020, 4, 538–548 RSC.
- C. Wang, D. Wu, H. Wang, Z. Gao, F. Xu and K. Jiang, J. Mater. Chem. A, 2018, 6, 1244–1254 RSC.
- J. Alvarez, M. Amutio, G. Lopez, L. Santamaria, J. Bilbao and M. Olazar, Waste Manag., 2019, 85, 385–395 CrossRef CAS PubMed.
- C. S. Fermanelli, A. Córdoba, L. B. Pierella and C. Saux, Waste Manag., 2020, 102, 362–370 CrossRef CAS PubMed.
- F. Tang, Z. Yu, Y. Li, L. Chen and X. Ma, Bioresour. Technol., 2020, 299, 122636 CrossRef CAS PubMed.
- K. Li, L. Zhang, L. Zhu and X. Zhu, Bioresour. Technol., 2017, 234, 48–52 CrossRef CAS PubMed.
- S. Wang, G. Dai, H. Yang and Z. Luo, Prog. Energy Combust. Sci., 2017, 62, 33–86 CrossRef.
- A. López, I. De Marco, B. Caballero, A. Adrados and M. Laresgoiti, Waste Manag., 2011, 31, 1852–1858 CrossRef PubMed.
- M. Zhang and A. Moutsoglou, Energy Fuels, 2014, 28, 1066–1073 CrossRef CAS.
- Q. Che, M. Yang, X. Wang, Q. Yang, L. R. Williams, H. Yang, J. Zou, K. Zeng, Y. Zhu and Y. Chen, Bioresour. Technol., 2019, 278, 248–254 CrossRef CAS PubMed.
- T. Kan, S. Grierson, R. Nys and V. Strezov, Energy Fuels, 2014, 28, 104–114 CrossRef CAS.
- P. Qi, G. Chang, H. Wang, X. Zhang and Q. Guo, J. Anal. Appl. Pyrol., 2018, 136, 178–185 CrossRef CAS.
- X. Ren, J. Cao, X. Zhao, W. Shen and X. Wei, J. Anal. Appl. Pyrol., 2018, 130, 190–197 CrossRef CAS.
- B. Muneer, M. Zeeshan, S. Qaisar, M. Razzaq and H. Iftikhar, J. Cleaner Prod., 2019, 237, 117762 CrossRef CAS.
- N. H. Zainan, S. C. Srivatsa, F. Li and S. Bhattacharya, Fuel, 2018, 223, 12–19 CrossRef CAS.
- S. Liu, Y. Zhang, L. Fan, N. Zhou, G. Tian, X. Zhu, Y. Cheng, Y. Wang, Y. Liu, P. Chen and R. Ruan, Fuel, 2017, 196, 261–268 CrossRef CAS.
- M. Thommes, K. Kaneko, A. V. Neimark, J. P. Olivier, F. Rodriguez-Reinoso, J. Rouquerol and K. S. Sing, Pure Appl. Chem., 2015, 87, 1051–1069 CAS.
- W. Chen, X. Wang, C. Liu, M. Luo, P. Yang and X. Zhou, Waste Manag., 2020, 102, 330–339 CrossRef CAS PubMed.
- Z. Zou and C. Jiang, J. Alloys Compd., 2020, 815, 152280 CrossRef CAS.
- D. Fu, Z. Chen, C. Yu, X. Song and W. Zhong, Prog. Nat. Sci., 2019, 29, 495–503 CrossRef CAS.
- K. Li, W. Chen, H. Yang, Y. Chen, S. Xia, M. Xia, X. Tu and H. Chen, Bioresour. Technol., 2019, 280, 260–268 CrossRef CAS PubMed.
- P. Divya and R. Rajalakshmi, J. Energy Storage, 2020, 27, 101149 CrossRef.
- J. Yang, Y. Wang, J. Luo and L. Chen, Ind. Crops Prod., 2018, 121, 226–235 CrossRef CAS.
Footnote |
| † Electronic supplementary information (ESI) available. See DOI: 10.1039/d0ra03993d |
| This journal is © The Royal Society of Chemistry 2020 |

