 Open Access Article
Crystal structure, optical spectroscopy and energy transfer properties in NaZnPO4:Ce3+, Tb3+ phosphors for UV-based LEDs †
K. Saidi and
M. Dammak
 *
*
Département de Physique, Faculté des Sciences de Sfax, Laboratoire de Physique Appliquée, Groupe de Physique des Matériaux Luminescents, Université de Sfax, 3018 Sfax, Tunisia. E-mail: madidammak@yahoo.fr
First published on 8th June 2020
Abstract
A new series of Ce3+, Tb3+ singly doped and Ce3+/Tb3+ co-doped NaZnPO4 (NZPO) phosphors have been synthesized via a high-temperature solid-state reaction method at 800 °C. The crystal cell structure, luminescence proprieties, energy transfer, and chromaticity coordinates of the as-prepared phosphors were investigated in detail. The photoluminescence spectra of NZPO:Ce3+ phosphors exhibited broad emission in the 300–380 nm range, while under UV excitation, the singly doped NZPO:Tb3+ phosphor showed emission peaks at ∼485–690 nm among which the green emission peak appears at ∼543 nm. The Tb3+ green emission was significantly enhanced almost 20 times via energy transfer from Ce3+ to Tb3+. The energy transfer (ET) mechanism from Ce3+ to Tb3+ in NZPO is identified to be a resonant type via the dipole–dipole interaction mechanism with an ET efficiency of 91%. Intense green emission is obtained at very low Tb3+ concentrations under 285 nm excitation, making NZPO:Ce3+/Tb3+ an efficient UV-excited green phosphor. The NaZnPO4:Ce3+/Tb3+ phosphors are promising UV convertible materials of green light for UV -LEDs applications.
Introduction
Recently, inorganic luminescent materials have attracted great interest by virtue of their wide range of applications such as in white light-emitting diodes, vacuum fluorescent displays, X-ray imaging scintillators, plasma display panels, and field emission displays (FEDs). Luminescent materials have been widely investigated for their many advantages, such as intense brightness, long service life, facile preparation, and being environmental-friendly.1–4 Rare earth (RE3+), transition metals, and Bi3+-activated phosphors have been extensively investigated due to their unique luminescence performance.5–9 RE ions can emit fascinating colors thanks to their special 4f shell configuration. Different excitation energies and almost all of the visible light spectrum from violet to red can be obtained by combining different RE ions and varying the ratio of dopants. The Tb3+ rare-earth ions are good green-emitting activators due to their dominant green emission peaking around 544 nm which is attributed to 5D4–7F5 transitions. However, trivalent Tb3+ ions have weak absorption in the near-UV range due to 4f–4f strictly forbidden transitions.On the other hand, the trivalent Ce3+ admits broad absorption in the near-UV due to the parity-allowed 4f → 5d transition. It is one of the most excellent sensitizers for WLEDs due to the parity-allowed 4f → 5d transitions. Since the 5d orbital is exposed in the outer electron shell and strongly interacts with its crystalline field, the Ce3+emission wavelength is usually concentrated on the UV and blue light regions.10,11 Ce3+ ions can efficiently absorb near-UV light and yield broad blue emission. Thus, the energy absorbed by Ce3+ (sensitizer) is expected to be transferred to Tb3+ (activator) in an appropriate host.
Phosphates based phosphors having the general formula ABPO4 (A = monovalent and B = divalent cations) possess excellent physicochemical properties, optical stabilities, better color rendering index (CRI), low phonon energy, good thermal, mechanical and chemical stability. This leads to producing luminescent materials with high the luminescence efficiency for practical applications.12–14 Among the phosphates-based materials, the sodium zinc ortho-phosphate (NaZnPO4) presents excellent coordination flexibility and strong Zn–O–Zn linkages within the lattice. Materials with such properties may improve the PL performance.15 On the other hand, luminescence of Ce3+ and Tb3+ ions have gotten actual applications in lightings, detections, and displays.10,16,17
Recently, various host materials for Ce/Tb system have been reported for lighting applications including Sr2LiScB4O10:Ce3+/Tb3+,17 K2CaP2O7:Ce3+/Tb3+,18 MgZn2(PO4)2:Ce3+/Tb3+ (ref. 19) and SrMgSi2O6:Ce3+/Tb3+.20 Still, there is a demand for novel single-phase green-emitting phosphors with high-efficiency transfers for UV-LEDs applications.
In the previous reports, the properties of NaZnPO4 phosphors doped rare-earth ions have been studied by some researchers.14,21,22 However, to enrich the color of the emitted light and to improve the luminescent performance, it is necessary to choose other dopant ions for NaZnPO4 phosphor materials. To the best of our knowledge, the luminescence properties and energy transfer between Ce3+ and Tb3+ in this host lattice have not been discussed so far. In the present work, we have synthesized single-phase NaZnPO4:(Ce3+, Tb3+) by a solid-state reaction. The crystal structure of the doped materials was discussed. The photoluminescence (PL) properties, the energy transfer mechanism between the sensitizer and activator, and the color chromaticity under UV light have been studied in detail. These results demonstrated the potential applications of NZPO:Ce3+/Tb3+ phosphors for solid-state lighting and UV-pumped LEDs.
Experimental section
A series of samples with nominal chemical formulas NaZnPO4 doped xCe3+ (x = 0.02, 0.03, 0.04, 0.05, 0.06 and 0.08), yTb3+ (y = 0.02, 0.04, 0.06, 0.08, 0.10 and 0.12) and co doped xCe3+/yTb3+ (abbreviated as NZPO:xCe3+/yTb3+, where x and y are the molar concentrations), were prepared by a solid-state reaction route at high temperature. The chemical reaction of the NaZnPO4 host compound is given below:| Na2CO3 + 2ZnO + 2NH4H2PO4 → 2NaZnPO4 + 2NH3↑ + CO2↑ + 3H2O |
The reactants are: ZnO [analytical reagent (A.R.)], NH4H2PO4 (A.R.), Tb4O7 (99.99%), Ce2O3 (99.9) and Na2CO3 (A.R.). They were weighed stoichiometrically and ground thoroughly in an agate mortar. The mixture was first preheated at 400 °C for 6 h, then reground, and finally fired at 800 °C for 4 h. Subsequently, the products were cooled to room temperature (RT) by switching off the muffle furnace and ground into white power.
Characterization techniques
The X-ray diffraction powder patterns were recorded at room temperature on a Bruker D8 Advance (SeriesII-2009) with Cu Kα radiation on the 10–80° 2θ range with operating at 45 kV and 40 mA. Fourier transforms infrared spectroscopy (FTIR) for the titled compounds were recorded at room temperature on Perkin Elmer Spectrum 1000 FT-IR spectrometer in the 400–1400 cm−1 range. The photoluminescence excitation (PLE) and photoluminescence (PL) spectra were recorded on a Jobin Yvon Fluoromax-4 Spectrofluorometer (Horiba, USA) equipped with a 150 W Xe lamp used as an excitation source.Results and discussion
Structure of products
The NZPO host possesses a monoclinic system and the space group P21/n.23 This result can be further confirmed by the Rietveld refinement of the NZPO sample shown in Fig. S1.† The result of Rietveld refinement with χ2 = 2.24 ensures the accuracy in lattice parameters and atomic site occupations listed in Tables S1 and S2.† The Schematic illustration of the crystal structure of NZPO is presented in Fig. S2.† In this host, the Zn site with the 4e Wyckoff position which creates high stress in the lattice. There exist three kinds of Zn2+cation sites (Zn10, Zn14, and Zn19) and three positions of Na+ sites: Na (6), Na (7), and Na (18) with a coordination number (CN), CN = 6 for Na (6) and Na (7) and CN = 8 for Na (18). The interatomic distances of P–O, Zn–O, and the Na–O for the NZPO sample are listed in Table S3.†Fig. 1(a) shows the XRD patterns of NZPO, NZPO:0.05Ce3+, NZPO:0.08Tb3+ and NZPO:0.05Ce3+, 0.01Tb3+ samples, respectively. Fig. 1(b) depicts part patterns of Fig. 1(a) corresponding to the most pronounced diffraction peak.
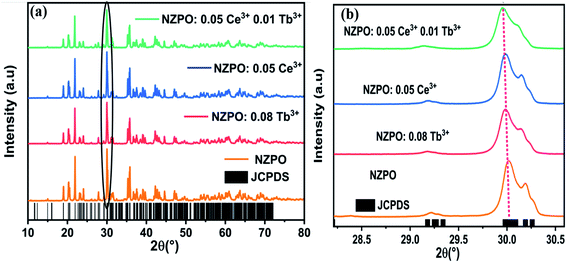 | ||
| Fig. 1 (a) Powder XRD patterns of NZPO, NZPO:0.05Ce3+, NZPO:0.08Tb3+ and NCPO:0.05Ce3+/0.01Tb3+ (b) magnified XRD patterns in the region between 28.30 and 30.60°. | ||
Obviously, the main diffraction peaks are observed at 18.91°, 20.18°, 21.84°, 27.73°, 29.91° and 35.64° which are assigned to the (1,1,2), (1,0,3), (0,2,0), (1,1,4), (1,2,3) and (3,0,3) planes respectively. The XRD pattern is matching well and the peaks are perfectly indexed. No additional peaks have been found in the XRD pattern which suggests the single-phase formation of the prepared phosphors. The dopant ions such as Ce3+ and Tb3+ are supposed to occupy the NZPO lattice to substitute Zn2+ ions which creates high stress in the lattice.24,25 The ionic radii of the doped ions are larger than those of Zn2+ (the ionic radii of Tb3+ is 0.94 Å, Ce3+ is 1.07 Å and Zn2+ is 0.74 Å). Thus, it can result in charge imbalance and form charge defects in host lattice when the trivalent rare-earth ions replace the divalent alkaline earth ions. However, the substitution of Ce3+ and Tb3+ ions could bring the positive charges in the lattices inducing a mismatch of charge on the cation sites that could be balanced by the negative charges, like cation vacancy (VZn), or interstitial oxygen (Oi). Therefore, the lattice gets enlarged and for which all the peaks in the XRD pattern shifted slightly in the lower angle side compared to the standard JCPDS card no. 79-0217 pattern of the host lattice because of the radius difference,26,27 as depicted in Fig. 1(b). Rietveld plots of NZPO:0.05Ce3+, NZPO:0.08Tb3+ and NZPO:0.05Ce3+/0.01Tb3+ are presented in Fig. S3, S4 and S5† respectively. The lattice parameters and the corresponding unit cell volumes of the prepared phosphors were calculated from the diffraction data using Rietveld refinement and listed in Table 1.
| Compose | NZPO | NZPO:0.08Tb3+ | NZPO:0.05Ce3+ | NZPO:0.05Ce3+/0.01Tb3+ |
|---|---|---|---|---|
| a (Å) | 8.668 | 8.670 | 8.667 | 8.672 |
| b (Å) | 8.131 | 8.133 | 8.133 | 8.135 |
| c (Å) | 15.2591 | 15.262 | 15.263 | 15.255 |
| β (°) | 89.8007 | 89.800 | 89.798 | 89.7975 |
| V (Å3) | 1075.548 | 1076.227 | 1076.195 | 1076.316 |
FTIR analysis
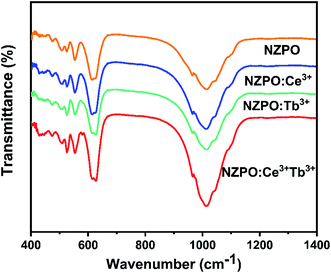
In order to confirm the phase purity, the functional group analyses were performed by Fourier Transform Infrared (FTIR) spectroscopic method. FTIR spectra of undoped, Tb3+, Ce3+ doped and Ce3+/Tb3+ codoped NaZnPO4 phosphors are shown in Fig. 2. The observed bands in the 900–1100 cm−1 range are assigned to the symmetric and antisymmetric stretching frequencies (PO43−). Similarly, the bands located in the 500–630 cm−1 range correspond to the asymmetric deformation modes. The absorption band at 472 cm−1 is due to symmetric deformation modes of phosphate groups, this band confirms the apatite structure of the phosphate and then the existence of PO4 tetrahedra in their structures.22,28 No additional peaks were observed in FTIR spectra which confirm the phase purity of the phosphors. Therefore, the FTIR analysis also supports the XRD results that the synthesized compounds possessed a monoclinic structure.Luminescence properties of Ce3+ ions in NZPO phosphors
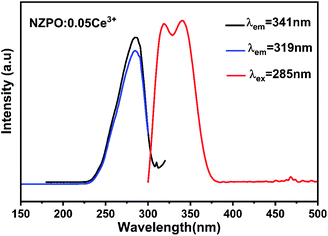
Fig. 3 exhibits the PLE spectra of NaZnPO4:0.05Ce3+ monitored at 319 nm and 341 nm emission wavelengths and the PL spectrum of NaZnPO4:0.05Ce3+ under 285 nm excitation.The PLE spectra NZPO:0.05Ce3+ display one band in the 200–300 nm range (λmax ≈ 285 nm), which can be attributed to the transitions from the ground state to the different crystal field splitting levels of the 5d state of the Ce3+ ions. The absence of electrons in the 5s and 5p shells makes them in the inner 5d orbital unshielded and exposed to the environment ions. The 5d orbital is the excited energy level for electrons promoted from 4f orbital ground state under UV excitation. It can be seen that the emission spectrum consists of a double band with maximum peaks at approximately 319 nm (31![[thin space (1/6-em)]](https://www.rsc.org/images/entities/char_2009.gif) 347.96 cm−1) and 341 nm (29
347.96 cm−1) and 341 nm (29![[thin space (1/6-em)]](https://www.rsc.org/images/entities/char_2009.gif) 325.51 cm−1) depicted in the inset with a difference of approximately 1936 cm−1 under near-ultraviolet excitation (285 nm).17,29 This result is in accordance with the theoretical value of ≈ 2000 cm−1. The double band emission is observed which verifies one specific lattice site due to the transitions from the relax lowest 5d excited state to the 2F5/2 and 2F7/2 spin–orbit split 4f ground states (5d → 2F5/2 and 5d → 2F7/2). It's worth noting that the similarity of Zn (1), Zn (2), and Zn (3) sites can lead to the one-site luminescent behavior for Ce3+.
325.51 cm−1) depicted in the inset with a difference of approximately 1936 cm−1 under near-ultraviolet excitation (285 nm).17,29 This result is in accordance with the theoretical value of ≈ 2000 cm−1. The double band emission is observed which verifies one specific lattice site due to the transitions from the relax lowest 5d excited state to the 2F5/2 and 2F7/2 spin–orbit split 4f ground states (5d → 2F5/2 and 5d → 2F7/2). It's worth noting that the similarity of Zn (1), Zn (2), and Zn (3) sites can lead to the one-site luminescent behavior for Ce3+.
Fig. 4(a) and (b) present the concentration-dependent PL spectra of NZPO:Ce3+ phosphors upon 285 nm UV excitation, and the concentration dependence of the emitting intensities of NZPO:Ce3+ with various Ce3+ concentrations, respectively. The emission intensities increase with Ce3+ concentration increasing up to 0.05; beyond that, it decreased to the lowest because of the concentration quenching effect. When the x value reaches 0.05, the maximum emission intensity occurs and it was kept as a constant value to prepare Ce3+/Tb3+ co-doped NZPO phosphors.
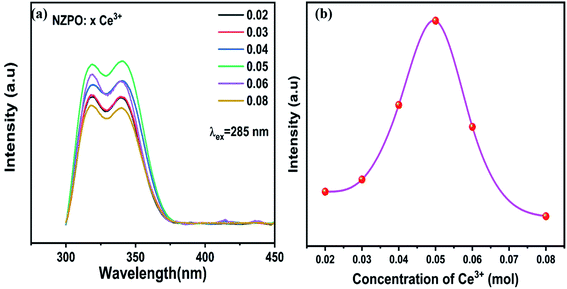 | ||
| Fig. 4 (a) Concentration-dependent PL spectra of NZPO:xCe3+ (x = 0.02, 0.03, 0.04, 0.05, 0.06 and 0.08). (b) Variation of the emission intensity with Ce3+(x) concentration. | ||
The non-radiative energy transfer mechanism was responsible for the concentration quenching of NZPO:x Ce 3+ phosphors. The critical distance RC between Ce3+ ions can be estimated using the equation given by Blasse:30,31
 | (1) |
The concentration quenching mechanism of the Ce3+ in the phosphor is dominated by the multipole–multipole interaction. Based on the report of Van Uitert,32 the relation between emission intensity (I) and doping concentration of Ce3+ ions (x) can be expressed as:
| I/x = k(1 + β(x)θ/3)−1 | (2) |
Log(I/x) = K′ − (θ/3)Log(x) and K′ = log![[thin space (1/6-em)]](https://www.rsc.org/images/entities/char_2009.gif) k − log k − log![[thin space (1/6-em)]](https://www.rsc.org/images/entities/char_2009.gif) β β
| (3) |
Fig. 5 illustrates the relationship between log(I/x) and log(x) and the corresponding straight line with slope referring – θ/3. Herein, the calculated value of θ/3 is 1.4066, and θ can be calculated as 4.2198, which is close to 6. The result indicates that the concentration quenching mechanism of the Ce3+ emission in NZPO:Ce3+ host is dominated by the dipole–dipole (D–D) interaction.
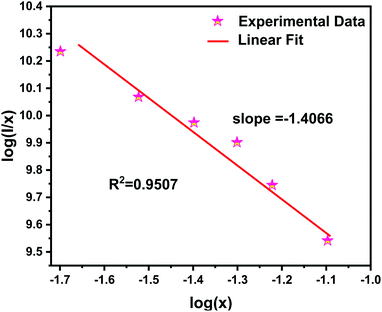 | ||
| Fig. 5 Linear fitting of log(x) versus log(I/x) of NZPO:xCe3+ (x = 0.02, 0.03, 0.04, 0.05, 0.06 and 0.08) phosphors. | ||
Luminescence NZPO:Tb3+ phosphors
The excitation and emission spectra of Tb3+ activated NZPO powders are displayed in Fig. 6. The excitation spectrum of the NZPO:0.08Tb3+ monitored at 543 nm presents several bands between 290 and 490 nm, which can be attributed to f–f transitions within the 4f8 configuration of Tb3+. These bands are attributed to the 7F6 → 5H6 (303 nm), 7F6 → 5H7 (318 nm), 7F6 → 5L6 (341 nm), 7F6 → 5L9 (350 nm), and 7F6 → 5G6 (375 nm) transitions.27,35 In Addition, the position of the peaks has not been changed for the 4f electrons of Tb3+ ions since they are shielded by 5s2 5p6 shells. The emission spectrum is recorded in the range of 400–700 nm by exciting with a UV light at 375 nm. The phosphor shows the emission peaks at 490 nm, 543 nm, 582 nm, and 620 nm, which are assigned to 5D4 → 7F6, 5D4 → 7F5, 5D4 → 7F4 and 5D4 → 7F3 transitions, respectively.35,36 NZPO:0.08 Tb3+ can produce a green emission due to the maximum peak at 543 nm corresponding to the 5D4 → 7F5 magnetic dipole transition. This green emission peak at 543 nm has an extremely narrow full-width at half-maximum (FWHM) of only about 10 nm, which is narrower than the previously reported green luminescence materials used for display, involving Ca2YZr2(AlO4)3:Tb3+ (>13.5 nm), SiO2:Tb3+ (>20 nm), and in the same order then that reported for LaPO4 codoped Ce3+/Tb3+ (>7.8 nm).37–39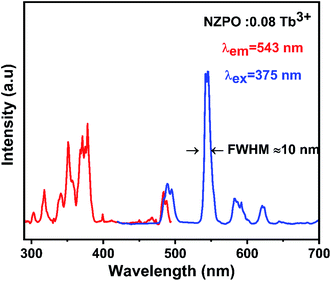 | ||
| Fig. 6 PL excitation and emission spectra of NZPO:0.08Tb3+ monitored at 543 nm and excited at 375 nm. | ||
The PL emission intensity of the Lanthanides (Ln3+) doped phosphors is strongly dependent on the activator's concentration. To figure out the optimal doping concentration of Tb3+ ions in NZPO host material, a series of Tb3+ doped NZPO phosphors were prepared and their luminescent properties were also studied.
Fig. 7 shows the PL spectra of the NZPO:x Tb3+ (x = 0.02, 0.04, 0.06, 0.08, 0.10 and 0.12) phosphors as a function of Tb3+ ion concentration under 375 nm excitation. The PL emission intensity of the NZPO:Tb3+ phosphors first exhibited an increasing tendency with the increase of Tb3+ doping concentration and reached a maximum at 0.08Tb3+. This phenomenon is a result of the concentration quenching of the Tb3+ ions. It is accepted that the non-radiative energy transfer among Tb3+ ions mainly results in the concentration quenching. In order to analyze the energy transfer mechanism between Tb3+ in NZPO, the critical distance is needed to be determined eqn (1).
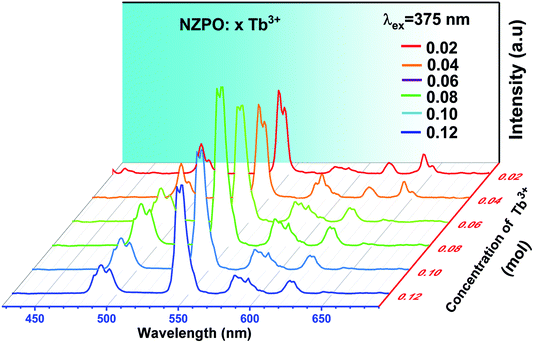 | ||
| Fig. 7 Emission spectra of NZPO:xTb3+ (x = 0.02, 0.04, 0.06, 0.08, 0.10 and 0.12) excited at 375 nm. | ||
The critical transfer distance RTb–Tb for energy transfer from Tb3+ to Tb3+ ions in NZPO phosphors was calculated to be ∼18![[thin space (1/6-em)]](https://www.rsc.org/images/entities/char_2009.gif) 586 Å. The exchange interaction is not possible between the Tb3+ ions because the Rc value is greater than 5 Å. The larger value of Rc indicates that multipolar interaction was responsible for the concentration quenching.
586 Å. The exchange interaction is not possible between the Tb3+ ions because the Rc value is greater than 5 Å. The larger value of Rc indicates that multipolar interaction was responsible for the concentration quenching.
The interaction type between different Tb3+ ions can be obtained by the eqn (2) and (3).
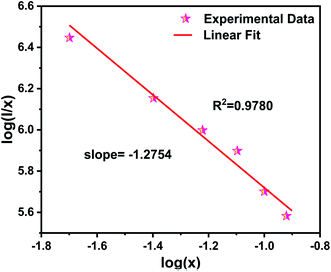
Fig. 8 shows the relationship between log(I/x) and log(x) of NZPO:Tb3+ phosphor. The slope value of −1.2754 was determined from the linear curve of log(I/x) versus log(x). Hence, the θ value was determined to be 3.8262, which is quite close to the theoretical value of 6 corresponding to the D–D interaction. It can be concluded that the D–D interaction is the main mechanism for the concentration quenching.
Luminescence and energy transfer in NZPO:Ce3+/Tb3+ phosphors
Fig. 9(a) depicts the PL and PLE spectra of singly Ce3+ and Tb3+ doped in NaZnPO4 respectively. The overlap between the PL and PLE spectra induces an important energy transfer between the Ce3+ and Tb3+ ions. Generally, Ce3+ ions can be introduced as sensitizers to the Tb3+ ions to increase the Tb3+ emissions.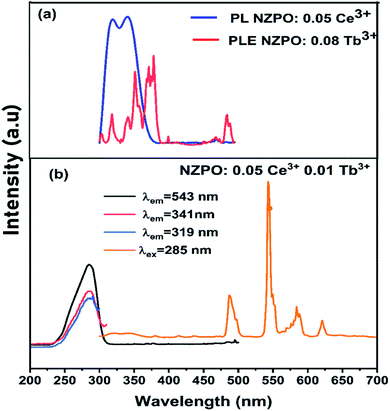 | ||
| Fig. 9 (a) Spectral overlap between the emission spectrum of NZPO:0.05Ce3+ and the excitation spectrum of NZPO:0.02Tb3+. (b) Excitation and emission spectra of NZPO:0.05Ce3+/0.01Tb3+ phosphors. | ||
Fig. 9(b) presents the excitation spectrum of NZPO:0.05 Ce3+/0.08Tb3+ supervised at 543 nm (Tb3+ emission). This spectrum is similar to that supervised at 319–341 nm (Ce3+ emission) except for the difference in the relative intensity. The excitation spectrum shows broad band of Ce3+ ion which is attributed to the 4f–5d transition. The presence of the Ce3+ transition in the excitation spectra monitored within the Tb3+ emissions demonstrates the presence of an energy transfer between the Ce3+ and Tb3+ ions.19 In order to further investigate this energy transfer process, we have investigated the PL spectra of the NZPO:Ce3+/Tb3+ co-doped phosphor under 285 nm excitation. The PL spectrum exhibited both, the emission transitions of Ce3+ (5d → 4f) and those of Tb3+ ions (5D4 → 7F3,4,5,6). The doping concentration of Ce3+ is fixed at the optimal value 0.05, and a series of NZPO:0.05Ce3+, y Tb3+ (y = 0, 0.01, 0.02, 0.04, 0.06, 0.08) samples were prepared.
Fig. 10 displays the emission spectra of NZPO:0.05Ce3+/yTb3+ (y = 0, 0.01, 0.02, 0.04, 0.06, 0.08) phosphors under 285 nm excitation. The highest intensity green emission of Tb3+ (543 nm) was realized for NZPO:0.05Ce3+/0.01Tb3+. We noticed a gradually decreases of the Ce3+ PL intensity with Tb3+ concentration increasing, as can be clearly seen in Fig. 11. These results confirmed that an effective energy transfer occurred between the Ce3+ and the Tb3+ ions.
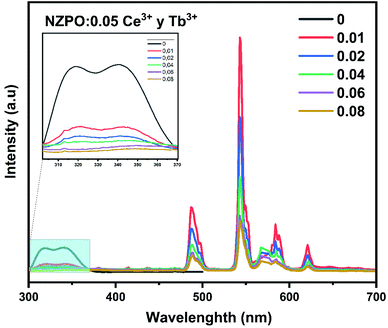 | ||
| Fig. 10 PL spectra of NZPO:0.05Ce3+/yTb3+ (y = 0.00, 0.01, 0.02, 0.04, 0.06 and 0.08) excited at 285 nm. | ||
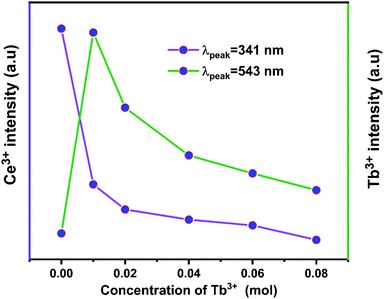 | ||
| Fig. 11 Dependence of (5d → 4f) Ce3+ and (5D4 → 7F5) Tb3+ emissions as a function of Tb3+ concentration. | ||
This energy transfer between Ce3+ and Tb3+ ions can more investigated according to the Dexter model.40,41
 | (4) |
 integral represents the spectral overlap between the emission spectrum of the sensitizers and the excitation spectrum of activators.
From the apparent overlap between the Tb3+ PLE and Ce3+ PL spectra and the Dexter eqn (4), it can be concluded that resonance type energy transfer may occur from Ce3+ to Tb3+ in the NZPO host.
Moreover, the comparison of PL spectra of NZPO:Tb3+ and NZPO:Ce3+/Tb3+ show that the intensity of green Tb3+ emission is higher in the co-doped than that in the doped sample which confirms that Ce3+ is an efficient sensitizer ion for Tb3+ green emission, as shown in Fig. 12. The overall integrated emission intensity is enhanced of about 20 times in the co-doped sample (NZPO:0.05Ce3+/0.01Tb3+) when compared to the doped sample (NZPO:0.08 Tb3+).
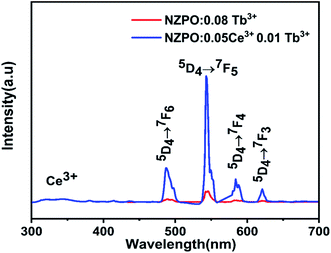 | ||
| Fig. 12 Comparison of Tb3+ emissions of doped NZPO:0.08Tb3+ and cooped NZPO:0.05Ce3+/0.01Tb3+ phosphors. | ||
Ce3+ → Tb3+ energy transfer
The ET efficiency (ηT) of Ce3+ → Tb3+ in NZPO phosphors can be calculated by using the following equation:37,42
 | (5) |
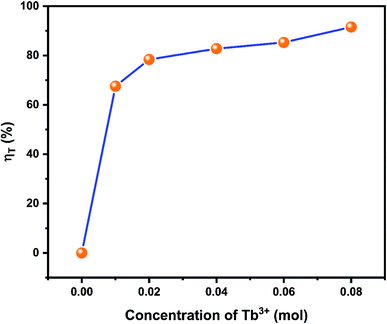
Fig. 13 illustrated the energy transfers efficiencies in NZPO:0.05Ce3+/xTb3+ (y = 0.01, 0.02, 0.04, 0.06 and 0.08). It was seen that the energy transfer efficiencies values increase with Tb3+ increasing. A maximum Ce3+ → Tb3+ energy transfer efficiency of 91% was obtained for NZPO:0.05Ce3+/0.08Tb3+ sample which is found to be higher than that of the similar reported orthophosphate phosphors, such as NaBaPO4:0.04Ce3+/0.15Tb3+ (78.8%),43 NaCaPO4 0.02 Ce3+/0.12Tb3+ (80%),44 Ba3Y(PO4)3:0.05Ce3+/0.45 Tb3+ (69.9%).45
Generally, two factors can be responsible for the resonant energy transfer mechanism: the exchange interaction and the multipolar interaction.
For the NZPO host, the critical concentration of the dopant (xc) and the critical separation between the activator and sensitizer (Rc) is calculated to be 0.06 and 20.46 Å respectively (eqn (1)). Rc value is in the same order as that reported for SrMgSi2O6 Ce3+/Tb3+ phosphors (19.52 Å).20 The Rc calculated value indicates the little possibility of exchange interaction since the exchange interaction is only for about 5–10 Å. Therefore, we can infer the energy transfer mechanism from Ce3+ to Tb3+ ions are likely to be electric multipolar interactions.20,46
According to the Dexter energy transfer and Readfield's approximation, the energy transfer formula for multipolar interactions can be written as:47,48
 | (6) |
The values for n = 6, 8, 10 are attributed to dipole–dipole, dipole-quadrupole, and quadrupole–quadrupole interactions, respectively.
The relationship curves between ID0/ID and Cn/3 are shown in Fig. 14, and the energy transfer model can be judged by comparing the R factors during the linear fitting. It can be inferred that the dipole–dipole interaction is the main energy transfer model between Ce3+ and Tb3+ ions in the NZPO host which is consistent with the bibliographic results.20,31,49,50
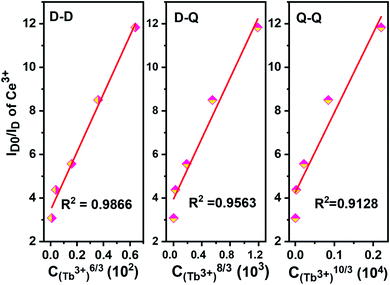 | ||
| Fig. 14 Dependence of ID0/ID of Ce3+ in NZPO:0.05Ce3+/yTb3+ (y = 0.01, 0.02, 0.04, 0.06, 0.08) phosphors. | ||
Schematic diagram of energy transfer
The schematic diagram of the energy levels of Ce3+ and Tb3+ with the possible optical transition involved in the energy transfer processes is presented in Fig. S6.† For the NZPO:Ce3+/Tb3+ phosphor, the electrons in excited states promote to the excited state of the Tb3+ 5d level (energy transfer process), which is attributed to the large overlap between the 4f → 4f transition of Tb3+ and the 5d–4f transition of Ce3+. The electrons in the Tb3+ 5d level relax to the 5D4 and 5D3 levels, and then the electrons return to 7FJ (J = 0–6) levels with multiple peaks. However, in this host there are only four peaks that are assigned to 5D4 → 7FJ (J = 3, 4, 5, 6), and the other peaks do not appear. This result can be explained by the cross-relaxation with non-radiative transitions from 5D3 to 5D4 states. Finally, the exciting Tb3+ ions return to their ground state with subsequent emission of green luminescence.Commission internationale de l'eclairage (CIE) 1931 diagram
In general, color can be expressed by means of color coordinates and the CIE 1931, which is a two-dimensional graphical representation of any color perceptible by the human eye on an x–y plot. According to the PL spectrum, under 285 nm excitation, Commission International de Eclarite (CIE) chromaticity coordinates of the samples are presented in Fig. 15 and summarized in Table S4.†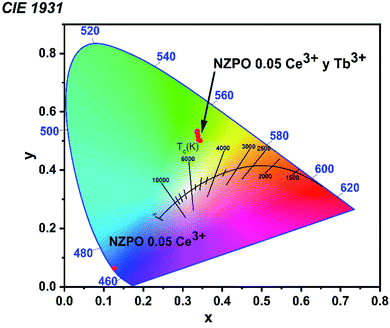 | ||
| Fig. 15 CIE 1931 color coordinates corresponding to the NZPO:0.05Ce3+/yTb3+ (y = 0.00, 0.01, 0.02, 0.04, 0.06 and 0.08) phosphors. | ||
We noticed that the singly Ce3+ doped NZPO sample shows dark blue emission under UV excitation. However, 0.05 Ce3+ /0.01Tb3+ co-doped NZPO sample shows green emission. The CIE chromaticity coordinate of NZPO:0.05Ce3+/0.01Tb3+ phosphor is determined to be (0.3149, 0.5652) which is closer to the commercial phosphor MgAl11O19:0.67Ce3+/0.33Tb3+ (0.330, 0.595). It is found that NZPO:0.05Ce3+/0.01Tb3+ shows intense green light suggesting that it can be used as a potential green-emitting candidate for the lighting field.
Conclusions
In summary, a new series of Ce3+, Tb3+ singly doped and Ce3+/Tb3+ co-doped NaZnPO4 (NZPO) phosphors were successfully prepared via the conventional high-temperature solid-state reaction. XRD results and Rietveld refinement analysis show that NZPO:Ce3+, Tb3+ crystallized in a monoclinic structure with P21/n (14) space group. The photoluminescence spectra of NZPO:Ce3+ phosphors exhibited broad emission in the 300–380 nm range with a peak maximum at 341 nm. The photoluminescence emission spectrum of Tb3+ singly doped NZPO shows several sharp peaks at 488, 543, 585, and 622 nm related to 4f–4f transitions. Additionally, the dominant green emission band around 543 nm has a full width at half-maximum (FWHM) only about 10 nm. The ET from Ce3+ to Tb3+ in the NZPO host was studied in detail. The Tb3+ green emission was significantly enhanced almost 20 times via energy transfer from Ce3+ to Tb3+. The ET mechanisms of Ce3+ to Tb3+ has been determined to be a resonant type by electric dipole–dipole interaction, and the energy transfer efficiency reached a maximum of 91% for NZPO:0.05 Ce3+/0.08Tb3+. This phosphor can be efficiently excited via 285 nm excitation to emit intense green light. These resultants demonstrate that the NZPO:Ce3+/Tb3+ phosphors are very promising as green-emitting phosphors for lighting applications.Conflicts of interest
There are no conflicts to declare.References
- C. C. Lin and R.-S. Liu, J. Phys. Chem. Lett., 2011, 2, 1268–1277 CrossRef CAS.
- X. Huang, Nature Photon, 2014, 8, 748–749 CrossRef CAS.
- E. M. Chan, Chem. Soc. Rev., 2015, 44, 1653–1679 RSC.
- G. Li, Y. Tian, Y. Zhao and J. Lin, Chem. Soc. Rev., 2015, 44, 8688–8713 RSC.
- G. R. Dillip and B. Deva Prasad Raju, J. Alloys Compd., 2012, 540, 67–74 CrossRef CAS.
- L. Zhao, Y. Liu, C. Zhai, F. Liao and Y. Gao, J. Alloys Compd., 2017, 694, 721–725 CrossRef CAS.
- G. S. Ningombam, N. S. Khundrakpam, D. S. Thiyam, R. S. Ningthoujam and N. R. Singh, New J. Chem., 2020, 44, 4217–4228 RSC.
- M. Back, J. Ueda, J. Xu, K. Asami, L. Amidani, E. Trave and S. Tanabe, J. Phys. Chem. C, 2019, 123, 14677–14688 CrossRef CAS.
- M. Back, J. Ueda, M. G. Brik, T. Lesniewski, M. Grinberg and S. Tanabe, ACS Appl. Mater. Interfaces, 2018, 10, 41512–41524 CrossRef CAS.
- B. Zhang, S. Ying, S. Wang, L. Han, J. Zhang and B. Chen, Inorg. Chem., 2019, 58, 4500–4507 CrossRef CAS PubMed.
- J. Zhou, Q. Liu and Z. Xia, J. Mater. Chem. C, 2018, 6, 4371–4383 RSC.
- C. C. Lin, Z. R. Xiao, G.-Y. Guo, T.-S. Chan and R.-S. Liu, J. Am. Chem. Soc., 2010, 132, 3020–3028 CrossRef CAS PubMed.
- Q. Bai, P. Li, Z. Wang, S. Xu, T. Li and Z. Yang, RSC Adv., 2017, 7, 22301–22310 RSC.
- L. Mukhopadhyay and V. K. Rai, New J. Chem., 2017, 41, 7650–7661 RSC.
- H. Pan, X. Li, J. Zhang, L. Guan, H. Su and F. Teng, Mater. Lett., 2015, 155, 106–108 CrossRef CAS.
- X. Zhang, Y. Huang and M. Gong, Chem. Eng. J., 2017, 307, 291–299 CrossRef CAS.
- H. Chen and Y. Wang, Inorg. Chem., 2019, 58, 7440–7452 CrossRef CAS PubMed.
- Y. Ding, L. Wang, M. Xu, D. Jia and R. Zhou, J. Am. Ceram. Soc., 2017, 100, 185–192 CrossRef CAS.
- M. Xu, L. Wang, D. Jia and H. Zhao, Phys. Chem. Chem. Phys., 2015, 17, 28802–28808 RSC.
- X. Fu, L. Fang, S. Niu and H. Zhang, J. Lumin., 2013, 142, 163–166 CrossRef CAS.
- L. Mukhopadhyay and V. K. Rai, AIP Conf. Proc., 2018, 1953(1), 060021 CrossRef.
- L. Mukhopadhyay and V. K. Rai, New J. Chem., 2018, 42, 13122–13134 RSC.
- L. Elammari, J. Durand, L. Cot and B. Elouadi, Z. Kristallogr. Cryst. Mater, 1987, 180, 131–140 Search PubMed.
- G. Dong, X. Li, H. Pan, H. Ma, S. Zhao, L. Guana, P. Duan, N. Fu, C. Liu and X. Lia, J. Lumin., 2019, 206, 260–266 CrossRef CAS.
- X. W. Wang, J. G. Chen, Y. W. Tian, X. E. Wang, B. H. Zhang and X. H. Chang, Solid State Ionics, 2016, 296, 85–89 CrossRef CAS.
- B. Wang, R. Mi, Y. Liu, M. Yu, Z. Huang and M. Fang, Dalton Trans., 2019, 48, 11791–11802 RSC.
- M. Xia, X. Wu, Y. Zhong, H. T. Hintzen, Z. Zhou and J. Wang, J. Mater. Chem. C, 2019, 7, 2927–2935 RSC.
- I. L. Botto and M. Vassallo, J. Mater. Sci. Lett., 1989, 8, 1336–1337 CrossRef CAS.
- G. Blasse and B. C. Grabmaier, in Luminescent Materials, Springer Berlin Heidelberg, Berlin, Heidelberg, 1994, pp. 10–32 Search PubMed.
- G. Blasse, J. Solid State Chem., 1986, 62, 207–211 CrossRef CAS.
- G. Li, Y. Wang, W. Zeng, W. Chen, S. Han, H. Guo and Y. Li, J. Mater. Chem. C, 2016, 4, 3304–3312 RSC.
- L. G. Van Uitert, J. Electrochem. Soc., 1967, 114, 1048 CrossRef CAS.
- R. Naik, S. C. Prashantha, H. Nagabhushana, S. C. Sharma, B. M. Nagabhushana, H. P. Nagaswarupa and H. B. Premkumar, Sens. Actuators, B, 2014, 195, 140–149 CrossRef CAS.
- Z. Li, B. Zhong, Y. Cao, S. Zhang, Y. Lv, Z. Mu, Z. Hu and Y. Hu, J. Alloys Compd., 2019, 787, 672–682 CrossRef CAS.
- Z. Yahiaoui, M. A. Hassairi, M. Dammak, E. Cavalli and F. Mezzadri, J. Lumin., 2018, 194, 96–101 CrossRef CAS.
- D. Geng, G. Li, M. Shang, C. Peng, Y. Zhang, Z. Cheng and J. Lin, Dalton Trans., 2012, 41, 3078 RSC.
- L. Sun, B. Devakumar, J. Liang, S. Wang, Q. Sun and X. Huang, J. Mater. Chem. C, 2019, 7, 10471–10480 RSC.
- X. Hu, J. Fan, T. Li, D. Zhang, J. Bai, Z. Ren and X. Hou, Chin. Sci. Bull., 2007, 52, 444–449 CrossRef CAS.
- L. Zhiqi, R. Le, Z. Zhaowu, C. Dali, Z. Na, L. Minglai, C. Meisheng and H. Xiaowei, J. Rare Earths, 2006, 24, 137–140 CrossRef.
- D. L. Dexter, J. Chem. Phys., 1953, 21, 836–850 CrossRef CAS.
- G. Blasse, J. Solid State Chem., 1986, 62, 207–211 CrossRef CAS.
- X. Zhang, L. Zhou, Q. Pang, J. Shi and M. Gong, J. Phys. Chem. C, 2014, 118, 7591–7598 CrossRef CAS.
- J. Sun, X. Zhang, Z. Xia and H. Du, J. Electrochem. Soc., 2011, 158, J368 CrossRef CAS.
- N. Guo, Y. Song, H. You, G. Jia, M. Yang, K. Liu, Y. Zheng, Y. Huang and H. Zhang, Eur. J. Inorg. Chem., 2010, 2010, 4636–4642 CrossRef.
- Y. Chen, W. Ding, P. Li, X. Li, Q. Bao, J. Liu, K. Qiu, X. Meng, Z. Yang and Z. Wang, RSC Adv., 2019, 9, 30406–30418 RSC.
- R. L. Tranquilin, L. X. Lovisa, C. R. R. Almeida, C. A. Paskocimas, M. S. Li, M. C. Oliveira, L. Gracia, J. Andres, E. Longo, F. V. Motta and M. R. D. Bomio, J. Phys. Chem. C, 2019, 123, 18536–18550 CrossRef CAS.
- Y. Zhu, Y. Liang, M. Zhang, M. Tong, G. Li and S. Wang, RSC Adv., 2015, 5, 98350–98360 RSC.
- P. A. Tanner, L. Zhou, C. Duan and K.-L. Wong, Chem. Soc. Rev., 2018, 47, 5234–5265 RSC.
- J. Li, X. Zhou, J. Ding, X. Zhou and Y. Wang, J. Mater. Chem. C, 2019, 7, 2257–2266 RSC.
- B. Han, J. Zhang and Y. Lü, J. Am. Ceram. Soc., 2013, 96, 179–183 CrossRef CAS.
Footnote |
| † Electronic supplementary information (ESI) available. See DOI: 10.1039/d0ra04163g |
| This journal is © The Royal Society of Chemistry 2020 |

