DOI:
10.1039/D0RA04303F
(Paper)
RSC Adv., 2020,
10, 35265-35272
Co1−xBaxFe2O4 (x = 0, 0.25, 0.5, 0.75 and 1) nanoferrites as gas sensor towards NO2 and NH3 gases
Received
14th May 2020
, Accepted 2nd August 2020
First published on 23rd September 2020
Abstract
Co1−xBaxFe2O4 (x = 0, 0.25, 0.5, 0.75 and 1) nanoferrites were synthesized using a controlled chemical co-precipitation technique. Their structural, optical, dielectric and gas sensing properties were characterized by X-ray diffractometry, UV-Vis spectroscopy and an LCR meter with a gas sensing unit. The crystalline sizes were estimated using the Scherrer formula and were found to be 7.8 nm, 14.4 nm, 21.8 nm, 16.5 nm and 30.3 nm for x = 0, 0.25, 0.5, 0.75 and 1, respectively. The fundamental optical band gaps were calculated by extrapolating the linear part of (αhυ)2 vs. hυ of the synthesized nanoferrites. The SEM and EDX spectra also confirmed the formation of nanoferrites. Dramatic behavior was observed in the dielectric constant and dissipation factor with varying temperature, which provides a substantial amount of information about electric polarization. The synthesized nanoferrites were tested towards NO2 and NH3 gases. The order of sensitivity (%) towards NH3 was analyzed as x = 0.75 > x = 0.5 > x = 0.25 > x = 0 > x = 1, while the order was x = 0 > 0.75 > 1 > 0.5 > 0.25 for NO2 gas.
1. Introduction
Modern research to cultivate gas sensors and biosensor fabrication technology using nanoferrite materials is looking forward to artificial building blocks with combinations of two or more different types of nanoferrites.1,2 The choice of specific nanoferrites in a definite molar ratio may enhance the physical and chemical properties of new developed architectures at the atomic scale. The synthesis of nanoferrites is readily accomplished by “bottom up” approaches such as sol–gel, chemical co-precipitation, hydrothermal, and micro-emulsion techniques.3 The size of the nanoferrites plays a vital role in sensing technology. Their sensing properties can be enhanced by varying several physical parameters, such as temperature, time, and pressure, and chemical parameters, such as molar ratio, concentration, and the nature of the reaction.4 Nanoferrites are very promising materials for gas sensing properties because of their normal and inverse spinel structures and high physical and chemical stability in open atmosphere.
Prasad et al.5 synthesized CoFe2O4 fiber using the electrospinning method and characterized its structural, morphological and magnetic properties. They applied the CoFe2O4 fiber as a sensing material for ammonia gas at room temperature with a very small concentration of ammonia (at 25 ppm) rather than other test gases, such as acetone, ethanol, 2-propanol and methanol. Zhang et al.6 studied the formation of CoFe2O4 nanoparticles using modified solvothermal and microwave-assisted solvothermal methods and found higher sensitivity towards acetone vapor at 200 °C with low concentrations up to 5 ppm. Bodade et al.7 reported the preparation of CoFe2O4 doped with different wt% of Ni and Sm using a sol–gel citrate method and its structural, morphological and electrical properties. They found that the 10 wt% Ni and 0.2 wt% Sm doped CoFe2O4 showed higher sensitivity and selectivity towards H2S gas than other reducing gases. Khan et al.8 studied the synthesis of CoFe2O4/SiC nanocomposites by a chemical co-precipitation method with various wt% of SiC. They found that the dielectric properties, a.c. conductivity and sensitivity (%) for NH3 gas were higher for 20 wt% of CFO/SiC nanocomposites than for nanocomposites with other wt%. Khandekar et al.9 reported the preparation of nanocrystalline CoFe2−xCexO4 ferrites (x = 0, 0.04, 0.08) by a molten salt method; they observed that at x = 0.04, the CoFe2−xCexO4 ferrites showed excellent sensitivity and selectivity towards acetone gas at 250 °C.
Karmakar et al.10 reported the formation of barium hexaferrites by a solid state method and their properties. They also reported the sensing properties of barium hexaferrites towards volatile organic compounds such as acetone and ethanol by varying the reaction temperature and gas concentration, and they found fast response for both vapors at a very low concentration (20 ppm). Peng et al.11 reported the synthesis of Bi1−xLaxFeO3 (x = 0–0.2) using a sol–gel method; they found it to be a prominent material for the fabrication of chemiresistive sensors, which showed the highest sensitivity and selectivity towards acetone gas. Sen et al.12 studied the development of BaCa2Fe16O27 hexaferrite by a simple sol–gel technique and observed that the BaCa2Fe16O27 hexaferrite sensor showed high sensitivity, good reproducibility, rapid response/recovery times and stability towards ethanol at 100 ppm compared to other volatile organic compounds such as acetone, methane and carbon monoxide gases.
Many ferrite nanoparticles13–18 have been tested towards reducing and toxic gases as gas sensors as well as towards contamination in food as biosensors;19 however, enhancement of the sensitivity, selectivity and lifetime of existing sensors is still an important issue. Ba-substituted cobalt ferrite at Co sites has not been reported in the literature to date. For this purpose, Co1−xBaxFe2O4 (x = 0, 0.25, 0.5, 0.75 and 1) nanoferrites have been synthesized by a chemical co-precipitation method at room temperature and tested towards NO2 and NH3 gases, including their structural, optical and dielectric properties as well as their a.c. conductivity. To the best of our knowledge, the developed Co1−xBaxFe2O4 nanoferrite at x = 0.75 is a novel combination of normal and inverse spinel ferrites with unique properties and has the highest sensitivity towards NO2 and NH3 gases at room temperature. The Co1−xBaxFe2O4 (x = 0, 0.25, 0.5, 0.75 and 1) nanoferrites may also show response towards coronavirus-2019 (COVID-19), which has become an epidemic disease.
2. Experimental details
Co1−xBaxFe2O4 (x = 0, 0.25, 0.5, 0.75 and 1) nanoferrites were synthesized by chemical co-precipitation. CoCl2·6H2O (CDH), BaCl2·2H2O (Fisher Scientific) and FeCl3·6H2O (Rankem) were used as precursors while maintaining a molar ratio of 1![[thin space (1/6-em)]](https://www.rsc.org/images/entities/char_2009.gif) :
:![[thin space (1/6-em)]](https://www.rsc.org/images/entities/char_2009.gif) 2 of Co/Ba
2 of Co/Ba![[thin space (1/6-em)]](https://www.rsc.org/images/entities/char_2009.gif) :
:![[thin space (1/6-em)]](https://www.rsc.org/images/entities/char_2009.gif) Fe. The combinations of aqueous solutions of CoCl2·6H2O with 1, 0.25, 0.5, 0.75 and 0 M and BaCl2·2H2O with 0, 0.75, 0.5, 0.25 and 1 M concentrations, respectively, were prepared in separate beakers, and prepared 2 M FeCl3·6H2O was added to form 5 separate complex mixtures. Further, the prepared complex mixtures were added dropwise to an alkaline solution of 0.8 M NaOH (CDH) under strong stirring with a uniform speed. The experiment was performed at room temperature. Stirring was continued for 30 minutes after the last drop of aqueous solution of the mixture was added to the alkaline medium. The precipitate was initially brown in color; after completion of the reaction, it became reddish brown. The precipitate was collected by centrifugation and washed four times to remove impurities, then dried for 1 hour at 200 °C. After drying, the Co1−xBaxFe2O4 (x = 0, 0.25, 0.5, 0.75 and 1) nanoferrites were ground with a mortar and pestle and sintered for 1 hour at 200 °C.
Fe. The combinations of aqueous solutions of CoCl2·6H2O with 1, 0.25, 0.5, 0.75 and 0 M and BaCl2·2H2O with 0, 0.75, 0.5, 0.25 and 1 M concentrations, respectively, were prepared in separate beakers, and prepared 2 M FeCl3·6H2O was added to form 5 separate complex mixtures. Further, the prepared complex mixtures were added dropwise to an alkaline solution of 0.8 M NaOH (CDH) under strong stirring with a uniform speed. The experiment was performed at room temperature. Stirring was continued for 30 minutes after the last drop of aqueous solution of the mixture was added to the alkaline medium. The precipitate was initially brown in color; after completion of the reaction, it became reddish brown. The precipitate was collected by centrifugation and washed four times to remove impurities, then dried for 1 hour at 200 °C. After drying, the Co1−xBaxFe2O4 (x = 0, 0.25, 0.5, 0.75 and 1) nanoferrites were ground with a mortar and pestle and sintered for 1 hour at 200 °C.
The structural and phase formation analysis of Co1−xBaxFe2O4 (x = 0, 0.25, 0.5, 0.75 and 1) nanoferrites were studied using a Bruker diffractometer, Model D8 Advance, with Cu Kα radiation in the range of 20° to 80° at a scan rate of 0.05° s−1 and a 40 kV operating voltage with 40 mA current. The optical properties were studied using a UV-visible spectrophotometer, Thermo Scientific Model BIOMAT 3S, in the range of 200 nm to 600 nm. Morphological and elemental analyses were performed by scanning electron microscopy (TESCAN MIRA) and energy dispersive X-ray studies (OXFORD XMAX). The dielectric properties were studied using a HIOKI LCR meter (IM3536) at different temperatures from 30 °C to 100 °C and a frequency range from 40 Hz to 8 MHz, and the gas sensing properties were investigated using a gas sensing setup with a temperature controller and LCR meter. A KBR hydraulic press was used to obtain pellets of the prepared nanocomposites with diameters of 10 mm and thicknesses of 2 mm. The disk-shaped pellets were coated on both sides with silver paste to endow the sides with conductivity and were connected with copper wire. Hence, parallel plate capacitor devices were designed.
3. Results and discussion
3.1 Structural properties
The XRD patterns of the Co1−xBaxFe2O4 (x = 0, 0.25, 0.5, 0.75 and 1) nanoferrites are exhibited in Fig. 1. It can be observed from Fig. 1(a and e) that synthesized nanoparticles at x = 0 and 1 can be identified as CoFe2O4 (JCPDS no. 00-022-1086) and BaFe2O4 (JCPDS no. 46-0113), which show pure single-phase cubic and orthorhombic structures, respectively. It is depicted in Fig. 1(b–d) that as the concentration increases from x = 0.25 to 0.75, the peaks of CoFe2O4 and BaFe2O4 appear in their correct positions at 2θ = 23.999°, 27.469°, 34.444°, 35.452°, 41.893°, 44.650°, 46.934° and 63.004°, which confirms the formation of Co1−xBaxFe2O4 (x = 0.25, 0.5 and 0.75) nanoferrites. The average particle size was calculated using the Scherrer formula:20| |
 | (1) |
where D is the particle size, λ is the X-ray wavelength, θ is Bragg's angle and β is the FWHM. The calculated particle sizes of the Co1−xBaxFe2O4 (x = 0, 0.25, 0.5, 0.75 and 1.0) nanoferrites were 7.8 nm, 14.4 nm, 21.8 nm, 16.5 nm and 30.3 nm, respectively.
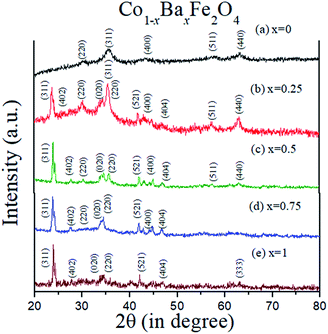 |
| | Fig. 1 XRD patterns of the Co1−xBaxFe2O4 (x = 0, 0.25, 0.5, 0.75 and 1) nanoferrites. | |
3.2 Optical properties
The optical absorbance spectra of the Co1−xBaxFe2O4 (x = 0, 0.25, 0.5, 0.75 and 1) nanoferrites are illustrated in Fig. 2. It can be observed from Fig. 2 that the fundamental absorption edges of the Co1−xBaxFe2O4 (x = 0, 0.25, 0.5, 0.75 and 1) nanoferrites were found to be approximately 215 ± 2 nm, 215 ± 2 nm, 217 ± 2 nm, 216 ± 2 nm and 236 ± 2 nm, respectively. For the photon energies E, the absorbance can be calculated by the given formula:21| |
 | (2) |
where α is the absorbance, A is a constant, Eg is the energy band gap, h is the Planck constant and υ is the frequency of light.
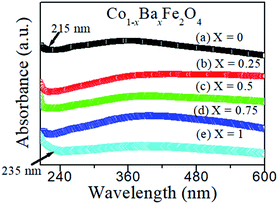 |
| | Fig. 2 Optical absorbance spectra of the Co1−xBaxFe2O4 (x = 0, 0.25, 0.5, 0.75 and 1) nanoferrites. | |
The obtained optical band gaps (Eg) from an extrapolation of the linear region of the plot of (αhυ)2 vs. hυ at different concentrations of Ba2+ ion (x = 0, 0.25, 0.5, 0.75 and 1) in the Co1−xBaxFe2O4 nanoferrites are illustrated in Fig. 3. The optical band gap (Eg) values of the Co1−xBaxFe2O4 (x = 0, 0.25, 0.5, 0.75 and 1) nanoferrites were found to be 3.48 eV, 3.15 eV, 3.45 eV, 3.65 eV and 4.01 eV, respectively. The changes in the optical band gap are due to the substitution of Ba2+ ions at the positions of the Co2+ ions with increasing concentration of Ba2+ ions from x = 0 to x = 1. CoFe2O4 and BaFe2O4 nanoferrites possess indirect energy band gaps. The intense hybridized Co + O and Ba + O valance edges allow both Op → Cod and Cod → Cod transitions in CoFe2O4 nanoferrites and Op → Bas and Bas → Bas transitions in BaFe2O4 nanoferrites. Consequently, the localized Co and Ba states near the valence band edge can create inter-site d → d and s → s excitations, analogous to the transitions of the p → d and p → s sub orbitals. Transitions in the marginal channels (Co + O → Fe (Oh)) and (Ba + O → Fe (Oh)) separately and transitions between both channels define the fundamental indirect band gap and absorption edge.22 From Fig. 3, it can be observed that the fundamental band gaps of pure CoFe2O4 and BaFe2O4 are 3.48 eV and 4.01 eV, respectively. As the doping of Ba2+ ions into CoFe2O4 nanoferrites increased at x = 0.25, 0.5 and 0.75, the calculated band gaps were found to be 3.15 eV, 3.45 eV and 3.65 eV, respectively. The enrichment in the band gap with increasing concentration of Ba2+ ions may be due to the quantum confinement effect in the nano range.
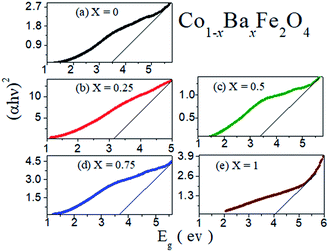 |
| | Fig. 3 Optical band gaps of the Co1−xBaxFe2O4 (x = 0, 0.25, 0.5, 0.75 and 1) nanoferrites. | |
3.3 Morphological and elemental analysis
The morphologies of the Co1−xBaxFe2O4 (x = 0, 0.25, 0.5, 0.75 and 1) nanoferrites were investigated using SEM, and the micrographs are shown in Fig. 4(a–e). Clusters of nanoparticles were observed in all the micrographs. The effects of the BaFe2O4 nanoparticles can be clearly seen in Fig. 4(b–d). The EDX spectra of the Co1−xBaxFe2O4 (x = 0, 0.25, 0.5, 0.75 and 1) nanoferrites are depicted in Fig. 5(a–e). The energy dispersive X-ray data revealed the formation of Co1−xBaxFe2O4 (x = 0, 0.25, 0.5, 0.75 and 1) nanoferrites with high purity. It can be observed from Fig. 4 and 5 that as the concentration increases, the substitution of Co2+ by Ba2+ increases.
 |
| | Fig. 4 SEM images of the Co1−xBaxFe2O4 (x = 0, 0.25, 0.5, 0.75 and 1) nanoferrites. | |
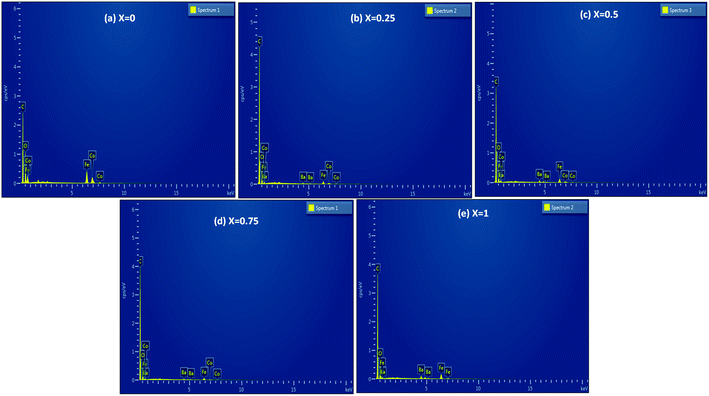 |
| | Fig. 5 EDX spectra of the Co1−xBaxFe2O4 (x = 0, 0.25, 0.5, 0.75 and 1) nanoferrites. | |
3.4 Dielectric properties
The dielectric properties were investigated over the fabricated capacitor devices using the formula:23| |
 | (3) |
where εr is the dielectric constant of the sample, ε0 is the permittivity of free space, C is the capacitance of the capacitor, t is the thickness of the pellet and A is the area of the pellet.
The dielectric constants as a function of frequency with varying temperatures from 30 °C to 100 °C of Co1−xBaxFe2O4 (x = 0, 0.25, 0.5, 0.75 and 1) are illustrated in Fig. 6(a–e). It can be observed from Fig. 6 that the dielectric constant decreases gradually as the frequency increases up to 0.5 MHz and then becomes almost constant upon increasing the frequency from 0.5 MHz to 8 MHz for all compositions; this is because at high frequency, the dipoles stop their orientation in the direction of the applied field, due to which the polarization vanishes.24 It can also be observed from Fig. 6(a–e) that as the temperature increases from 30 °C to 40 °C, the value of the dielectric constant increases in all compositions except x = 1 and decreases with increasing temperature from 40 °C to 100 °C. For x = 1, the values of the dielectric constant are very similar at 30 °C and 50 °C, while the value of dielectric is lower at other temperatures. This may be because of the normal spinel structure of BaFe2O4. The charge carrier mobility increases with increasing temperature up to 40 °C and 50 °C in the cases of inverse and normal spinel structures, respectively. Upon further increase in temperature, the anisotropy increases because of rearrangement of the dipoles in the direction of the electric field, due to which the dielectric polarization starts to decrease; this results in a low dielectric constant.
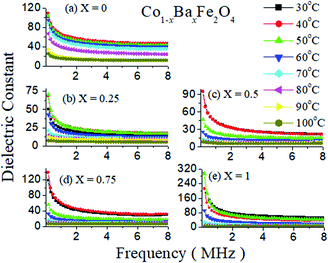 |
| | Fig. 6 Dielectric constants as a function of frequency of the Co1−xBaxFe2O4 (x = 0, 0.25, 0.5, 0.75 and 1) nanoferrites. | |
Furthermore, Fig. 6(a and e) show the dielectric studies of pure CoFe2O4 and BaFe2O4, which have maximum dielectric constant values of 108 and 210, respectively, at a temperature of 30 °C. The dielectric constant decreases at x = 0.25 and starts to increase with increasing concentration up to x = 1. This dramatic change in the dielectric constant may occur due to the mixed inverse and normal spinel structures of the prepared nanoferrites. The reason for the increase in the dielectric constant may be the exchange of electrons and holes in n-type and p-type ferrite, i.e. doping of Ba2+ in CoFe2O4 at large concentrations enhances the exchange of electrons in Fe3+ and converts it to Fe2+ with hole transfer from Co3+ to Co2+. These electron–hole exchange phenomena increase the polarization in the nanoferrites, which increases the value of the dielectric constant.24
The dissipation factor is also an important characteristic feature of dielectric materials. The dissipation factors as a function of frequency of the Co1−xBaxFe2O4 (x = 0, 0.25, 0.5, 0.75 and 1) nanoferrites at different temperatures from 30 °C to 100 °C are shown in Fig. 7(a–e). It can be observed from Fig. 7(a–e) that the dissipation factor decreases as the frequency increases up to 1 MHz and then becomes constant from 1 MHz to 8 MHz in all compositions. Consequently, very interesting behavior of the dissipation factor can be found with varying temperature in Fig. 7. The dissipation factor is larger at higher temperatures (except 100 °C) in the entire frequency range for x = 0 and it decreases sequentially (except at 50 °C) on increasing temperature for x = 1. The dissipation factor is similar but higher at 40 °C to 50 °C for x = 0.25 compared to a temperature of 30 °C, while it is almost the same at 30 °C and 40 °C for x = 0.5 and x = 0.75. As the concentration of Ba2+ ion increases towards the Co2+ sites in CoFe2O4, the dissipation factor simultaneously decreases with increasing temperature and becomes almost constant at 100 °C. Therefore, all dielectric experiments were performed up to 100 °C.
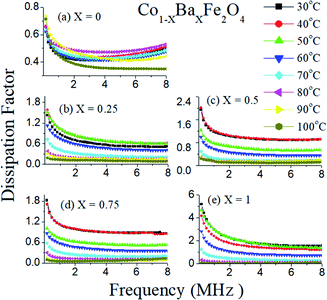 |
| | Fig. 7 Dissipation factors with frequency of the Co1−xBaxFe2O4 (x = 0, 0.25, 0.5, 0.75 and 1) nanoferrites at different temperature from 30 °C to 100 °C. | |
3.4.1 A.C. conductivity measurements. The a.c. conductivities of the Co1−xBaxFe2O4 (x = 0, 0.25, 0.5, 0.75 and 1) nanoferrites in the temperature range from 30 °C to 100 °C with the log of the frequency were calculated using the given formula:25| |
σa.c.(ω) = ωε0εrtan![[thin space (1/6-em)]](https://www.rsc.org/images/entities/char_2009.gif) δ δ
| (4) |
where σa.c.(ω) is the a.c. conductivity in the presence of the angular frequency, ω is the angular frequency, ε0 is the permittivity of free space, εr is the dielectric constant of the material and tan![[thin space (1/6-em)]](https://www.rsc.org/images/entities/char_2009.gif) δ is the dissipation factor of the material.
δ is the dissipation factor of the material.The a.c. conductivities as a function of log of frequency with temperature variation from 30 °C to 100 °C of the Co1−xBaxFe2O4 (x = 0, 0.25, 0.5, 0.75 and 1.0) nanoferrites are revealed in Fig. 8. It can be observed from Fig. 8 that the a.c. conductivity reaches a maximum at 30 °C and 40 °C for x = 0, 0.5 and 0.75, while it is higher at 30 °C and 50 °C for x = 0.25 and 1. On increasing the temperature up to 100 °C, the a.c. conductivity decreases in all the samples. It is also illustrated in Fig. 8 that at a lower frequency, the a.c. conductivity is smaller and almost constant; it increases with increasing frequency and possesses the highest value at 8 MHz in all compositions. This increment in the a.c. conductivity occurs, because on increasing frequency, the hopping mechanism increases at the atomic level.
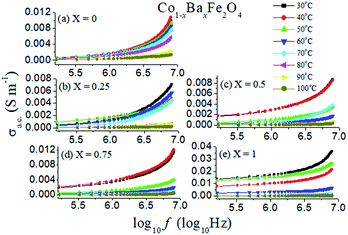 |
| | Fig. 8 A.C. conductivities of the Co1−xBaxFe2O4 (x = 0, 0.25, 0.5, 0.75 and 1) nanoferrites with varying temperature from 30 °C to 100 °C with log of frequency. | |
In a dielectric material, the total a.c. conductivity does not depend on the d.c. conductivity because there are few free charge carriers present. Hence, the amount of d.c. conductivity was found to be negligible. The total a.c. conductivity can be calculated by the given equation:25
where
A is the coefficient that defines the strength of polarizability,
f is a frequency applied by an instrument and
p is another coefficient which is calculated from the slope given by the straight-line equation:
25| |
log![[thin space (1/6-em)]](https://www.rsc.org/images/entities/char_2009.gif) σa.c. = log σa.c. = log![[thin space (1/6-em)]](https://www.rsc.org/images/entities/char_2009.gif) A + p A + p![[thin space (1/6-em)]](https://www.rsc.org/images/entities/char_2009.gif) log log![[thin space (1/6-em)]](https://www.rsc.org/images/entities/char_2009.gif) f f
| (6) |
The log of the a.c. conductivity of the Co1−xBaxFe2O4 (x = 0, 0.25, 0.5, 0.75 and 1) nanoferrites in the temperature range from 30 °C to 100 °C with the log of the frequency was investigated and is shown in Fig. 9. It can be analyzed from Fig. 9 that the plots of all the compositions at different temperatures are nearly parallel to each other. The values of the slope p are tabulated in Table 1. The value of the pre-exponent factor A varies from 10−4 to 10−11 with varying temperature of the Co1−xBaxFe2O4 (x = 0, 0.25, 0.5, 0.75 and 1) nanoferrites.
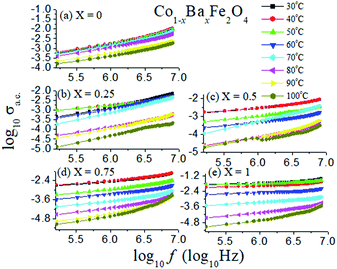 |
| | Fig. 9 Log of a.c. conductivity as a function of log of frequency in the temperature range from 30 °C to 100 °C of the Co1−xBaxFe2O4 (x = 0, 0.25, 0.5, 0.75 and 1) nanoferrites. | |
Table 1 Frequency exponent factor (slope p) and pre-exponent factor A for Co1−xBaxFe2O4 (x = 0, 0.25, 0.5, 0.75 and 1) nanoferrites at a different temperature range
| S. no. |
Co1−xBaxFe2O4 |
Temperature (in °C) |
p |
A |
| 1 |
x = 0 |
30 |
0.76758 |
4.07 × 10⁻⁸ |
| 2 |
40 |
0.76758 |
4.07 × 10⁻⁸ |
| 3 |
50 |
0.73017 |
6.98 × 10⁻⁸ |
| 4 |
60 |
0.73318 |
6.14 × 10⁻⁸ |
| 5 |
70 |
0.71656 |
7.26 × 10⁻⁸ |
| 6 |
80 |
0.70326 |
6.92 × 10⁻⁸ |
| 7 |
90 |
0.60521 |
1.38 × 10⁻⁸ |
| 8 |
100 |
0.65695 |
4.32 × 10⁻⁸ |
| 1 |
x = 0.25 |
30 |
0.73719 |
5.27 × 10⁻⁸ |
| 2 |
40 |
0.41409 |
5.68 × 10⁻⁶ |
| 3 |
50 |
0.4076 |
6.18 × 10⁻⁶ |
| 4 |
60 |
0.72509 |
5.23 × 10⁻⁸ |
| 5 |
70 |
0.83325 |
7.54 × 10⁻⁹ |
| 6 |
80 |
0.65284 |
1.63 × 10⁻⁸ |
| 7 |
90 |
0.72203 |
5.41 × 10⁻⁹ |
| 8 |
100 |
0.71339 |
2.55 × 10⁻⁹ |
| 1 |
x = 0.5 |
30 |
0.4548 |
5.40 × 10⁻⁶ |
| 2 |
40 |
0.44201 |
6.60 × 10⁻⁶ |
| 3 |
50 |
0.50137 |
1.03 × 10⁻⁶ |
| 4 |
60 |
0.52397 |
3.49 × 10⁻⁷ |
| 5 |
70 |
0.9176 |
1.66 × 10⁻⁹ |
| 6 |
80 |
0.82434 |
8.06 × 10⁻¹⁰ |
| 7 |
90 |
0.86706 |
4.50 × 10⁻¹⁰ |
| 8 |
100 |
0.68731 |
3.90 × 10⁻¹⁰ |
| 1 |
x = 0.75 |
30 |
0.03585 |
4.84 × 10⁻⁶ |
| 2 |
40 |
0.46617 |
6.20 × 10⁻⁶ |
| 3 |
50 |
0.53997 |
6.49 × 10⁻⁷ |
| 4 |
60 |
0.52384 |
4.12 × 10⁻⁷ |
| 5 |
70 |
0.60095 |
4.96 × 10⁻⁸ |
| 6 |
80 |
0.75514 |
2.23 × 10⁻⁹ |
| 7 |
90 |
0.96594 |
5.39 × 10⁻¹¹ |
| 8 |
100 |
1.17559 |
2.19 × 10⁻¹² |
| 1 |
x = 1 |
30 |
0.26896 |
4.20 × 10⁻⁴ |
| 2 |
40 |
0.2703 |
2.40 × 10⁻⁴ |
| 3 |
50 |
0.20723 |
8.80 × 10⁻⁴ |
| 4 |
60 |
0.27069 |
7.60 × 10⁻⁵ |
| 5 |
70 |
0.37035 |
3.43 × 10⁻⁶ |
| 6 |
80 |
0.68084 |
7.61 × 10⁻⁹ |
| 7 |
90 |
1.02869 |
1.70 × 10⁻¹¹ |
| 8 |
100 |
1.02078 |
1.80 × 10⁻¹¹ |
3.5 Gas sensing properties
3.5.1 Gas preparation. Oxidizing gas (NO2) was prepared by reacting Cu metal with concentrated NH4OH at 45 °C and was collected in a round bottom flask. Similarly, reducing gas (NH3) was obtained by heating liquid ammonia at 30 °C to 40 °C. The reaction mechanisms are given by relations (7) and (8):| |
 | (7) |
| |
 | (8) |
3.5.2 Gas sensing phenomenon. The phenomenon of gas sensitivity on the prepared nanoferrite devices can be demonstrated with the aid of the adsorption and desorption processes. The oxygen adsorbs on the sensing device in air atmosphere and desorbs in the presence of gases; this provides an electron, which can travel on the surface of the sensing material and causes a change in the resistance. The sensitivities of the test gases on the surface of the sensing device were calculated by the following relations:26| |
 | (9) |
| |
 | (10) |
where S (%) is the sensitivity of the test gas, ΔR is the change in resistance, Ra is the resistance of air and Rg is the resistance of the test gas.The fabricated capacitor device with the Co1−xBaxFe2O4 (x = 0, 0.25, 0.5, 0.75 and 1) nanoferrites, shown in Fig. 10, was tested towards NO2 and NH3 gases. The sensitivity (%) as a function of the flow rate in ppm (parts per million) is illustrated in Fig. 11. It can be observed from Fig. 11 that the composition x = 1 responded quickly at a low flow rate of NO2 gas, while the sensitivity (%) followed the sequence of x = 0 > x = 0.75 > x = 1 > x = 0.5 > x = 0.25 at a 220 ppm flow rate of NO2 gas. The responses of x = 0 and x = 1 towards NH3 gas were found to be 31.41% and 15.45%, as shown in Fig. 12, and the order was x = 0.75 > x = 0.5 > x = 0.25 > x = 0 > x = 1 towards NH3 gas at a 220 ppm flow rate. The composition with x = 0.75 exhibited the highest sensitivity (67.18%) for NH3 gas and (79.17%) for NO2 gas at a 220 ppm flow rate. The value of the resistance decreased in all compositions towards NH3 gas from flow rates of 10 ppm to 220 ppm; therefore, it can be said that the all synthesized nanoferrites behave like n-type semiconductors in an NH3 gas environment. The same behavior was demonstrated by all nanoferrites except for the composition with x = 1 towards NO2 gas. NO2 is a strong oxidizing agent with higher electrophilic properties; therefore, it adsorbs faster on the surface of BaFe2O4, even in the absence of oxygen. The reaction mechanism is given in eqn (11) and (12).27,28 The oxidation of NO2 leads to the reduction of conduction electrons in the conduction band, which increases the resistance of Co1−xBaxFe2O4 at x = 1.29 Eqn (13) describes how NO2 is directly adsorbed on the Ba2+ sites by electron capture and desorbed as NO.
| | |
NO2(gas) + e(surface)− → NO2(adsorbed)−
| (11) |
| | |
NO2(gas) + O2(adsorbed)− + 2e(surface)− → NO2(adsorbed)− + 2O(adsorbed)−
| (12) |
| |
 | (13) |
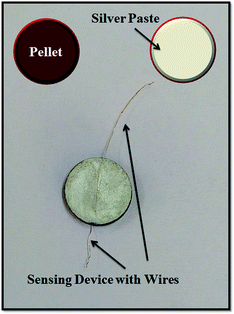 |
| | Fig. 10 Image of the gas sensing device. | |
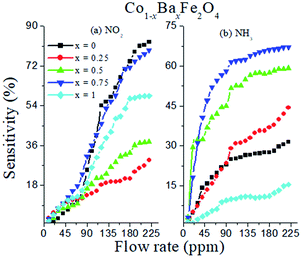 |
| | Fig. 11 Sensitivity (%) as a function of flow rate (ppm) of the Co1−xBaxFe2O4 (x = 0, 0.25, 0.5, 0.75 and 1) nanoferrites towards NO2 and NH3 gases. | |
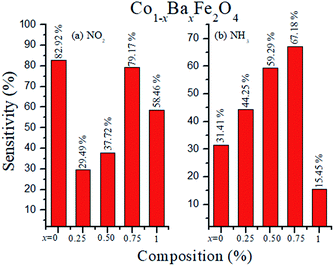 |
| | Fig. 12 Selectivity (%) of the Co1−xBaxFe2O4 (x = 0, 0.25, 0.5, 0.75 and 1) nanoferrites towards (a) NO2 and (b) NH3 gases. | |
It can be observed from Fig. 11 that at a higher flow rate (220 ppm), the sensitivity (%) becomes constant; this is because of the complete adsorption and desorption process between the surface oxygen and inlet (NO2 and NH3) gases. Therefore, the experiment was performed up to a 220 ppm flow rate.
The sensitivity (%) of the Co1−xBaxFe2O4 (x = 0, 0.25, 0.5, 0.75 and 1) nanoferrites towards NO2 and NH3 gases is depicted in Fig. 12, which indicates that Co1−xBaxFe2O4 showed the best response at x = 0.75 for both gases; the order was found to be NO2 > NH3 at room temperature. The sensitivity (%) and selectivity responses suggest that Co1−xBaxFe2O4, at x = 0.75 is a promising material as a sensor towards NO2 gas.
3.6 COVID-19 detection
The synthesized Co1−xBaxFe2O4 (x = 0, 0.25, 0.5, 0.75 and 1) nanoferrites possess combined properties of inverse and normal spinel structures. Hence, those nanoferrites may act as proficient sensors for COVID-19, which has emerged as a worldwide epidemic disease. For this purpose, the DNA receptors of coronavirus could be implanted on the surface of the above designed gas sensing device; those are produced artificially and matched with the RNA sequences of the coronavirus. The fabricated device could detect the presence of COVID-19 because of the complementary sequences of the virus receptor.30 The response of the fabricated device towards COVID-19 can be measured in terms of sensitivity (%). Further testing is needed with permission of the government.
4. Conclusions
In this research article, Co1−xBaxFe2O4 (x = 0, 0.25, 0.5, 0.75 and 1) nanoferrites were synthesized successfully. The calculated particle sizes were estimated to be 7.8 nm, 14.4 nm, 21.8 nm, 16.5 nm and 30.3 nm for the Co1−xBaxFe2O4 (x = 0, 0.25, 0.5, 0.75 and 1) nanoferrites, respectively. Optical absorbance of all the synthesized nanoferrites was obtained in the ultra-violet region. Hence, these nanoferrites can be used as UV absorbers. The energy band gaps were also calculated using the UV-Vis spectra and were found to be 3.48 eV, 3.15 eV, 3.45 eV, 3.65 eV and 4.01 eV, respectively. The SEM and EDX spectra also confirmed the formation of the nanoferrites. The temperature-varying dielectric constants and dissipation factors as a function of frequency provide abundant information about the electric polarization due to the mixture of inverse and normal spinel structures, which affects the gas sensing properties towards reducing gas (NH3) and oxidizing gas (NO2) at room temperature. The a.c. conductivity by varying the log frequency with the frequency exponent factor p and pre-exponent factor A was also illustrated. The sensitivity (%) as a function of flow rate (ppm) was tested towards NO2 and NH3 gases. The orders of sensitivity (%) were determined to be x = 0 > x = 0.75 > x = 1 > x = 0.25 > x = 0.5 for NO2 gas and x = 0.75 > x = 0.5 > x = 0.25 > x = 0 > x = 1 for NH3 gas at a 220 ppm flow rate. Co1−xBaxFe2O4 at x = 0.75 showed the best response for both gases, and the order was found to be NO2 > NH3 at room temperature. The optical properties, dielectric properties, sensitivity (%) and selectivity responses suggest that Co1−xBaxFe2O4 at x = 0.75 is the most promising material for sensors towards NO2 gas. Due to their effective response towards gases, nanoferrites may detect COVID-19 as well, for which further study is needed.
Conflicts of interest
There is no any conflict of interest.
Acknowledgements
The authors are thankful to the Science and Engineering Research Board (Project no. EMR/2016/002156) and University Grant Commission, Department of Atomic Energy, Consortium for Scientific Research, Indore (Project no.-CSR-IC/MSRSR-10/CRS-218/2017-18/1299) for providing funds.
References
- S. L. Hu, J. Liu, H. Y. Yu and Z. W. Liu, J. Magn. Magn. Mater., 2019, 473, 79–84, DOI:10.1016/j.jmmm.2018.10.044.
- H. Pawar, D. Kumar, D. Rathore and U. K. Dwivedi, Appl. Innov. Res., 2019, 1, 75–77 Search PubMed.
- M. Khan, H. Pawar, M. Kumari, D. Rathore and U. K. Dwivedi, Appl. Innov. Res., 2019, 1, 93–95 Search PubMed , http://nopr.niscair.res.in/handle/123456789/49574.
- D. Rathore, R. Kurchania and R. K. Pandey, Invertis Journal of Science and Technology, 2012, 5, 132–137, DOI:10.1109/JSEN.2015.2432035.
- P. D. Prasad and J. Hemalatha, J. Magn. Magn. Mater., 2019, 484, 225–233, DOI:10.1016/j.jmmm.2019.04.026.
- H. J. Zhang, L. Z. Liu, X. R. Zhang and F. N. Meng, J. Alloys Compd., 2019, 788, 1103–1112, DOI:10.1016/j.jallcom.2019.03.009.
- A. B. Bodade, A. B. Bodade, H. G. Wankhade, G. N. Chaudhari and D. C. Kothari, Talanta, 2012, 89, 183–188, DOI:10.1016/j.talanta.2011.12.013.
- M. Khan, H. Pawar, M. Kumari, C. Patra, G. Patel, U. K. Dwivedi and D. Rathore, J. Alloys Compd., 2020, 840, 155596, DOI:10.1016/j.jallcom.2020.155596.
- M. S. Khandekar, N. L. Mulla, I. Suryavasnshi and S. S. Suryavanshi, Ceram. Int., 2014, 40, 447–452, DOI:10.1016/j.ceramint.2013.06.021.
- M. Karmakar, B. Mondal, M. Pal and K. Mukharjee, Sens. Actuators, B, 2014, 190, 627–633, DOI:10.1016/j.snb.2013.09.035.
- S. Peng, M. Ma, W. Yang, Z. Wang, J. Bi and J. Wu, Sens. Actuators, B, 2020, 313, 128060, DOI:10.1016/j.snb.2020.128060.
- S. Sen, P. Anand, M. Narjinary, S. K. Md Mursalin and R. Manna, Ceram. Int., 2016, 42, 12581–12585, DOI:10.1016/j.ceramint.2016.03.201.
- D. Rathore, R. Kurchania and R. K. Pandey, J. Mater. Sci.: Mater. Electron., 2018, 29, 1925–1932, DOI:10.1007/s10854-017-8102-0.
- D. Rathore and S. Mitra, J. Appl. Phys., 2016, 1728, 20166, DOI:10.1063/1.1713501.
- D. Rathore, R. Kurchania and R. K. Pandey, IEEE Sens. J., 2015, 15, 4961–4966, DOI:10.1109/JSEN.2015.2432035.
- D. Rathore, R. Kurchania and R. K. Pandey, Sens. Actuators, A, 2013, 199, 236–240, DOI:10.1016/j.sna.2013.06.002.
- A. A. Bagade, V. V. Ganbavle, S. V. Mohite, T. D. Dongale, B. B. Sinha and K. Y. Rajpure, J. Colloid Interface Sci., 2017, 497, 181–192, DOI:10.1016/j.jcis.2017.02.067.
- M. Dewan and S. B. Majumder, Materialia, 2019, 7, 100363, DOI:10.1016/j.mtla.2019.100363.
- P. Singh and D. Rathore, J. Appl. Phys., 2016, 1728, 20259, DOI:10.1063/1.4946310.
- R. Kurchania, D. Rathore and R. K. Pandey, J. Mater. Sci.: Mater. Electron., 2015, 26, 9355–9365, DOI:10.1007/s10854-015-3083-3.
- M. Abdelaziz and M. M. Ghannam, Phys. B, 2010, 405, 958–964, DOI:10.1016/j.physb.2009.10.030.
- B. S. Holinsworth, D. Mazumdar, H. Sims, Q. C. Sun, M. K. Yurtisigi, S. K. Sarker, A. Gupta, W. H. Butler and J. L. Musfeldt, Appl. Phys. Lett., 2013, 103, 082406, DOI:10.1063/1.4818315.
- B. D. Cullity, Element of X-Ray Diffraction, Addison-Wesley Series in Metallurgy and Materials, London, New York, 2nd edn, 1978 Search PubMed.
- D. Rathore, R. Kurchaniya and R. K. Pandey, Int. J. Miner., Metall. Mater., 2014, 21, 408–414, DOI:10.1007/s12613-014-0923-8.
- D. Rathore, R. Kurchania and R. K. Pandey, J. Nanosci. Nanotechnol., 2013, 13, 1812–1819, DOI:10.1166/jnn.2013.7120.
- D. Rathore, S. Mitra, R. Kurchania and R. K. Pandey, J. Mater. Sci.: Mater. Electron., 2018, 29, 1925–1932, DOI:10.1007/s10854-017-8102-0.
- P. Shankar and J. B. B. Rayappan, Sci. Lett. J., 2015, 4, 126 Search PubMed.
- C. Lopez Baroni and J. M. Tulliani, Materials, 2013, 6, 4801–4816, DOI:10.3390/ma6104801.
- T. Akamatsu, T. Itoh, N. Izu and W. Shin, Sens. Mater., 2013, 13, 12467–12481, DOI:10.3390/s130912467.
- G. Qiu, Z. Gai, Y. Tao, J. Schmitt, G. A. Kullak-Ublick and J. Wang, Dual-Functional Plasmonic Photothermal Biosensors for Highly Accurate Severe Acute Respiratory Syndrome Coronavirus 2 Detection, ACS Nano, 2020, 14(5), 5268–5277, DOI:10.1021/acsnano.0c02439.
|
| This journal is © The Royal Society of Chemistry 2020 |
Click here to see how this site uses Cookies. View our privacy policy here.  Open Access Article
 *a
*a
![[thin space (1/6-em)]](https://www.rsc.org/images/entities/char_2009.gif) :
:![[thin space (1/6-em)]](https://www.rsc.org/images/entities/char_2009.gif) 2 of Co/Ba
2 of Co/Ba![[thin space (1/6-em)]](https://www.rsc.org/images/entities/char_2009.gif) :
:![[thin space (1/6-em)]](https://www.rsc.org/images/entities/char_2009.gif) Fe. The combinations of aqueous solutions of CoCl2·6H2O with 1, 0.25, 0.5, 0.75 and 0 M and BaCl2·2H2O with 0, 0.75, 0.5, 0.25 and 1 M concentrations, respectively, were prepared in separate beakers, and prepared 2 M FeCl3·6H2O was added to form 5 separate complex mixtures. Further, the prepared complex mixtures were added dropwise to an alkaline solution of 0.8 M NaOH (CDH) under strong stirring with a uniform speed. The experiment was performed at room temperature. Stirring was continued for 30 minutes after the last drop of aqueous solution of the mixture was added to the alkaline medium. The precipitate was initially brown in color; after completion of the reaction, it became reddish brown. The precipitate was collected by centrifugation and washed four times to remove impurities, then dried for 1 hour at 200 °C. After drying, the Co1−xBaxFe2O4 (x = 0, 0.25, 0.5, 0.75 and 1) nanoferrites were ground with a mortar and pestle and sintered for 1 hour at 200 °C.
Fe. The combinations of aqueous solutions of CoCl2·6H2O with 1, 0.25, 0.5, 0.75 and 0 M and BaCl2·2H2O with 0, 0.75, 0.5, 0.25 and 1 M concentrations, respectively, were prepared in separate beakers, and prepared 2 M FeCl3·6H2O was added to form 5 separate complex mixtures. Further, the prepared complex mixtures were added dropwise to an alkaline solution of 0.8 M NaOH (CDH) under strong stirring with a uniform speed. The experiment was performed at room temperature. Stirring was continued for 30 minutes after the last drop of aqueous solution of the mixture was added to the alkaline medium. The precipitate was initially brown in color; after completion of the reaction, it became reddish brown. The precipitate was collected by centrifugation and washed four times to remove impurities, then dried for 1 hour at 200 °C. After drying, the Co1−xBaxFe2O4 (x = 0, 0.25, 0.5, 0.75 and 1) nanoferrites were ground with a mortar and pestle and sintered for 1 hour at 200 °C.


![[thin space (1/6-em)]](https://www.rsc.org/images/entities/char_2009.gif) δ
δ
![[thin space (1/6-em)]](https://www.rsc.org/images/entities/char_2009.gif) δ is the dissipation factor of the material.
δ is the dissipation factor of the material.
![[thin space (1/6-em)]](https://www.rsc.org/images/entities/char_2009.gif) σa.c. = log
σa.c. = log![[thin space (1/6-em)]](https://www.rsc.org/images/entities/char_2009.gif) A + p
A + p![[thin space (1/6-em)]](https://www.rsc.org/images/entities/char_2009.gif) log
log![[thin space (1/6-em)]](https://www.rsc.org/images/entities/char_2009.gif) f
f


