 Open Access Article
Creative Commons Attribution 3.0 Unported Licence
Adsorption based realistic molecular model of amorphous kerogen
Hyeonseok Leeb,
Farnaz A. Shakib*c,
Kouqi Liub,
Bo Liua,
Bailey Bubachb,
Rajender S. Varmae,
Ho Won Jang *d,
Mohammadreza Shokouhimher
 *bd and
Mehdi Ostadhassan
 *a
*a
aKey Laboratory of Continental Shale Hydrocarbon Accumulation and Efficient Development, Ministry of Education, Northeast Petroleum University, Daqing 163318, China. E-mail: mehdi.ostadhassan@nepu.edu.cn
bDepartment of Petroleum Engineering, University of North Dakota, Grand Forks, ND 58202, USA
cDepartment of Chemistry and Environmental Science, New Jersey Institute of Technology, Newark, New Jersey 07102, USA. E-mail: shakib@njit.edu
dDepartment of Materials Science and Engineering, Research Institute of Advanced Materials, Seoul National University, Seoul 08826, Republic of Korea. E-mail: hwjang@snu.ac.kr; mrsh2@snu.ac.kr
eRegional Centre of Advanced Technologies and Materials, Faculty of Science, Palacky University, Šlechtitelů 27, 783 71 Olomouc, Czech Republic
First published on 18th June 2020
Abstract
This paper reports the results of Grand Canonical Monte Carlo (GCMC)/molecular dynamics (MD) simulations of N2 and CO2 gas adsorption on three different organic geomacromolecule (kerogen) models. Molecular models of kerogen, although being continuously developed through various analytical and theoretical methods, still require further research due to the complexity and variability of the organic matter. In this joint theory and experiment study, three different kerogen models, with varying chemical compositions and structure from the Bakken, were constructed based on the acquired analytic data by Kelemen et al. in 2007: 13C nuclear magnetic resonance (13C-NMR), X-ray photoelectron spectroscopy (XPS), and X-ray absorption near-edge structure (XANES). N2 and CO2 gas adsorption isotherms obtained from GCMC/MD simulations are in very good agreement with the experimental isotherms of physical samples that had a similar geochemical composition and thermal maturity. The N2/CO2 uptake by the kerogen model at a range of pressure shows considerable similarity with our experimental data. The stronger interaction of CO2 molecules with the model leads to the penetration of CO2 molecules to the sub-surface levels in contrast to N2 molecules being concentrated on the surface of kerogen. These results suggest the important role of kerogen in the separation and transport of gas in organic-rich shale that are the target for sequestration of CO2 and/or enhanced oil recovery (EOR).
Introduction
The worldwide increase of energy consumption was accompanied by a shift of interest from conventional resources to the unconventional shale gas and oil1 leading to continuous research and development on how to extract from these reservoirs2,3 even though such reservoirs require more costly and advanced technologies to exploit.4–6 In these reservoirs, organic matter or kerogen, which is the source of hydrocarbons,7,8 is a major but poorly understood constituent compared to inorganic minerals. This is mostly because of the complexity in chemical composition, structure, and properties of kerogen which originates from its biogenic origin.9 Kerogen, composed of mainly carbon, hydrogen, oxygen, nitrogen, and sulfur, experiences major structural and compositional changes as it undergoes maturation as a function of burial depth, i.e. pressure and temperature,10 and finally breaks down to petroleum and other by-products. Maturation is a complex chemical transformation that encompasses free-radical mechanisms, causing the investigation of volumetric, thermodynamic, and stereochemical properties of porous kerogen to be a highly taxing process. Furthermore, the high submicron porosity of kerogen drastically impacts the storage and transport properties of the entire shale layer1,7 and adds another layer of complexity to the investigation of this macromolecule. Therefore, building molecular models for kerogen is a much desired but challenging task, and not surprisingly, it has been continuously evolving with the advancements in computational methods.8,11The first kerogen model was published by Burlingame et al. in 1968 which had focused on the study of the kerogen extracted from the Green River shale.12 The suggested model did not represent a comprehensive chemical structure of the sample though, as it did not contain molecular topology. Later in 1995, Siskin et al. proposed an updated model for kerogen, particularly by adding the functional groups with oxygen and nitrogen.13 Recent advancements in computational 3D modeling, drastically renewed the interest in exploring kerogen's molecular structure. Varying types of maturity models were introduced for kerogen by Ungerer et al. in 2015 (ref. 14) wherein they analyzed diverse kerogen types (based on their biogenic origin) grounded on a set of experimental data and PM7 semiempirical calculations as implemented in MOPAC.15 In addition to the development of the molecular models for this purpose, the computational techniques have also become frequent tools for simulating the gas adsorption and desorption processes.16–18 Simulation of adsorption behavior is important since organic-rich shales are becoming a repository of greenhouse gas storage which can also improve their productivity in CO2 enhanced oil recovery (EOR) and sequestration.
The Bakken formation is one of the largest unconventional shale oil plays in North America and is currently being studied for potential CO2-enhanced oil recovery and sequestration;19 recent studies suggest that an injection of CO2 into organic-rich shales can increase their production potential.16,19 Hence, in order to precisely estimate the capacity of organic matter in terms of adsorption for sequestration and/or associated mechanisms for enhanced oil recovery, building a 3D molecular model of the Bakken kerogen has become imperative. Here, we report a new representative molecular model for organic matter from the Bakken (kerogen type II) based on previous experimental chemical compositional data.20 We validate our models with gas (CO2 and N2) adsorption isotherms based on both experimental techniques and theoretical simulations. We also investigate CO2 and N2 diffusion behavior in the kerogen system to present a complete picture of interactions that would occur between kerogen and gas molecules.
Methods
Model preparation
A variety of methods can be utilized to provide the chemical composition of organic matter. While 13C-NMR is used to examine the chemical structures and parameters related to carbon, the sulfur and nitrogen content are revealed through the X-ray absorption near-edge structure (XANES) analysis. The X-ray photoelectron spectroscopy (XPS) is capable of quantifying several functional groups in carbonaceous materials associated with carbon, oxygen, sulfur, and nitrogen.21 This information can then be used to build a representative model of any organic material. Here, to build our molecular model of Bakken kerogen, we use the chemical and structural information of kerogen from diverse origins including Bakken, using 13C-NMR, XPS, and XANES data as were reported by Kelemen et al. in 2007.20 The Bakken organic matter is an immature (pre-oil window) type II kerogen representing a marine environment with Tmax of 419 °C and hydrogen index (HI) of 580 mg g−1.20 The atomic ratios of carbon, hydrogen, sulfur, and nitrogen atoms were decided by considering the 13C-NMR, XANES, and XPS analysis results. In particular, 13C-NMR data were utilized for carbon and XPS/XANES for heteroatoms estimations to build the molecular model. From this data, around 35% of the total carbon concentration is included within aromatic structures that also contain nitrogen and sulfur, such as pyridine, pyrrole, and thiophene. The functional groups related to sulfur were set as sulfate and sulfoxide structures, while the oxygen-related functional groups were set as carbonyl and ether.Throughout the text, the theoretical results obtained from our molecular model of the Bakken kerogen will be compared and contrasted to a set of experimental results from literature20 plus two other sets of results that were collected from the Bakken (type II) and tested for gas adsorption in our lab. For the ease of comparison, we refer to the first set of experimental results as sample B1 and the other two as samples B2 and B3 (sampled at 8387 and 9814 feet in vertical depths, respectively). The geochemical characteristics of all these three samples, obtained from programmed pyrolysis,22 are reported in Table 1. It can be seen from this table that the two B2 and B3 samples have the same Tmax of 429 °C, and hydrogen index (HI) of 555 and 513 mg g−1, respectively. Based on this analysis, we conclude that all of these three samples have similar chemical and physical properties and can equivalently represent the immature Bakken kerogen since they are all in the pre-oil generation window. Thus, while we used the data from sample B1 for building molecular models, we obtained the adsorption isotherm data from sample B2 and B3 to verify proposed molecular model.
Molecular model building
The construction of macromolecule kerogen models in this paper consists of the following major steps.(a) First, the details of chemical composition including the nature and ratio of functional groups were determined through analyzing the experimental data reported by Kelemen et al.,20 sample B1.
(b) Using this information, fragments of monoaromatic/polyaromatics moieties (benzene, pyrrolic, pyridinic, and thiophene) and functional groups (sulfate, sulfoxide, carboxylate, amino) and alkanes were built using molecular drawing software, Avogadro.23 These fragments were built using General AMBER Force Field (GAFF) parameters.24,25 The fragments contained the as accurate number of nitrogen, sulfur, and aromatic carbon atoms as possible based on the experimental data. The partial charges on all atoms were assigned by the Gasteiger–Marsili sigma charges26 at the initial stage of the macromolecular model building. The nature of bridges (e.g. ketone and ether) between the fragments were assigned based on the sample analysis and were selected to satisfy the number of oxygen, and carbon atoms.
(c) In designing aromatic fragments, 13C-NMR data were used to find the percentage of protonated, non-protonated, and bridge carbons, where XPS results were used to obtain the ratio of nitrogen and sulfur-containing aromatic structure.
(d) In order to cross-link all of the prebuilt fragments, we used the “bond creation” feature of the LAMMPS package.27 This feature can create bonds between specified atomic sites as a molecular dynamics (MD) simulation running, if the distance between the two atoms becomes less than a threshold value. As such, we carefully selected the bonding sites in the form of aromatic carbon (protonated, non-protonated) and oxygen-related fragments, because in that format they can better fit the designed model. The pre-built fragments were positioned in a rectangular simulation box using Packmol package.28 Then, the cross-linkings between the fragments and bridges were generated during an MD trajectory that converged towards local equilibrium with GAFF force field parameters.25,27
(e) When the fragments were branched, conforming to the desired ratio of hydrogen to carbon atoms led to the creation of unpaired free radical sites. Therefore, the cross-linked fragments were inspected and improved maximally by adding or removing hydrogen or methyl groups. Thus, by trial and error process, we built the molecular model of kerogen that interweaves all of the constituent fragments within a single macromolecule.
Quantum mechanics calculations
To obtain the quantitative electrostatic properties and optimized geometries of our kerogen model, we performed quantum mechanical (QM) calculations using the ORCA package29 based on the density functional theory (DFT) method. As DFT considered to be suitable for organic compounds, we ran our calculations at B3LYP/6-31G(d) method/basis set level.30 Hirshfeld atomic population31 analysis was carried out to obtain atomic partial charges since it is less basis-set dependent and can be derived for optimal partitioning of electron density. The partial charges obtained from the QM calculations replaced the initial partial charges which had been set without the polarization of atoms.Gas adsorption and diffusion simulation (GCMC + MD)
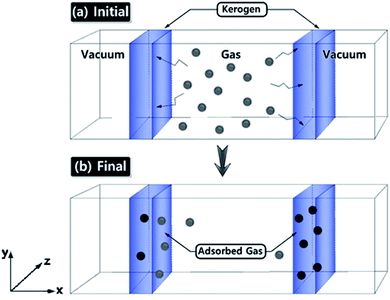
Gas adsorption simulations were carried out using Grand Canonical Monte Carlo (GCMC) simulation, and gas diffusion simulations were utilized by Molecular Dynamics (MD) technique efficiently converging towards local equilibrium for diffusion equation. The equilibrium can be determined in the molecule configuration considering fluctuations in the internal energy and number of adsorbed molecules. We used a hybrid molecular simulation that consists of combining GCMC and MD to perform simulations implemented in LAMMPS package27,32 (schematic illustration of the simulation system is shown in Fig. 1). At every time step of the simulation, we attempted both GCMC exchanges (insertions and deletions) and MC moves (translations and rotations), followed by MD simulation steps in the canonical ensemble at the constant number of molecules. This process allows the gas molecule diffusion and kerogen model relaxation at each GCMC time step. Technically, every 100 GCMC insertion/deletion attempts followed by 200 MD time steps. In GCMC simulation, the chemical potential of the gas phase was related to the gas pressure using the ideal gas equation of state. The Metropolis algorithm was utilized to calculate the potential energy in the system and to control GCMC exchange or MC move. The gas adsorption and diffusion simulations were run for 5 × 10⁷ MD steps and 2.5 × 10⁵ GCMC cycles using a Nosé–Hoover thermostat to keep the temperature constant. The time step in all simulations was 1 fs.Interactions were modeled by the sum of short-range Pauli repulsion and long-range electrostatic attraction embedded within Lennard-Jones potential with a cutoff distance of 10 Å using a particle–particle particle–mesh solver (PPPM).33,34 The N2 and CO2 molecules were simulated using the TraPPE force field parameter set shown in Table 2,35 which is useful for complex chemical systems with molecular simulation. In the TraPPE force field, CO2 was modeled as a linear triatomic and N2 as a diatomic molecule with fixed bond lengths and bond angles. These models are suitable for reproducing the densities and the diffusion of N2 and CO2 in bulk and surface phases at the conditions simulated in this work. The system was set in order to maintain a constant temperature of 77 K and 273 K which is the experimental gas adsorption temperatures and applied with the Nosé–Hoover thermostats. All partial charges of the kerogen models were obtained from QM calculations as explained in the previous section. At equilibrium, the number of gas molecules in the kerogen surface and bulk phase was kept constant.
| Molecules | Atoms | Charge | σ (Å) | ε/kB (K) |
|---|---|---|---|---|
| N2 | N | −0.482 | 3.31 | 36.0 |
| N-COM | +0.964 | 0.0 | ||
| CO2 | C | +0.70 | 2.80 | 27.0 |
| O | −0.35 | 3.05 | 79.0 |
Gas adsorption experiment
Gas adsorption experiments were performed on isolated kerogen from the bulk shale based on already established procedures.36 Briefly, we collected the samples and removed the bitumen using a mixture of methanol and toluene. Then, we added HCl into the solid residue to remove carbonates. Subsequently, HF was added to remove the silicate minerals, and pyrite was removed by using CrCl2, and finally, acid with dissolved inorganic minerals was separated from the organic matter by centrifugation.After isolation from the rock matrix, the solid kerogen was degassed for at least 8 hours at 110 °C to remove moisture and volatiles, crushed (to less than 250 μm size) and loaded into the instruments. Low-pressure N2 was measured on a Micromeritics® Tristar II apparatus at 77 K while CO2 adsorption was performed on a Micromeritics® Tristar II plus apparatus at 273 K. The gas adsorption quantity was measured over the relative equilibrium adsorption pressure (P/P0) range of 0.01–0.99, where P is the gas vapor pressure in the system and P0 is the saturation pressure of N2.
Results and discussion
Bakken molecular models
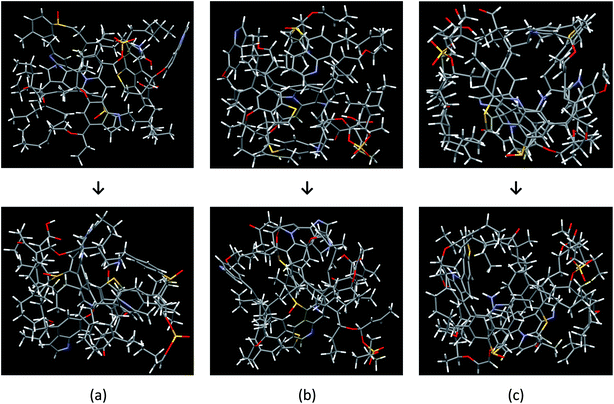
The Bakken shale models were constructed and verified by analyzing experimental data coupled with computational techniques (molecular builder, quantum mechanics calculations, and Monte Carlo/molecular dynamics simulation). The models consist of a complicated mixture of chain and mesh structures. Fig. 2 visualizes the three molecular models, before and after the optimization process, which do not have the same chemical composition and structure. The final chemical compositions of models A, B, and C are C141H187N6O15S4, C152H193N6O15S4, and C158H207N6O16S4, respectively.Table 3 summarizes the aromatic carbons in the constructed models that were found compatible with 13C-NMR data in sample B1. Since aromatic carbons were set up at the initial stage of molecular model building, where aromatic fragments were prebuilt, carbons in aromatic structures are very close to sample B1 in regard to the structural parameters (e.g. protonated, non-protonated, and bridged carbon in aromatic structure). However, some discrepancies were detected such as the ratio of hydrogen to carbon atoms and methylene/methine structure. Because we improved the models by adding or removing methyl groups and hydrogens, it was not possible for every structure parameter of the models to meet the sample B1 perfectly.
| Structure | Sample B1 | Model A | Model B | Model C |
|---|---|---|---|---|
| a The data presented here are ratio per 1 number of carbon. | ||||
| Aromatic | 0.35 | 0.371 | 0.344 | 0.330 |
| Carboxyl/amide/carbonyl | 0.02 | 0.028 | 0.026 | 0.025 |
| Protonated aromatic | 0.17 | 0.180 | 0.180 | 0.140 |
| Phenoxy/phenolic | 0.02 | 0.021 | 0.021 | 0.021 |
| Alkyl-substituted aromatic | 0.08 | 0.064 | 0.064 | 0.070 |
| Bridged aromatic | 0.09 | 0.092 | 0.092 | 0.092 |
| Aliphatic | 0.63 | 0.61 | 0.63 | 0.64 |
| Methylene/methine | 0.46 | 0.44 | 0.45 | 0.48 |
| Methyl/methoxy | 0.15 | 0.12 | 0.12 | 0.13 |
| Alcohol/ether | 0.06 | 0.04 | 0.04 | 0.04 |
| H/C ratio | 1.22 | 1.32 | 1.27 | 1.31 |
| Average density (g cm−3) | — | 0.927 | 0.919 | 0.974 |
The models have average densities between 0.92 and 0.98 g cm−3 (in Table 3) demonstrating density profiles along the x-axis around 1.6 to 0.1 g cm−3 (in Fig. 3). The density profiles of models exhibit that the generated kerogen structures are amorphous and the internal/external surfaces are rough at the sub-nanometer level in Fig. 3. Since gas molecules diffuse and adsorbed along the x-axis (Fig. 1), the gas molecules could heavily be affected this internal density of models.
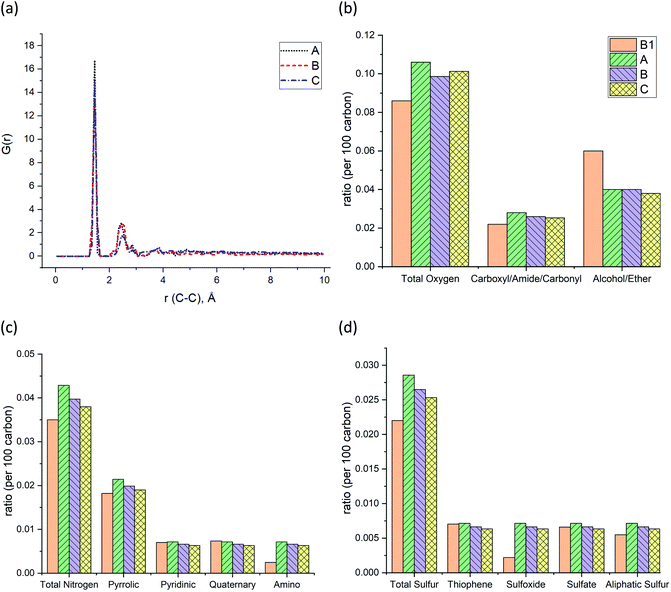
The pair distribution function (PDF) profile, Fig. 4a, shows the probability of carbon existence at the distance r (Å) from another carbon, and it is exclusively related to carbon structure. The highest peak position is between 1.4 and 1.45 Å which represents aromatic carbons. Since almost 35% of the carbons in the models have an aromatic structure, this is the highest peak of all. The three models have similar peak positions with a similar width. Fig. 4b shows the comparison of the three models with sample B1 based on the total oxygen, i.e. carbonyl, ether, and alcohol groups per 100 carbons. It is apparent from this figure that the constructed models (A–C) contain a higher total number of oxygens per carbon than sample B1. It is the result of sample B1 having a higher number of ether and alcohol groups compared to the models but a similar ratio of carbonyl functional groups. It should be noted since the carboxyl and alcohol groups both contain –OH, the peak involving ether and alcohol groups could have been overlapped and intensified as a result, in the XPS spectrum.20 This phenomenon has led to a higher amount of alcohol/ether as a result of the summation of carboxyl and alcohol with –OH group shown in Fig. 4b. Fig. 4c and d also indicate that both prebuilt aromatic fragments (pyrrolic, pyridinic, and thiophene) and the bridges (quaternary, sulfate, and aliphatic sulfur) have comparable ratio with sample B1. However, the ratio of amino and sulfoxide in the models are somewhat higher. Screening Fig. 4b–d, one can also find that all three models have a smaller percentage of oxygen, nitrogen, and sulfur atoms than the original input data from XPS of sample B1. Our macromolecule models of Bakken kerogen consist of around 150 carbon atoms due to the size limitation of the model building. This limited total number of atoms in the models is not enough to thoroughly represent the perfect ratios.
Gas diffusion/adsorption on the surface of kerogen
The ultimate goal of this study is to develop reliable amorphous kerogen molecular models. In order to verify the reliability of these models, here we compare and contrast the gas adsorption/diffusion simulation results of these models with the experimental gas adsorption isotherms that we have obtained from Bakken kerogen samples B2 and B3. We performed GCMC/MD simulations to investigate N2 and CO2 gas molecular adsorption on the surface of the models as well as their diffusion to the sub-surface levels. Apart from validating our models, because the three kerogen models cover a variety of structure and chemical composition and contain small size pore (<1 nm) that are irregularly spread all over the models, we expect that this study sufficiently clarifies the behavior of N2 and CO2 molecules through the small size pores of organic matter.First, we focus on the results of adsorption/diffusion of N2 molecules on/into three molecular models (A–C) and compare the results to the experimental N2 adsorption isotherms of samples B2 and B3 in Fig. 5.
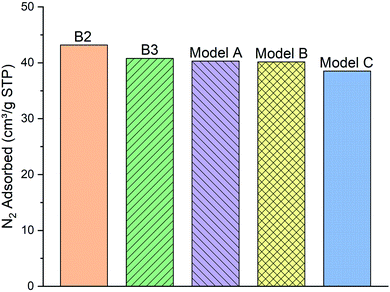 | ||
| Fig. 5 The comparison of the simulated excess nitrogen (N2) adsorption isotherms between the models (A–C) with experimental loadings (sample B2 and B3) at 100 kPa, 77 K. | ||
As can be clearly seen, samples B2 and B3 capture around 43.18 and 40.78 (cm3 g−1 STP) of the N2 gas, respectively, at 100 kPa and 77 K. N2 molecules adsorption behavior with the model A and B (40.29 and 40.15 cm3 g−1 STP, respectively) are fairly close to the two experimental samples. Meanwhile, the number of adsorbed molecules into model C (38.5 cm3 g−1 STP) is almost 4% lower than both of the other two models and the experimental samples B2 and B3. We conclude that the difference of functional group distribution and internal density profile among the three models affects the adsorption of N2 molecules on the kerogen surface and pores. For instance, the model C containing a larger ratio of aliphatic carbon structure, specifically more methyl groups, cannot provide adequate space for N2 molecules for adsorption as much as the model A and B. The steric effect of the methyl groups may be the main reason preventing the attachment of N2 molecules to the framework compared to the planar configurations of aromatic structures.37
Since the overall results of N2 adsorption on the three models were close to the experiment, we clustered the three models for CO2 gas adsorption and diffusion simulations. Packmol package was utilized to place one of each kerogen models (A, B, and C) in two sides of a feed compartment with the size of around 16 × 57 × 40 angstrom, as shown in Fig. 1. These two systems were then allowed to come to relaxation by running a 1 ps NVT molecular dynamics simulations. The final average density of the kerogen models compartment is 0.922 g cm−3. Since the three kerogen models were simply adhered to one another and clustered, packing them in different modes was not considered. In this system, gaseous fluids would diffuse to two different surfaces of the clustered kerogen model. Unlike N2 gas adsorption experimental conditions, CO2 gas adsorption experiment, and accordingly theoretical simulations, were performed under a series of varying pressure values at 273 K (Fig. 6).
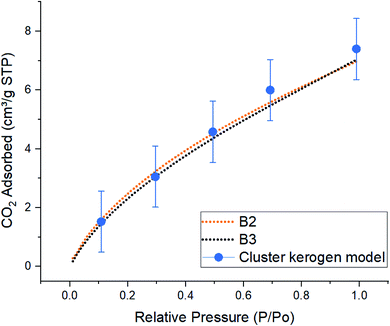 | ||
| Fig. 6 Comparison of simulated excess CO2 adsorption isotherms between the cluster kerogen model, blue dots, and the experimental samples B2, orange, and B3, black, at 273 K. | ||
The result of CO2 gas adsorption isotherms of the samples B2 and B3 show a nearly linear relationship of gas adsorption with respect to the pressure. The cluster model very closely follows this behavior and only slightly deviates at higher pressure. At lower pressure of 10, 30, and 50 kPa, the cluster model shows a total amount of adsorbed CO2 molecules of 1.53, 3.05, and 4.58 cm3 g−1 STP, respectively. These are very close to those of experimental samples B2 (1.59, 3.22, and 4.52 cm3 g−1 STP), and B3 (1.45, 3.05, and 4.35 cm3 g−1 STP). The small discrepancy, around 5%, between the cluster model and samples B2 and B3 occurs when the simulation and experimental pressures reach 70 kPa. This phenomenon can be explained due to the increase in chemical potential in the smaller pores. As the pore radius decreases, the overlapping potentials from the strong pore wall–wall interactions and the strong CO2–wall interactions would lead to higher amounts of CO2 molecules to get adsorbed in smaller pores compared to the larger ones.38,39 Since the model hosts ultra-micro pores (0.3 nm to 0.7 nm) and larger number of CO2 molecules are placed in a fixed system at higher pressures (larger number of CO2 molecules in GCMC/MD simulation), it is observed that higher quantities of CO2 are adsorbed on the pore surfaces. This is in contrast with how samples B2 and B3 that both contain meso (less than 3–5 nm) and ultra-micro pores performed. The results proclaim that the pore structure plays an important role in adsorption mechanisms as a function of pressure.
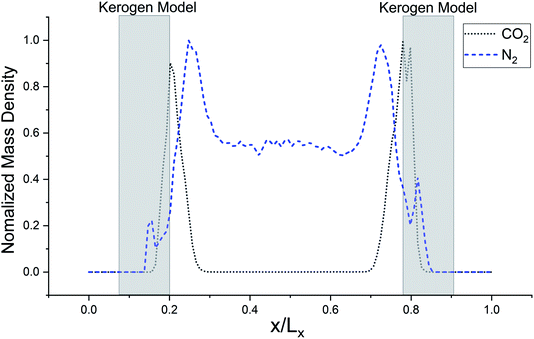
The simulated mass density profile in Fig. 7 shows that CO2 and N2 molecules have migrated to the kerogen model during the process and penetrated to the sub-surface levels of the model as well as being adsorbed on the surface. This simulation confirms that the interaction between gas (CO2 and N2) molecules and kerogen molecular models is strong enough to capture the molecules on or inside the models. Because the internal density of the model is irregular and highly densed sub-surfaces are existed (Fig. 3), the gas molecules could be captured into these densed areas inside the kerogen model. In particular, CO2 molecules show a much stronger interaction than N2 such that a considerable number of CO2 molecules penetrate to the sub-surface levels of the kerogen model. N2 molecules, on the other hand, are mostly diffused in the bulk region with a smaller number of molecules detained on the surface of the kerogen model. These results demonstrate that kerogen can be used as a porous filter for optimal separation of CO2 and N2 gas molecules.
Conclusion
In this work, we reported a molecular model for amorphous organic matter (kerogen) built based on experimental constraints. The numerical analysis of the kerogen by the methods 13C-NMR, XPS, and XANES was used to determine the chemical composition and structure of three different models. GAFF parameters combined with partial charges computed via quantum mechanics calculations were used to build a more realistic model. GCMC and MD simulations were run to compute N2 and CO2 gas adsorption isotherms on the model and were compared to our experimental results. N2 gas adsorption behavior in the three kerogen model systems was in very good agreement with experimental results in similar conditions, 100 kPa and 77 K. Adsorption of CO2 molecules on a clustered model also shows similar adsorption isotherm behavior overall. Based on the simulation results we uncovered, the kerogen model seems to have a stronger interaction with CO2 molecules than N2 molecules such that CO2 molecules are not only adsorbed on the surface but also penetrate to the sub-surface level of the model.Conflicts of interest
There are no conflicts to declare.Acknowledgements
The financial supports of the Future Material Discovery Program (2016M3D1A1027666) and the Basic Science Research Program (2017R1A2B3009135) through the National Research Foundation of Korea are appreciated. Authors wish to thank two anonymous reviewers and respected editor for comments and feedbacks that helped to improve this manuscript.References
- B. Jia, J. Tsau and R. Barati, A Review of the Current Progress of CO2 Injection EOR and Carbon Storage in Shale Oil Reservoirs, Fuel, 2019, 236, 404–427 CrossRef CAS.
- Y. Shen, H. Ge, C. Li, Z. Yang, X. Yang, K. Ren and S. Su, Water Imbibition of Shale and Its Potential Influence on Shale Gas Recovery—A Comparative Study of Marine and Continental Shale Formations, J. Nat. Gas Sci. Eng., 2016, 35, 1121–1128 CrossRef CAS.
- E. Fathi and I. Y. Akkutlu, Multi-Component Gas Transport and Adsorption Effects during CO2 Injection and Enhanced Shale Gas Recovery, Int. J. Coal Geol., 2014, 123, 52 CrossRef CAS.
- A. Vengosh, R. B. Jackson, N. Warner, T. H. Darrah and A. Kondash, A Critical Review of the Risks to Water Resources from Unconventional Shale Gas Development and Hydraulic Fracturing in the United States, Environ. Sci. Technol. Lett., 2014, 48, 8334–8348 CrossRef CAS PubMed.
- A. Muggeridge, A. Cockin, K. Webb, H. Frampton, I. Collins, T. Moulds and P. Salino, Recovery Rates, Enhanced Oil Recovery and Technological Limits, Philos. Trans. R. Soc., A, 2013, 372, 20120320 CrossRef PubMed.
- C. Guo, M. Wei and H. Liu, Study of Gas Production from Shale Reservoirs with Multi-Stage Hydraulic Fracturing Horizontal Well Considering Multiple Transport Mechanisms, PLoS One, 2018, 13, e0188480 CrossRef PubMed.
- B. Durand Sedimentary Organic Matter and Kerogen. Definition and Quantitative Importance of Kerogen. Kerogen, Insoluble Organic Matter from Sedimentary Rock, Editions Technips, 1980, pp. 13–34 Search PubMed.
- H. Wang, Z. Qu, Y. Yin, J. Bai and B. Yu, Review of Molecular Simulation Method for Gas Adsorption/desorption and Diffusion in Shale Matrix, J. Therm. Sci., 2019, 28, 1–16 CrossRef.
- M. Vandenbroucke and C. Largeau, Kerogen Origin, Evolution and Structure, Org. Geochem., 2007, 38, 719–833 CrossRef CAS.
- A. Abarghani, M. Ostadhassan, T. Gentzis, H. Carvajal-Ortiz and B. Bubach, Organofacies Study of The Bakken Source Rock in North Dakota, USA, Based on Organic Petrology and Geochemistry, Int. J. Coal Geol., 2018, 188, 79–93 CrossRef CAS.
- C. Bousige, C. M. Ghimbeu, C. Vix-guterl, A. E. Pomerantz, A. Suleimenova, G. Vaughan, G. Garbarino, M. Feygenson, C. Wildgruber, F. Ulm, R. J. Pellenq and B. Coasne, Realistic Molecular Model of Kerogen's Nanostructure, Nat. Mater., 2016, 15, 576 CrossRef CAS PubMed.
- A. L. Burlingame, P. A. Haug, H. K. Schnoes and B. R. Simoneit, Fatty Acids Derived from the Green River Formation Oil Shale by Extractions and Oxidations—A Review, Advances in Organic Geochemistry, Proceedings of the 4th International Meeting on Organic Geochemistry, 1968, pp. 85–129 Search PubMed.
- M. Siskin, C. G. Scouten, K. D. Rose, D. Aczel, S. G. Colgrove and R. E. Pabst, Detailed Structural Characterization of the Organic Material in Rundle Ramsay Crossing and Green River Oil Shales, in Composition, Geochemistry and Conversion of Oil Shales, ed. C. Snape, NATO ASI Series (Series C: Mathematical and Physical Sciences), 1995, p. 455 Search PubMed.
- P. Ungerer, J. Collell and M. Yiannourakou, Molecular Modeling of the Volumetric and Thermodynamic Properties of Kerogen: Influence of Organic Type and Maturity, Energy Fuels, 2015, 29, 91–105 CrossRef CAS.
- J. J. P. Stewart, Optimization of Parameters for Semiempirical Methods VI: More Modifications to the NDDO Approximations and Re-optimization of Parameters, J. Mol. Model., 2013, 19, 1–32 CrossRef CAS PubMed.
- H. Lee, F. A. Shakib, M. Shokouhimehr, B. Bubach, L. Kong and M. Ostadhassan, Optimal Separation of CO2/CH4/Brine with Amorphous Kerogen: A Thermodynamics and Kinetics Study, J. Phys. Chem. C, 2019, 123(34), 20877–20883 CrossRef CAS.
- J. Collell, P. Ungerer, G. Galliero, M. Yiannourakou, F. Montel and M. Pujol, Molecular Simulation of Bulk Organic Matter in Type II Shales in the Middle of the Oil Formation Window, Energy Fuels, 2014, 28, 7457–7466 CrossRef CAS.
- S. Tesson and A. Firoozabadi, Methane Adsorption and Self-Diffusion in Shale Kerogen and Slit Nanopores by Molecular Simulations, J. Phys. Chem. C, 2018, 122, 23528–23542 CrossRef CAS.
- R. Kelemen, C. D. Gorecki, G. Liu, E. N. Steadman, J. R. Braunberger, J. A. Harju, J. Ge and J. A. Sorensen, CO2-Based Enhanced Oil Recovery from Unconventional Reservoirs: A Case Study of the Bakken Formation, SPE Unconventional Resources Conference, Society of Petroleum Engineers, 2014, vol. 21(3), pp. 1548–1561 Search PubMed.
- S. R. Keleman, M. Afeworki, M. L. Gorbaty, M. Sansone, P. J. Kwiatek, C. C. Walters, H. Freund, M. Siskin, A. E. Bence, D. J. Curry, M. Solum, R. J. Pugmire, M. Vandenbroucke, M. Leblond and F. Behar, Direct Characterization of Kerogen by X-ray and Solid-State 13C Nuclear Magnetic Resonance Methods, Energy Fuels, 2007, 21, 1548–1561 CrossRef.
- J. Tong, X. Han, S. Wang and X. Jiang, Evaluation of Structural Characteristics of Huadian Oil Shale Kerogen Using Direct Techniques (Solid-State13C NMR, XPS, FT-IR, and XRD), Energy Fuels, 2011, 25, 4006–4013 CrossRef CAS.
- F. Behar, V. Beaumont and H. L. D. B. Penteado, Rock-Eval 6 Technology: Performances and Developments, Oil Gas Sci. Technol., 2001, 56, 111–134 CrossRef CAS.
- M. D. Hanwell, D. E. Curtis, D. C. Lonie, T. Vandermeersch, E. Zurek and G. R. Hutchison, Avogadro: An Advanced Semantic Chemical Editor, Visualization, and Analysis Platform, J. Cheminf., 2012, 4, 17 CAS.
- J. Wang, W. Wang, P. A. Kollman and D. A. Case, Automatic Atom Type and Bond Type Perception in Molecular Mechanical Calculations, J. Mol. Graph. Model., 2006, 25, 247–260 CrossRef CAS PubMed.
- J. Wang, R. M. Wolf, J. W. Caldwell, P. A. Kollman and D. A. Case, Development and Testing of a General Amber Force Field, J. Comput. Chem., 2004, 25, 1157–1174 CrossRef CAS PubMed.
- J. Gasteiger and M. Marsili, A New Model for Calculating Atomic Charges in Molecules, Tetrahedron Lett., 1978, 19, 3181–3184 CrossRef.
- S. Plimpton, Fast Parallel Algorithms for Short-Range Molecular Dynamics, J. Comput. Phys., 1995, 117, 1–19 CrossRef CAS.
- L. Martinez, R. Andrade, E. G. Birgin and J. M. Martinez, Packmol: A Package for Building Initial Configurations for Molecular Dynamics Simulations, J. Comput. Chem., 2009, 30, 2157–2164 CrossRef CAS PubMed.
- T. Hočevar and J. Demšar, Computation of Graphlet Orbits for Nodes and Edges in Sparse Graphs, J. Stat. Software, 2016, 71, 1–24 Search PubMed.
- J. Tirado-Rives and W. L. Jorgensen, Performance of B3LYP Density Functional Methods for a Large Set of Organic Molecules, J. Chem. Theory Comput., 2008, 4, 297–306 CrossRef CAS PubMed.
- F. L. Hirshfeld, Bonded-Atom Fragments for Describing Molecular Charge Densities, Theor. Chim. Acta, 1977, 44, 129–138 CrossRef CAS.
- W. Humphrey, A. Dalke and K. Schulten, VMD: Visual Molecular Dynamics, J. Mol. Graph., 1996, 14, 33–38 CrossRef CAS PubMed.
- W. M. Brown, A. Kohlmeyer, S. J. Plimpton and A. N. Tharrington, Implementing Molecular Dynamics on Hybrid High Performance Computers - Particle-Particle Particle-Mesh, Comput. Phys. Commun., 2012, 183, 449–459 CrossRef CAS.
- S. J. Plimpton, R. Pollock and M. Stevens, Particle-Mesh Ewald and rRESPA for Parallel Molecular Dynamics Simulations, in Proceedings of the Eighth SIAM Conference on Parallel Processing for Scientific Computing, 1997 Search PubMed.
- J. J. Potoff and J. I. Siepmann, Vapor–Liquid Equilibria of Mixtures Containing Alkanes, Carbon Dioxide, and Nitrogen, AIChE J., 2001, 47, 1676–1682 CrossRef CAS.
- K. Liu, M. Ostadhassan, J. Zhou, T. Gentzis and R. Rezaee, Nanoscale Pore Structure Characterization of the Bakken Shale in the USA, Fuel, 2017, 209, 567–578 CrossRef CAS.
- R. G. Kadesch and S. W. Weller, The steric Inhibition of Resonance in Aromatic Carbonyl Compounds, J. Am. Chem. Soc., 1941, 63(5), 1310–1314 CrossRef CAS.
- P. Psarras, R. Holmes, V. Vishal and J. Wilcox, Methane and CO2 Adsorption Capacities of Kerogen in the Eagle Ford Shale from Molecular Simulation, Accounts Chem. Res., 2017, 50, 1818–1828 CrossRef CAS PubMed.
- Y. Liu and J. Wilcox, Effects of Surface Heterogeneity on the Adsorption of CO2 in Microporous Carbons, Environ. Sci. Technol., 2012, 46, 1940–1947 CrossRef CAS PubMed.
| This journal is © The Royal Society of Chemistry 2020 |

