 Open Access Article
Preparation and laser sintering of a thermoplastic polyurethane carbon nanotube composite-based pressure sensor
Yu Zhuang a,
Yanling Guo*b,
Jian Lic,
Kaiyi Jiangd,
Yueqiang Yu
 e,
Hui Zhangf and
Dakun Liug
aSchool of Mechatronics Engineering, Northeast Forestry University, Harbin 150040, China
bSchool of Mechatronics Engineering, Northeast Forestry University, Harbin 150040, China. E-mail: nefugylzy@163.com
cSchool of Mechatronics Engineering, Northeast Forestry University, Harbin 150040, China
dSchool of Engineering and Technology, Northeast Forestry University, Harbin 150040, China
eCollege of Mechanical Science and Engineering, Northeast Petroleum University, Daqing 163318, China
fSchool of Mechatronics Engineering, Northeast Forestry University, Harbin 150040, China
gSchool of Mechatronics Engineering, Northeast Forestry University, Harbin 150040, China
First published on 22nd June 2020
Abstract
Selective laser sintering (SLS) is a desirable method for fabricating human motion detecting sensors as it can produce a complex shape with different materials that are machinable to specific applications. The bottleneck in the SLS processing of sensors is the preparation of a material that is both flexible and conductive. In this study, carbon nanotubes (CNTs) were selected as a conductive nanofiller and dispersed into a flexible thermoplastic polyurethane (TPU) polymer matrix to prepare TPU/CNT composites for SLS processing pressure sensors. CNTs were first oxidized to prevent them from aggregating in the TPU matrix. TPU/CNT composites were prepared via solution blending and ball milling methods, and the dispersion of the CNTs in the composites was observed by scanning electron microscopy. The thermal properties of TPU/CNT composites with different CNT content were measured, and processing parameters used in the SLS were determined based on differential scanning calorimetry measurements. SLS-processed TPU/CNT composites were prepared with different conductivity and piezoresistive properties. Percolation theory and piezoresistive performance results proved that a 0.25 wt% CNT-containing TPU/CNT composite showed the best pressure sensing ability, and it was successfully used as a sensor to detect plantar pressure distribution in a human foot.
1. Introduction
Piezoresistivity describes the change in resistivity caused by mechanical stimulation, and is one of the most important properties of conductive materials that enables them to be used as sensors.1 Metal and inorganic semiconductor materials are widely used in piezoresistive sensors. However, due to their nature rigidity, these sensors are severely limited in the application of wearable sensors.2 Owing to the flexibility and stretchability of a polymer matrix,3,4 conductive polymer composites (CPCs) have shown great potentials for the detection of various external stimuli (tensile, compression, organic vapor, temperature, etc.) based on the reconstruction of a conductive network which induced significant resistance variation.5,6 Generally, CPCs are fabricated through combining conductive filler (carbon nanotube,7–9 graphene,10 Ag nanowire,11 etc.) and insulating polymer together using proper processing technology (melt mixing, solution mixing, dip-coating, spray coating, etc.). For example, Lee et al.9 applied silicone rubber to polyurethane foam and further dip-coated with MWCNT dispersed TPU ink to produce a sensor with good repeatability, high durability and fast response speed, and the senor can measure pressures of less than 100 Pa and more than 200 kPa. Yu et al.11 used thermal compression to clamp AgNW/CNF composites between double plastic polyurethane (TPU) membranes and constructed special microscopic structures through a pre-strain process to improve sensitivity. The sensor has excellent stability and durability and also shows stable and repeatable negative temperature sensing behavior, which can be used for temperature detection. However, the surfaces of these sensors are generally planar, as they are formed using hot compression and casting in a specific mold, among others, meaning that the fabricated pressure sensor does not make complete contact with the human body, which results in measuring errors.Selective laser sintering (SLS) is a relatively mature technology in additive manufacturing (AM).12 Compared with other AM technologies, the most obvious advantage of SLS is wide range of processing materials no support material needed, which make it more suitable for preparing flexible pressure sensing elements fitting the complex structure of the human body.13,14 At present, the most commonly used materials in SLS are nylon (PA), polycarbonate (PC), polylactic acid (PLA), and polystyrene (PS), with it being used only for a few polymer functional micro–nano composite materials. Therefore, developing new polymer-based materials suitable for SLS processing is of great significance.
If a sensor is developed for use on the human body, a specific degree of flexibility is required. Thermoplastic polyurethane (TPU), a typical polymer elastomer material that has been used in SLS processing previously, is an excellent electrical insulator that exhibits high elasticity, flexibility, and environmental stability. It is widely used in the textiles, medical, automotive, aerospace, aviation, and other fields, and is an ideal base material for use in developing flexible pressure sensors.
Due to large specific surface area, aspect ratio, high specific strength and modulus, and hardness and toughness, carbon nanotubes (CNTs) are often used as conductive filler materials and are a good material for preparing sensors.15,16 However, CNTs particles are prone to aggregate because of strong van der Waals force, leading to the inhomogeneous distribution of the electrically conductive filler and unstable sensing performance.
In recent years, polymer micro–nano composite materials have been increasingly used in SLS. Yan et al.17 used SLS to prepare organic montmorillonite-filled PA12 composite sensor components, and they found that the mechanical properties of the composite were greatly improved compared to those of pure PA12. Meincke et al.18 used SLS to prepare CNT/PA6 composite sensor components and found that the samples showed good electrical and mechanical properties at low pressure loadings (4–6%). However, the dispersion of the micro-nano materials is the bottleneck in this research area. At present, the method for preparing nanocomposite materials for SLS involves the simple mechanical mixing, meaning that the nanofiller particles are unevenly dispersed in the polymer matrix. The difference in the densities of the polymer and nanofiller particles results in the precipitation of two phases during powdering or sintering, which affects the performance of the final product. In order to achieve uniform dispersion and reduce the viscosity of CNT/polymer composite systems, ultrasonic dispersion and dispersion in organic solvents are widely used to prepare nanocomposite materials. In a study by Peng,19 four types of surfactants were used to modify the surface of CNTs, and then the CNTs were dispersed to the powder surface of PA12 using ultrasound. PA12 was added after stirring, drying, and ball milling to produce a PA12/CNT composite powder. However, using ultrasound to meet the requirements of the SLS process is difficult. The demands of nanocomposite materials make their large-scale production difficult, so SLS is generally not used in scale up, and only hot presses have been used to prepare test samples. In addition, for scale up, the heavy use of organic solvents may lead to environmental problems and higher costs.
As alternatives to ultrasonic dispersion and dispersion in organic solvents, researchers used mechanical and chemical methods to disperse CNTs in matrixes. In work carried out by Zhou,20 ball milling at 3000 °C was used as a method to purify CNTs for dispersion in polystyrene. However, although they effectively reduced the amount of impurities in the polystyrene and enhanced its mechanical properties, CNTs were still found to agglomerate in the polymer matrix. Zhang21 used a solid-phase shear milling technique in combination with freeze pulverization to prepare a PA12/CNT composite powder. Under the action of a powerful three-dimensional shear force, the CNTs were cut shorter, significantly improving the dispersibility of the CNTs in the PA12 matrix.
To address the aforementioned challenges, in this study filler, CNTs were pretreated in a strong acid mixture to limit their aggregation before using solution blending and ball milling dispersion methods to mix different amounts of the filler into a TPU matrix to compare the dispersions of the CNTs. Since the dispersion and content of the CNTs play a key role in the conductivity of the composites, the changes in functional groups and dispersion of the CNTs were characterized using Fourier-transform infrared (FTIR) spectroscopy and scanning electron microscopy (SEM). The effects of the CNT content on the electrical conductivity and piezoresistive properties of the composites were studied to determine the optimal ratio of TPU to CNT, and a flexible pressure detection component was prepared using SLS to measure plantar pressure in a human foot. Thus, a new method is presented for preparing a flexible wearable pressure detecting product that can be tailored to meet different needs.
2. Experimental
2.1 Reagents
TPU powder with an average grain diameter of 80 μm (Luvosint X92A) was purchased from Luvocom, Germany. CNTs with an average diameter of 5–15 nm and average length of 0.5–1.5 μm were supplied by Shenzhen Turing Evolution Technology Co., Ltd, China. Concentrated sulfuric acid (H2SO4, 96–98%) and concentrated nitric acid (HNO3, 68%) were supplied by Sinopharm Chemical Reagent Co., Ltd, China. Analytical grade anhydrous ethanol was supplied by Damao Chemical Reagent Factory, China.2.2 Preparation of the TPU/CNT composites
![[thin space (1/6-em)]](https://www.rsc.org/images/entities/char_2009.gif) :
:![[thin space (1/6-em)]](https://www.rsc.org/images/entities/char_2009.gif) 1 ratio of concentrated H2SO4 (120 ml) and concentrated HNO3 (40 ml) was added to 1 g of CNTs in a 500 ml beaker, and the solution was then magnetically stirred at 80 °C for 2 h. After this time, the solution was allowed to stand until layers separated out. The supernatant was then removed, and the solid was filtered by suction and washed continuously with deionized water until the pH was neutral. The modified CNT product was then placed in a dry cabinet with the temperature maintained at 100 °C, where it was dried to a constant weight.
1 ratio of concentrated H2SO4 (120 ml) and concentrated HNO3 (40 ml) was added to 1 g of CNTs in a 500 ml beaker, and the solution was then magnetically stirred at 80 °C for 2 h. After this time, the solution was allowed to stand until layers separated out. The supernatant was then removed, and the solid was filtered by suction and washed continuously with deionized water until the pH was neutral. The modified CNT product was then placed in a dry cabinet with the temperature maintained at 100 °C, where it was dried to a constant weight.![[thin space (1/6-em)]](https://www.rsc.org/images/entities/char_2009.gif) :
:![[thin space (1/6-em)]](https://www.rsc.org/images/entities/char_2009.gif) 99 CNTs
99 CNTs![[thin space (1/6-em)]](https://www.rsc.org/images/entities/char_2009.gif) :
:![[thin space (1/6-em)]](https://www.rsc.org/images/entities/char_2009.gif) TPU. The powdered mixture was then taken out and allowed to cool naturally to obtain a TPU-based composite powder.
TPU. The powdered mixture was then taken out and allowed to cool naturally to obtain a TPU-based composite powder.![[thin space (1/6-em)]](https://www.rsc.org/images/entities/char_2009.gif) :
:![[thin space (1/6-em)]](https://www.rsc.org/images/entities/char_2009.gif) 100 CNTs
100 CNTs![[thin space (1/6-em)]](https://www.rsc.org/images/entities/char_2009.gif) :
:![[thin space (1/6-em)]](https://www.rsc.org/images/entities/char_2009.gif) TPU in a high-speed mixer for 8 minutes, then cool naturally to obtain a TPU-based composite powder.
TPU in a high-speed mixer for 8 minutes, then cool naturally to obtain a TPU-based composite powder.2.3 Characterization
| σ = dRvA | (1) |
3. Results and discussion
3.1 FTIR spectroscopy
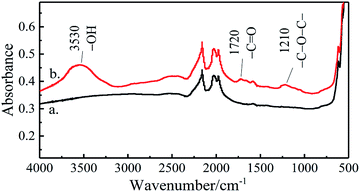
The changes in the chemical groups on the surface of the CNTs were characterized using FTIR spectroscopy. Fig. 2 shows the FTIR spectra of the CNTs before and after being treated with a mixture of acids.It can be seen from Fig. 2, the spectrum of the surface of the CNTs shows significant changes after treatment. The FTIR spectrum of the original CNTs ((a) in Fig. 2) is relatively smooth, with no obvious characteristic absorption peaks other than those expected. However, after the mixed acid treatment, spectrum (b) in Fig. 2 shows the appearance of new stretching vibration peaks for –OH at 3530 cm−1, –C![[double bond, length as m-dash]](https://www.rsc.org/images/entities/char_e001.gif) O at 1720 cm−1, and –C–O–C– at 1210 cm−1. This indicates that after treatment of the CNTs in a mixture of H2SO4 and HNO3 acids, the CNTs were broken or fracture, which increased the number of carbon atoms of the unsaturated dangling bonds contained in the CNTs, and the oxygen content generated during the decomposition of the CNTs with strong acid free radical binding increases the reactivity of the surface carbon atoms.
O at 1720 cm−1, and –C–O–C– at 1210 cm−1. This indicates that after treatment of the CNTs in a mixture of H2SO4 and HNO3 acids, the CNTs were broken or fracture, which increased the number of carbon atoms of the unsaturated dangling bonds contained in the CNTs, and the oxygen content generated during the decomposition of the CNTs with strong acid free radical binding increases the reactivity of the surface carbon atoms.
3.2 Morphology characterization of the CNTs
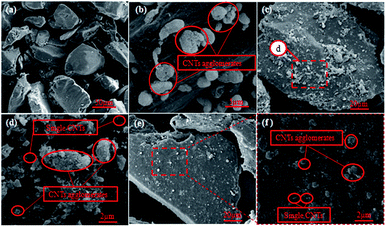
In this study, three processes (mechanical dispersion without any treatment, strong acid treatment combined with solution mixing, and strong acid treatment combined with ball milling) were assessed for the preparation of SLS composite powders and the dispersions were then observed using SEM, respectively. Fig. 3a shows that the TPU powder exhibits an irregular micromorphology. Fig. 3b shows the micromorphology of a TPU/CNT composite prepared via mechanical dispersion without any strong acid treatment, and CNT are entangled with one another and formed agglomerates.Fig. 3c shows an SEM image of a TPU/CNT composite powder prepared using CNTs that were subjected to the strong acid treatment combined with a solid solution method. Fig. 3d is a magnified view of Fig. 3c. In Fig. 3d and b, it can be seen that after strong acid treatment the aggregation of the CNTs is reduced, but long CNTs still became entangled. This is due to the large number of oxygen-containing functional groups (–COOH) on the surface of the acidified CNTs, which makes them more hydrophilic, meaning that the interaction between the polar groups in ethanol solution is greater than the interaction between the CNTs and TPU. It was found that after being submerged in ethanol for a long period of time, the dispersed CNTs agglomerate again, making it difficult to be stably and uniformly dispersed on the surface of the TPU. In addition, the heavy use of organic solvents may lead to higher costs in the preparation of the composites, as well as environmental problems.
Fig. 3e shows an SEM image of a composite powder prepared using CNTs treated with strong acid combined with ball milling dispersion, a magnified image of which can be seen in Fig. 3f. Fig. 3f shows that after strong acid treatment of the CNTs, their dispersion in the TPU matrix is more uniform, but the particles are still slightly aggregated together. The ball milling process breaks down large CNT aggregates into smaller particles and at the same time longer CNTs are sheared into shorter CNTs that attach to the TPU surface. In this work, the ball milling technique generated strong shear forces to destroy the CNT aggregates and disperse them among the TPU matrix. Compared with organic solvents, ball milling is relatively low in cost and environmentally friendly, making it more suitable for preparing composites for SLS.
3.3 DSC anaylse of TPU and the TPU/CNT composites
DSC is a standard method that is used for determining the glass transition temperature (Tg), melting point (Tm), and recrystallization temperature (Tr) of materials. For both endothermic and exothermic processes, changes in these key parameters are used to determine the preheating and processing temperatures that are required during laser sintering.23–25 As shown in Fig. 4, the TPU powder exhibits a Tg1 at 102 °C and Tm at 158 °C, the recrystallization temperature range of 46.5–77.5 °C, with a peak at 64.8 °C.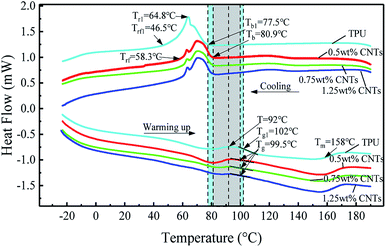 | ||
| Fig. 4 Effect of the CNT content on the thermal properties of TPU/CNT composites containing different CNT content. | ||
Compared with TPU, the recrystallization peaks of the TPU/CNT composites are relatively narrow, and their starting temperatures of recrystallization are higher than that of the TPU powder, because the CNTs act as a nucleating agent, increasing the crystallization temperature of the TPU and accelerating the crystallization process.21,26 In addition, the peaks of the TPU/CNT composites are relatively smooth and show lower Tg temperatures, which indicates an improvement in their thermal conductivity and melting efficiency, where the composites containing CNTs can more easily achieve complete melting. With the increase of CNT, the glass transition temperature (Tg) of TPU/CNT decreased slightly, but the difference was not significant, which had little influence on the processing temperature.
In the temperature range of the starting point of the recrystallization (Tr) and the glass transition temperature (Tg), a heat accumulation phenomenon occurs in the part bed during the SLS process.27 In addition, according to the SLS experiment, it can be seen that the TPU powder agglomerates more at 95 °C, and it is not easy to recover a large amount. Therefore, the SLS processing temperature is set at 92 °C. Therefore, the preheating and powder bed temperatures of the TPU and TPU/CNT composites were set at 92 °C.
3.4 Effect of the CNT content on the performance of the SLS parts
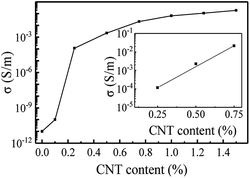
Fig. 5 shows the conductivity of TPU/CNT composites containing different contents of CNTs. At a CNT content of 0.1 wt%, little change occurs in the conductivity of the TPU/CNT composite, long distance between the conductive particles is not easy to form a conductive network, meaning that the material is an insulator. Upon an increase in the CNT content to 0.25 wt%, the conductivity of the composite suddenly rises to 10−4 s m−1, a change of nearly six orders of magnitude, and the material changes from being an insulator to a semiconductor. Upon further increasing the CNT content, the increase in the electrical conductivity gradually slows. After the CNT content is greater than 0.25 wt%, increasing the CNT content exhibits little effect on the conductivity, and the composite material becomes a conductor.According to classical percolation theory, the conductivity of a polymer composite and the effective volume content of CNTs follow a power law relationship, as described by eqn (2):
| σ = A(ω − ωc)t | (2) |
Taking the logarithm of (2) gives:
lg![[thin space (1/6-em)]](https://www.rsc.org/images/entities/char_2009.gif) σ = lg σ = lg![[thin space (1/6-em)]](https://www.rsc.org/images/entities/char_2009.gif) A + t A + t![[thin space (1/6-em)]](https://www.rsc.org/images/entities/char_2009.gif) lg(ω − ωc) lg(ω − ωc)
| (3) |
Theoretical fitting experiments were used to determine that the percolation threshold (ωc), of the composite material is 0.003, the critical parameter t is 1.61, and the critical index t value is in the range of 1.6–2.0, which indicates that the CNTs in the composite form a three-dimensional conductive network in the TPU.29 In addition, related research showed that near the percolation threshold and under the same pressure conditions, a smaller amount of conductive filler demonstrates a greater impact on the piezoresistive response of a composite. Therefore, in order to further understand the effect that the CNT content exhibits on the responsiveness of the conductive polymer, SLS was used to prepare four TPU/CNT composites with a CNT content in the range of 0.2–0.35 wt%, and their piezoresistive properties were measured.
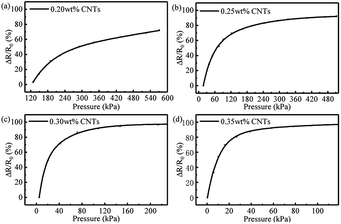
Fig. 6 shows the relationship between the pressure and relative change in the resistance of the different TPU/CNT parts. For pressure sensing, the sensitivity (S) of the element is an important factor, where the slope of the piezoresistance curve is represented as S = (ΔR/R0)/ΔP, and the relative resistance change is ΔR/R0 = (R0 − R)/R0, where R0 is the initial resistance, R is the resistance value output under different pressures, and P is the applied pressure.
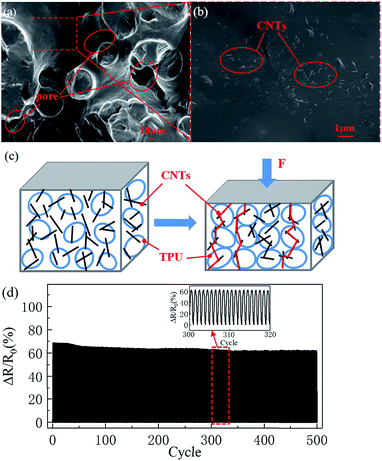
Table 1 summarizes the sensitivity of composites with different carbon nanotube contents under different pressures. As the CNT content increases, the range of detectable pressure and initial pressure decreased. Among the samples with different CNT content, the composite with the 0.35 wt% CNT content can detect an initial resistance at 0 kPa, while the 0.30, 0.25, and 0.20 wt% content samples can detect initial resistances of 5, 17, and 120 kPa, respectively. This is because in TPU/CNT sensors, CNTs are attached to the surface of TPU particles, and after laser sintering, microporous structures are formed inside the sensors (Fig. 7a and b). When the content of CNTs is small, the internal pores between them are large, the distance between CNTs is relatively long, and no conductive network is formed in the initial stage. In addition, due to the characteristics of the SLS process, the heat-affected zone at the bottom of the part will cause a slight impact on the test resistance.
| CNT content | Low loading | Middle loading | High loading | |||
|---|---|---|---|---|---|---|
| Pressure/kPa | Sensitivity | Pressure/kPa | Sensitivity | Pressure/kPa | Sensitivity | |
| 0.20 | 130–215 | 0.402 | 215–375 | 0.127 | 375–515 | 0.095 |
| 0.25 | 17–100 | 0.549 | 100–240 | 0.146 | 240–515 | 0.035 |
| 0.30 | 5–40 | 2.041 | 40–130 | 0.256 | 130–210 | 0.042 |
| 0.35 | 0–20 | 4.344 | 20–80 | 0.37 | 80–110 | 0.043 |
With the pressure increases, the resistance changes in the initial compression stage showed a linear increase (Fig. 6), because the contact points between adjacent TPU particles increased when the part was under pressure, the internal pores of the sensor shrink and the contact points between adjacent TPU particles increase, so the contact opportunities between carbon nanotubes increase, leading to a decrease in resistance. As the pressure continues to increase, the rate of resistance change increases slowly and the sensitivity decreases. As the pressure continues to increase, the contact area between adjacent TPU particles gradually tends to balance, the formation and destruction of the conductive network structure gradually saturates, and the resistance value of the composite material gradually stabilizes. In this paper, to better identify pressure changes, when sensitivity is too small (<0.05 kPa−1), is the ultimate pressure of the sensing element. Therefore, the detectable pressure range of 0.25–0.35 wt% CNT/TPU parts is 17–300 kPa, 5–130 kPa and 0–80 kPa respectively. In addition, due to the limited range of the press, the measuring pressure range of 0.2 wt% CNT/TPU parts is 130–515 kPa.
In terms of the four composites, when the CNT content is 0.25 wt%, the loading pressure that makes the resistance value of the corresponding composite material tend to saturate is greater, and the resistance signal that can be detected under the current experimental conditions can be generated when the pressure is lower. The prepared pressure sensing component exhibits a wider range and also exhibits good sensitivity and resolution, making it more suitable for use in the design of a pressure sensor. In actual applications, composite materials with different proportions of materials can be selected according to required pressure to be measured, and measurements can thus be made in different ranges in a targeted manner. Finally, cyclic test was conducted to evaluate its applicability during long-term cycle. As shown in Fig. 7d, the strain sensing pattern kept stable, and there is less than 6.51% repeatability error during 500 cycles (10% strain, 5 mm min−1). It can be found that the ΔR/R0 shows excellent recoverability resulting from the good elasticity and compressibility of the TPU/CNT parts. All of these indicate the high repeatability, stability and durability of the piezoresistive sensing performance. To the sensor performance comparison, Table 2 shows the recent reports of piezoresistive pressure sensor and pressure sensitivity measurement range compared with other main parameters, such as pressure sensors, TPU/CNT sensor has high sensitivity, good stability, response to a wide range of advantages, but in a small pressure, without resistance response in the later work, will continue to optimize SLS process parameters and post-processing, and improve the response time, broaden the pressure measurement range.
| Materials | Sensitivity/kPa−1 | Pressure range/kPa | Dimension/mm | Characteristics | Ref number |
|---|---|---|---|---|---|
| TPU/CNT composites | 0.12–0.549 | 17–240 | Φ 20 × 4 | High sensitivity, good stability, wide response range | This manuscript |
| MWCNT and TPU loaded silicone rubber-coated PU foam | 0.013–0.032 | 0–200 | 10 × 10 × 10 | Wide range, high repeatability, robustness | 9 |
| CNT/PI composite aerogel | 11.28 | 0–61 | Φ 12.5 × 10 | High sensitivity, high repeatability, fast response time | 10 |
| MWNT/PU composites | 4.282 | 0–63 | — | High repeatability, good stability, high sensitivity | 31 |
| MWCNT and rGO loaded PU foam | 0.034–0.088 | 0–48.8 | 13 × 8 × 5 | High repeatability, fast response time | 32 |
| rGO and PANI NW loaded melamine foam | 0.42–0.152 | 0–27 | 20 × 10 × 5 | Tunable sensitivity, fast response time, high repeatability | 33 |
| MWCNT loaded PDMS foam | 0.9 | 0–50 | 10 × 10 × 10 | High sensitivity, wide range, poor repeatability | 34 |
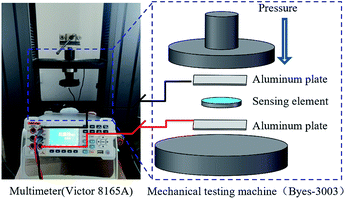
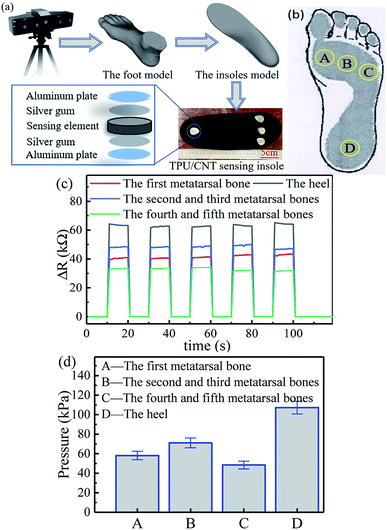
Recently, 3D-printed insoles have drawn an increasing attention and have been commercialized due to their customized features and excellent comfortableness. However, the complex manufacturing process makes the production challenging. The SLS technology could fabricate the designed shapes to conform the curvilinear surface of the foot and might yield improved comfort comparable to previously reported sensor insoles.30 As shown in Fig. 8a, a digital model of the insole is produced by a three-dimensional scanner combined with reverse engineering technology, and printed according to the path generated by the corresponding digital model to obtain a sensing insole. The sensing insole was printed by TPU/CNTs containing 0.25 wt% CNTs, sandwiched between silver gum and aluminum plates to form four pressure sensor, where the sensors were placed to make contact with the first metatarsal bone, the second and third metatarsal bones, the fourth and fifth metatarsal bones, and the heel (as shown in Fig. 8b), to detect the four main positions of plantar pressure distribution in the human foot. The four sets of electrodes drawn from the pressure sensors were connected to a high-precision multimeter, and the resistance signals of plantar pressure were collected.
Before the test, the sensor insole was placed on the pressure loading platform, and the single point pressure loading experiment was carried out on the four test points respectively. The loading force can be controlled by the controller, and the resistance change of the sensor can be recorded for each load of 10 N, and the pressure load of the four test points can be calibrated. During the test, the subjects took off their shoes and put on socks, and stood on the sensing insole with one foot. The test time was 9–10 s and performed for 5 times, the results were input into a computer, the data were fitted to measure the pressure experienced by each part of the sole of the foot.
Fig. 8c shows the curves of the dynamic changes in the resistance of each sensor under the pressure of a foot of a volunteer standing on an insole containing the sensors. When the volunteer stepped on the sensors, the resistance values of the sensing elements dropped sharply, whereas when the volunteer raised their foot, the resistance value increased. The sensors placed at the different test points experience different pressures, so the changes in resistance are different at each of the test points. The greater the pressure, the greater the change in the resistance value. According to the data fitting, the pressure at each test point can be measured.
As shown in Fig. 8d, under the pressure of the volunteer, of the four test points, the pressure at the heel was determined to be the greatest, at around 107.39 kPa, followed by the second and third metatarsal bone, the first metatarsal bone, and the fourth and fifth metatarsal bones experience the least amount of stress, results that are essentially the same as the plantar pressure distribution recorded in healthy people reported in a study by Veves et al.35 Therefore, it has been demonstrated that the SLS processing of TPU/CNT composite materials to make flexible pressure sensing elements for use in wearable electronics and human–computer interactions is feasible, which are of great significance for measuring biological and motion signals and can be adapted to different parts of the human anatomy.
4. Conclusion
In this study, CNTs were processed via acid treatment and then processed via ball milling and solution mixing before being used to prepare TPU/CNT composites suitable for SLS treatment. The changes in the surface functional groups of CNTs pretreated using a mixture of concentrated acids and how different amounts of CNTs affect their dispersion via ball milling them into a TPU matrix were analyzed using FTIR spectroscopy and SEM measurements. By carrying out DSC measurements and practical sintering experimental analysis, the preheating window and processing temperatures suitable for the TPU/CNT composite powder were found to be 92 °C.SLS experiments were performed on the composite materials containing different amounts of CNTs, and the resulting SLS components were then tested in terms of their conductivity and piezoresistance. A comparison of composites containing different amounts of CNTs showed that when the CNT content is 0.25 wt%, the sensing component reaches the percolation threshold of the composite material, and when a low pressure is applied, detectable resistance signals can be generated. The TPU/CNT composites with this content (0.25 wt% CNT) exhibits a wider range (17–240 kPa) than the other composites and high sensitivity (0.12–0.549 kPa−1), making it the most suitable material for use in a pressure sensing application.
Many factors that affect the pressure sensing performance of SLS parts exist. In addition to the main factors mentioned above, the performance and accuracy of SLS equipment, process parameters, and post-processing processes affect the sensing performance of the fabricated component. Therefore, in order to obtain better performance of the fabricated pressure sensor, further experiments are required to determine the optimal combination of the aforementioned factors.
Conflicts of interest
There are no conflicts to declare.Acknowledgements
This study was supported by Fundamental Research Funds for the Central Universities (2572019AB20), the Key National Research and Development Programs (2017YFD0601004), “Double First-Class” Fund of Northeast Forestry University (41113253) and the Key Projects of Provincial Fund (ZD2017009).References
- P. Ciselli, L. Lu, J. J. C. Busfield and T. Peijs, e-Polymers, 2010, 10, 1 Search PubMed
.
- S. Blazewicz, B. Patalita and P. Touzain, Carbon, 1997, 35, 1613–1618 CrossRef CAS
.
- H. A. K. Toprakci, S. K. Kalanadhabhatla, R. J. Spontak and T. K. Ghosh, Adv. Funct. Mater., 2013, 23, 5536–5542 CrossRef CAS
.
- J. J. Ku-Herrera and F. Avilés, Carbon, 2012, 50, 2592–2598 CrossRef CAS
.
- N. Hu, Y. Karube, M. Arai, T. Watanabe, C. Yan, Y. Li, Y. Liu and H. Fukunaga, Carbon, 2010, 48, 680–687 CrossRef CAS
.
- T. Yasuoka, Y. Shimamura and A. Todoroki, Adv. Compos. Mater., 2010, 19, 123–138 CrossRef CAS
.
- S. Zhang, K. Sun, H. Liu, X. Chen, Y. Zheng, X. Shi, D. Zhang, L. Mi, C. Liu and C. Shen, Chem. Eng. J., 2020, 387, 124045 CrossRef
.
- H. Liu, Q. Li, Y. Bu, N. Zhang and C. Shen, Nano Energy, 2019, 66, 104143 CrossRef CAS
.
- J. Lee, J. Kim, Y. Shin and I. Jung, Composites, Part B, 2019, 177, 107364 CrossRef CAS
.
- X. Y. Chen, H. Liu, Y. J. Zheng, Y. Zhai, X. H. Liu, C. T. Liu, L. W. Mi, Z. H. Guo and C. Y. Shen, ACS Appl. Mater. Interfaces, 2019, 11, 42594–42606 CrossRef CAS PubMed
.
- R. Yin, S. Yang, Q. Li, S. Zhang and C. Shen, Sci. Bull., 2020, 65, 899–908 CrossRef CAS
.
- F. Calignano, D. Manfredi, E. P. Ambmbrosio, S. Biamino, M. Lombmbardi, E. Atzeni, A. Salmi, P. Minetola, L. Iuliano and P. Fino, Proc. IEEE, 2017, 105, 593–612 CAS
.
- T. Jiang, Y. S. Cheng, H. H. Cui and N. Dai, Machine Tool & Hydraulics, 2018, vol. 46, pp. 154–160 Search PubMed
.
- Y. Q. Yu, Y. L. Guo, T. Jiang, K. Y. Jiang, J. Li and S. Guo, RSC Adv., 2017, 7, 23176–23181 RSC
.
- M. R. Chang, Master Dissertation, Tiangong University, 2018
.
- W. R. Small and M. I. H. Panhuis, Small, 2007, 3, 1500–1503 CrossRef CAS PubMed
.
- C. Z. Yan, Y. S. Shi, J. S. Yang and J. H. Liu, Rapid Prototyp. J., 2011, 17, 28–36 CrossRef
.
- O. Meincke, D. Kaempfer, H. Weickmann, C. Friedrich, M. Vathauer and H. Warth, Polymer, 2004, 45, 739–748 CrossRef CAS
.
- M. F. Peng, Master Dissertation, Wuhan Institute of Technology, 2017
.
- Z. Q. Zhou, Master Dissertation, Nanchang University, 2017
.
- Z. Y. Zhang, Y. H. Chen, F. W. Qi and N. Chen, Polym. Mater. Sci. Eng., 2017, 33, 122–127 CAS
.
- R. P. Luo, Master Dissertation, East China University of Science and Technology, 2013
.
- S. Yuan, J. Bai, C. K. Chua, J. Wei and K. Zhou, Polymers, 2016, 8, 370 CrossRef PubMed
.
- S. Yuan, J. Bai, C. K. Chua, K. Zhou and J. Wei, Journal of Computing and Information Science in Engineering, 2016, 16, 4 CrossRef
.
- S. Berretta, K. E. Evans and O. R. Ghita, Mater. Des., 2016, 105, 301–314 CrossRef CAS
.
- J. Bai, R. D. Goodridge, R. J. M. Hague and M. Song, Polym. Eng. Sci., 2013, 53, 1937–1946 CrossRef CAS
.
- Y. Q. Yu, PhD Dissertation, Northeast Forestry University, 2019
.
- M. Weber and M. R. Kamal, Polym. Compos., 1997, 18, 711–725 CrossRef CAS
.
- W. J. Chen, PhD Dissertation, Lanzhou University, 2014
.
- B. Chen, W. Tang, T. Jiang, L. Zhu, X. Chen, C. He, L. Xu, H. Guo, P. Lin, D. Li, J. Shao and Z. L. Wang, Nano Energy, 2018, 45, 380–389 CrossRef CAS
.
- Y. He, Y. Ming, W. Li, Y. Li, M. Wu, J. Song, X. Li and H. Liu, Sensors, 2018, 18, 1338 CrossRef PubMed
.
- A. Tewari, S. Gandla, S. Bohm, C. R. McNeill and D. Gupta, ACS Appl. Mater. Interfaces, 2018, 10, 5185–5195 CrossRef CAS PubMed
.
- G. Ge, Y. Cai, Q. Dong, Y. Zhang, J. Shao, W. Huang and X. Dong, Nanoscale, 2018, 10, 10033–10040 RSC
.
- R. Iglio, S. Mariani, V. Robbiano, L. Strambini and G. Barillaro, ACS Appl. Mater. Interfaces, 2018, 10, 13877–13885 CrossRef CAS PubMed
.
- A. Veves, D. J. S. Fernando, P. Walewski and A. J. M. Boulton, The Foot, 1991, 1, 89–92 CrossRef
.
| This journal is © The Royal Society of Chemistry 2020 |

