 Open Access Article
Lignin nanoparticles are renewable and functional platforms for the concanavalin a oriented immobilization of glucose oxidase–peroxidase in cascade bio-sensing†
Eliana Capecchia,
Davide Piccininoa,
Elisabetta Tomainoa,
Bruno Mattia Bizzarri a,
Francesca Pollib,
Riccarda Antiochiab,
Franco Mazzeib and
Raffaele Saladino
 *a
*a
aDepartment of Biological and Ecological Sciences (DEB), University of Tuscia, via S. Camillo de Lellis, 01100 Viterbo, Italy. E-mail: saladino@unitus.it
bDepartment of Chemistry and Drug Technologies, Sapienza University of Rome, P.le Aldo Moro 5, Rome, 00185, Italy
First published on 5th August 2020
Abstract
Lignin nanoparticles (LNPs) acted as a renewable and efficient platform for the immobilization of horseradish peroxidase (HRP) and glucose oxidase (GOX) by a layer by layer procedure. The use of concanavalin A as a molecular spacer ensured the correct orientation and distance between the two enzymes as confirmed by Förster resonance energy transfer measurement. Layers with different chemo–physical properties tuned in a different way the activity and kinetic parameters of the enzymatic cascade, with cationic lignin performing as the best polyelectrolyte in the retention of the optimal Con A aggregation state. Electrochemical properties, temperature and pH stability, and reusability of the novel systems have been studied, as well as their capacity to perform as colorimetric biosensors in the detection of glucose using ABTS and dopamine as chromogenic substrates. A boosting effect of LNPs was observed during cyclovoltammetry analysis. The limit of detection (LOD) was found to be better than, or comparable to, that previously reported for other HRP–GOX immobilized systems, the best results being again obtained in the presence of a cationic lignin polyelectrolyte. Thus renewable lignin platforms worked as smart and functional devices for the preparation of green biosensors in the detection of glucose.
Introduction
Lignin nanoparticles (LNPs), the most abundant and renewable polyphenol in nature,1–4 have received great attention due to the emergence of novel rheological and chemo–physical properties with respect to the amorphous counterpart.5–8 These properties are associated with π–π supramolecular organization of the polymer chain during the nanostructuration process, yielding head-to-tail (J-type)9,10 and tail-to tail (H-type)11 aggregates of the aromatic moieties. The π–π interactions favor the occurrence of electron and charge transfer processes12,13 providing novel redox and chemical patterns. For this reason, LNPs have been applied as renewable and functional platform for the immobilization of redox enzymes, such as laccase,14 tyrosinase,15 and horseradish peroxidase,16 and of hydrolase.17 LNPs exerted a specific boosting effect in the case of laccase by both long-range electron transfer (pseudo-DET) and mediated electron transfer (MET) mechanisms.18 Similarly, lignin boosted the activity of monooxygenase in the degradation of recalcitrant polyphenols thanks to the formation of low molecular weight frameworks19 as diffusible redox mediators.20,21 The immobilization of enzymatic cascade is a relevant tool to achieve complex molecular architectures mimicking the natural spatial organization of the enzymes in the cell.22–25 Intrinsic advantages of these supramolecular arrangements are an improved catalytic efficacy,26 the fast transportation of key intermediates between the active sites,27 and the limitation of the occurrence of mass transfer diffusion barriers.28 In this way, activity, selectivity, stability, and reusability of the enzymatic cascade is optimized.29The reciprocal orientation of the active site in the cascade is an important feature to control the overall activity of the system.30 For this reason, specific molecular spacers and linkers are used31,32 for orienting the enzymes in the proper way.33
Here we report that LNPs are green and suitable platform for the immobilization of the enzymatic cascade of Horseradish Peroxidase (HRP) and Glucose Oxidase (GOX)34,35 in biosensing applications.36,37 To the best of our knowledge, only examples of the use of hybrid systems encompassing unstructured lignin and metal oxides have been previously reported for the immobilization of GOX.38,39 The correct orientation of the two enzymes during the immobilization process was obtained by the use of the lectin Concanavalin A (Con A), able to selectively interact with the carbohydrate part of both HRP and GOX.40 Since the carbohydrate component of glycoproteins is usually far from the active site of the enzyme, the use of Con A ensures the retention of the enzymatic activity, sometimes enhancing the performance of the system.41,42 The effectiveness of Con A in the immobilization of HRP alone on LNPs has been recently reported, focusing on bio-desulfurization processes.16 The overall immobilization procedure of the enzymatic cascade was based on two different approaches: (i) direct adsorption on the surface of LNPs; (ii) layer by layer (LbL) mediated adsorption in the presence of cationic polyelectrolytes including poly(diallyl dimethylammonium chloride) (PDDA), chitosan (CH) and cationic lignin (CATLIG). These polyelectrolytes have been selected on the basis of their previous application in the coating of LNPs,8,14 two of them (PDDA and CH) being also reported in the formation of aggregates with Con A.43,44 CATLIG is the cationic form of lignin with relevant application in the stabilization of pickering emulsions45 and in the immobilization of different enzymes.16–18 Förster resonance energy transfer (FRET) measurement46 confirmed the co-immobilization of HRP and GOX on LNPs, the two enzymes being located at the optimal distance. The application of natural and renewable polyelectrolytes CH and CATLIG is in accordance with the development of a full green system. LNPs showed a boosting effect in the electrocatalytic activity of the enzymatic cascade as evaluated by cyclic voltammetry analysis. The biosensing application of immobilized HRP/GOX enzymatic cascade has been measured by the colorimetric detection of β-D-glucose using two chromogenic substrates, 2,2′-azinobis-(3-ethylbenzothiazoline-6-sulfonic acid) (ABTS) and dopamine. The limit of detection (LOD) was found to be better than, or comparable to, that previously reported for other HRP/GOX immobilized systems.
Results and discussion
Procedure for the immobilization of HRP and GOX on LNPs
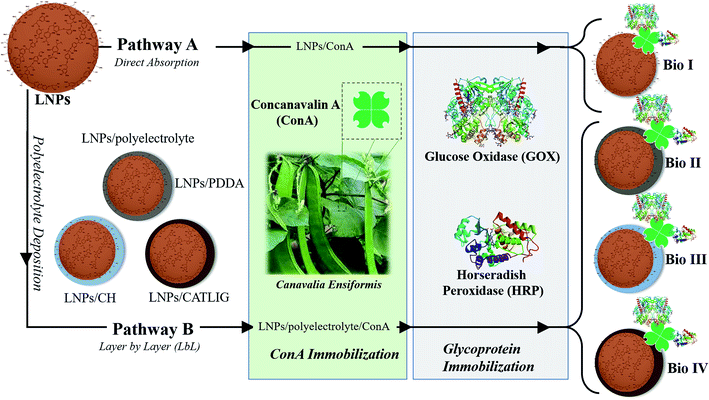
LNPs have been prepared starting from commercially available organosolv lignin by applying the nanoprecipitation procedure.47 Briefly, a solution of the raw lignin in tetrahydrofuran (THF) was rapidly added to deionized water with instantaneous formation of the nanoparticles18 (scanning electron microscopy image of LNPs is reported in ESI SI #1, Fig. S1†). The immobilization procedure of HRP and GOX is reported in Scheme 1. In the first case (pathway A), Con A from jack beans (Canavalia ensiformis) was adsorbed on the surface of LNPs by treating the nanoparticles (1.5 mg mL−1) in sodium phosphate buffer (PBS, 1.0 mL; pH 7.3, 0.1 M) with different concentration of Con A (from 0.2 mg mL−1 to 1.0 mg mL−1) in the same buffer (1.0 mL) at 25 °C. The tetrameric configuration of Con A necessary for the molecular recognition of glycoproteins was preserved by buffering the pH of the system (pH 7.3).48The efficacy of the adsorption of Con A was evaluated by the Bradford assay on the residual solution after removal of the nanoparticles.49 The interaction between lectins and polyphenols is reported, mainly focusing on their relevance for nutraceutical aspects.50
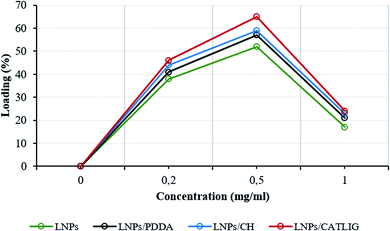
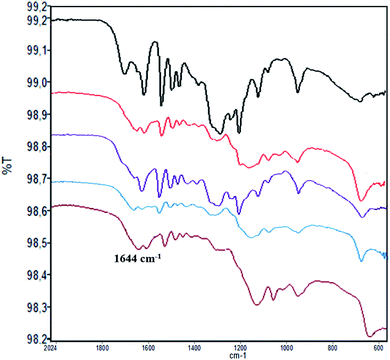
The loading factor (% in weight) of Con A on LNPs is reported in Fig. 1. The highest efficacy in the immobilization process was obtained starting from 0.5 mg mL−1 of Con A (Fig. 1, green line). Attenuated total reflection Fourier transform infrared (ATR FT-IR) analysis confirmed the effectiveness of the immobilization of Con A on LNPs, as shown by the appearance of the amide I band in the spectrum (1.644 cm−1) associated to the characteristic stretching amide vibrational mode (amide II band) (Fig. 2). The LNPs/Con A intermediate (1.5 mg mL−1) in PBS (1.0 mL) was treated with HRP (2.5 mg mL−1) and GOX (5.0 mg mL−1) in PBS (20 μL) at 4.0 °C, applying the optimal HRP/GOX ratio value previously reported for the co-immobilization of the two enzymes on Con A in homogeneous conditions51 to yield LNPs/Con A/HRP–GOX system Bio I.
As an alternative, LNPs were coated with cationic polyelectrolyte to favor the electrostatic interaction with negative charged Con A (ζ-potential, −14 mV (ref. 52)) (Scheme 1, pathway B). LNPs (1.0 mg mL−1) in deionized water (1.0 mL) were treated with the appropriate polyelectrolyte poly (diallyl dimethylammonium chloride) (PDDA), chitosan (CH), and cationic lignin (CATLIG) (1.0 mg mL−1, 0.5 mg mL−1, and 0.1 mg mL−1, respectively), in deionized water (1.0 mL) at 25 °C under orbital shaking. The optimal concentration of the polyelectrolyte was selected on the basis of previous reported data.8,18
The intermediates, LNPs/PDDA, LNPs/CH and LNPs/CATLIG (1.5 mg mL−1) in PBS (1.0 mL) were added with different concentration of Con A (from 0.2 mg mL−1 to 1.0 mg mL−1) in the same buffer (1.0 mL) at 25 °C. The highest loading values were obtained in the presence of 0.5 mg mL−1 of Con A irrespective to the nature of the polyelectrolyte (Fig. 1), CATLIG being the best support for all of the tested concentrations. Dynamic light scattering (DLS) data for original LNPs, LNPs/CATLIG and LNPs/CATLIG/Con A, as selected examples, are reported in the ESI (SI #2) and in Fig. S2.† LNPs showed an average size of diameter of 219 nm.53 After the deposition of CATLIG the diameter value was slightly increased to 234 nm, reaching the value of 244 nm in the presence of Con A. This trend was in accordance with previous reported data.42,45 The optimal value of concentration of Con A was then selected for the further study. The presence of the polyelectrolyte generally increased the efficacy of the Con A loading.
ATR FT-IR analysis of LNPs/polyelectrolyte/Con A intermediates confirmed the presence of Con A (Fig. 2) (ATR FT IR spectra of LNPs/polyelectrolyte intermediates are reported in SI #3, Fig. S3†).
The successive treatment of LNPs/polyelectrolyte/Con A intermediates (1.5 mg mL−1) in PBS (1.0 mL) with HRP (2.5 mg mL−1) and GOX (5.0 mg mL−1) in PBS (20 μL) at 4.0 °C afforded LNPs/PDDA/Con A/HRP–GOX Bio II, LNPs/CH/Con A/HRP–GOX Bio III, and LNPs/CATLIG/Con A/HRP–GOX Bio IV, respectively (Scheme 1). The scanning electron microscopy images of Bio I–IV are reported in Fig. 3 (panel A–F). Bio I–IV showed a regular spherical shape after the deposition procedure. The magnification of Bio I and Bio IV highlight the typical corona-like structural motif associated to Con A.41
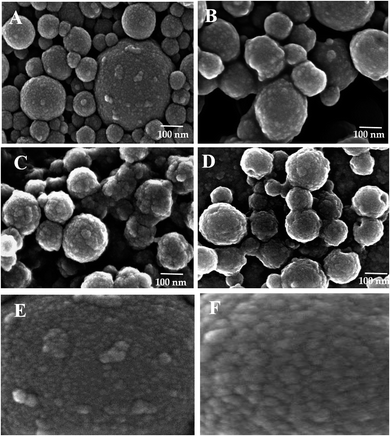 | ||
| Fig. 3 Scanning electron microscopy images of Bio I (panel A), Bio II (panel B), Bio III (panel C), and Bio IV (panel D). Panel E and F: magnification (×800 K) of Bio I and Bio IV, respectively. | ||
Activity parameters and kinetic data of Bio I–IV
The activity parameters and kinetic data of Bio I–IV are reported in Table 1. The data were recorded following the activity of HRP as a quantitative marker of the overall enzymatic cascade process, firstly activated by the GOX oxidation of β-D-glucose to β-D-glucone lactone with concomitant production of hydrogen peroxide (H2O2).54 The efficacy of HRP in the reduction of H2O2 was then measured by the 2,2′-azinobis-(3-ethylbenzothiazoline-6-sulfonic acid) (ABTS) assay,51,55 following the concentration of the corresponding ABTS radical cation (415 nm) at 25 °C, and working at the optimal pH value for the activity of both HRP and GOX (pH 7.0).56 The selection of HRP as representative component of the HRP–GOX cascade system is widely reported, the two enzymes having similar reaction rates.57,58 The activity yield and immobilization yield were determined using eqn (1) and (2), respectively:| Activity yield (%) = [Ux/(Ua − Ur)] × 100 | (1) |
| Immobilization yield (%) = [(Ua − Ur)/Ua] × 100 | (2) |
| Entry | Sample | Immobilization yield (%) | Activity yield (%) | Kmc (mM) | Vmaxc (μmol L−1 s−1) | Kcatc (s−1) |
|---|---|---|---|---|---|---|
| a Bio I: LNPs/Con A/HRP–GOX; Bio II: LNPs/PDDA/Con A/HRP–GOX; Bio III: LNPs/CH/HRP–GOX; Bio IV: LNPs/CATLIG/HRP–GOX.b Con A/HRP–GOX was used as reference.49c Kinetic data (Km, Vmax and Kcat) were analyzed by GraphPad software. Average errors in kinetic parameters were 2–4% for Km, 1–3% for Vmax and 1–2% for Kcat. The experiments were carried out in triplicate. | ||||||
| 1 | Con A/HRP–GOXb | — | — | 17.26 | 0.12 | 594 |
| 2 | Bio I | 88 | 52 | 8.72 | 0.10 | 563 |
| 3 | Bio II | 91 | 51 | 4.77 | 0.07 | 284 |
| 4 | Bio III | 93 | 55 | 8.30 | 0.13 | 576 |
| 5 | Bio IV | 96 | 61 | 4.85 | 0.15 | 652 |
Temperature and pH stability, and reusability assay
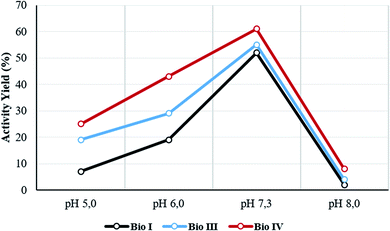
The temperature and pH stability, and reusability assay, were evaluated for the most active Bio I, III and IV. The activity yield for the selected samples was measured at 60 °C and at different pH values (from pH 5 to pH 8). Data are reported in Table 2 and Fig. 4, respectively. The systems showed a high thermal stability (from 85% to 99% of retained activity, respectively), Bio IV being the most stable device (Table 2, entries 1–3). As reported in Fig. 4, irrespective from the experimental conditions, the optimal value of the activity yield was observed in the range of pH value between 6.0 and 7.5, the highest performance being always obtained at pH 7.3. Again, Bio IV performed as the best system. The time stability of the most active system Bio IV was evaluated by measuring the activity of the system after 30 days of storage in PBS solution at 5 °C. Under these experimental conditions, Bio IV retained the original activity (Table 2, entry 3).| Entry | Sample | Activity yield (%) | ||||||
|---|---|---|---|---|---|---|---|---|
| 25 °C | 60 °C | Reusabilitya (%) | ||||||
| Run 1 | Run 2 | Run 3 | Run 4 | Run 5 | ||||
| a The experiment was performed by recovery of Bio I, III and IV analyzing their reuse for five runs with freshly prepared glucose and ABTS solutions in PBS (pH 7.0, 0.1 M).b Activity of Bio IV after 30 days of storage in PBS solution at 5 °C. | ||||||||
| 1 | Bio I | 52 | 44 | 42 | 31 | 28 | 25 | 23 |
| 2 | Bio III | 55 | 53 | 44 | 39 | 34 | 31 | 30 |
| 3 | Bio IV | 61 (60)b | 60 | 59 | 57 | 55 | 54 | 52 |
The reusability of Bio I, III and IV was then evaluated by recovering the sample at the end of the oxidation, followed by washing and successive new runs. The systems maintained a significative activity yield after five runs (Table 2, reusability expressed in % with respect to the initial value), the better result being obtained with Bio IV (52% of the initial activity).
Electrochemical characterization
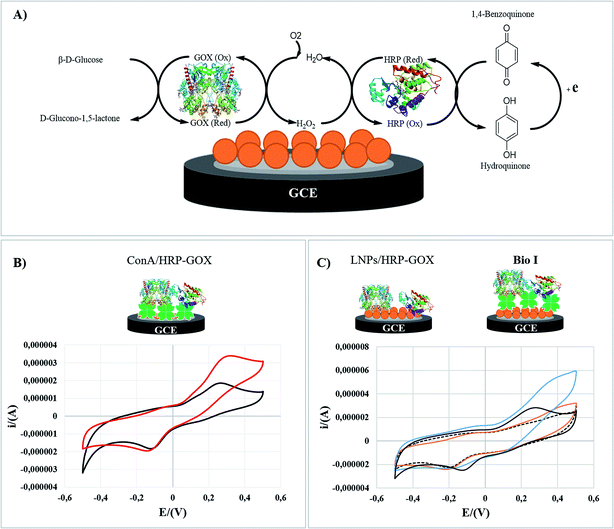
Bio I was analyzed by cyclic voltammetry (CV) as a representative example to elucidate the role of Con A in the electrocatalytic activity of the enzymatic cascade after the immobilization on LNPs. The electrochemical behavior of original LNPs (SI #5†) was in accordance with data previously reported.70,71 The experiments were performed in hydroquinone solution (H2Q) as electroactive mediator (1.0 × 10⁻⁴ M, PBS, 50 mM; pH 7.0), in the absence and presence of glucose (1.0 × 10⁻² M) (the detailed procedure is reported in the experimental part). Cyclic voltammograms (CVs) have been recorded with a glassy carbon electrode (GC) reproducing Bio I, as shown in Fig. 5 (panel C). The overall bioelectrode performance was regulated by the oxidation of H2Q to 1,4-benzoquinone on the electrode surface, following the cascade reaction of HRP and GOX. The schematic representation of the enzymatic transformations occurring at the surface of the GC electrode is reported in Fig. 5 (panel A).Con A/HRP–GOX (panel B) and LNPs/HRP–GOX (panel C) have been used as references. The electrochemical response of each system was compared with that obtained in the absence of glucose, corresponding to the cyclic voltammograms of H2Q alone (black curves, panels B and C). The voltammetry curves of LNPs/HRP–GOX and Bio I in the absence of glucose showed a similar behavior, Bio I showing a slightly higher electrochemical responsiveness. The cyclic voltammogram of Con A/HRP–GOX with H2Q solution showed an irreversible behavior as highlighted by the separation between the cathodic and anodic peaks (c.a. 360 mV; panel B, black curve). However, in the presence of LNPs/HRP–GOX and Bio I the electrochemical behavior appeared to be more reversible, with a peak-to-peak potential separation of about 150 mV, indicating the occurrence of a quasi-reversible two-electron transfer reaction (panel C, black curve). The anodic and cathodic peak currents were linearly related to ν1/2, thus meaning a typical diffusion-controlled process (data not shown). The diffusion coefficient (D) was calculated to be 5.2 × 10⁻⁴ cm2 s−1, higher than that reported in the literature for a bare glassy carbon electrode.72 Hence, LNPs increased the electrochemical performance independently from the presence of Con A.
This result can be ascribed to the electrochemical responsiveness of LNPs, which allows a better electron transfer mechanism at the electrode surface.73 Successively, the electrocatalytic activity of the three systems was studied by adding glucose. The Con A/HRP–GOX showed a clear electrocatalytic responsiveness in the presence of glucose, confirming the retained activity of HRP and GOX after immobilization of Con A (Fig. 5, panel B. red curve).
The beneficial role of Con A was further highlighted by the comparison of the CVs of Bio I and LNPs/HRP–GOX (Fig. 5, panel C). In this latter case, the presence of Con A assured the highest electrocatalytic effect (blue curve), a slight electrochemical responsiveness being observed for the LNPs/HRP–GOX counterpart (orange curve). Note that LNPs played a boosting effect in the activity of the overall system, the CV of Bio I showed an electrocatalytic effect higher than simple Con A/HRP–GOX (Fig. 5, panel C versus panel B). Boosting effect exerted by lignin on the activity of oxidases are reported in literature.19 Probably, this effect may be due to the improved stability of the system, even if the amplification of the electrochemical signal by electron transfer processes occurring in the aromatic structure of LNPs cannot be completely ruled out.12,13
Förster resonance energy transfer (FRET) analysis
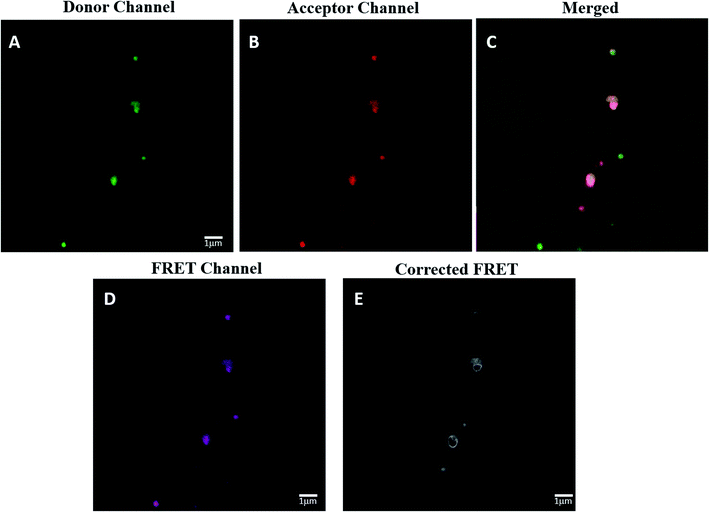
The spatial distance between HRP and GOX in the most active Bio IV was determined by confocal laser scanning microscopy (CLSM) analysis associated to Förster resonance energy transfer (FRET) effect (Fig. 6, panel A–D). FRET signal in CLSM occurs between two proximately located fluorophores via non-radiative dipole–dipole coupling as a consequence of the energy transfer between a donor and an acceptor dye in close proximity (3–10 nm).74 The application of the FRET analysis in the study of bio-molecular conformation, protein–protein interaction and molecular motor devices has been reported.75,76 In the case of Bio IV, HRP was labeled with fluorescein isothiocyanate (FITC) as donor, while GOX was labeled with rhodamine B (RhoB) and worked as the acceptor counterpart.77 The labelling procedure of HRP and GOX is reported in SI #6.†The effective presence of FITC-HRP in Bio IV was detected in the donor channel mode at 490 nm (Fig. 6 panel A, green fluorescence signal), while that of RhoB–GOX was detected in the acceptor channel mode at 560 nm (Fig. 6 panel B, red fluorescence signal). The effective co-localization of HRP–GOX in Bio IV was highlighted by the presence of the merged fluorescent signal (Fig. 6, panel C). The original and corrected FRET signals of Bio IV (Fig. 6, panel D and E, respectively) were used to calculate the average distance between the donor and the acceptor moieties (details for the FRET calculation are reported in SI #6†). HRP and GOX were located at the distance of 7.0 nm, a value that is comprised in the range of reported optimal distances for the activity of the enzymatic cascade.62
Evaluation of Bio I, III and IV as colorimetric biosensor
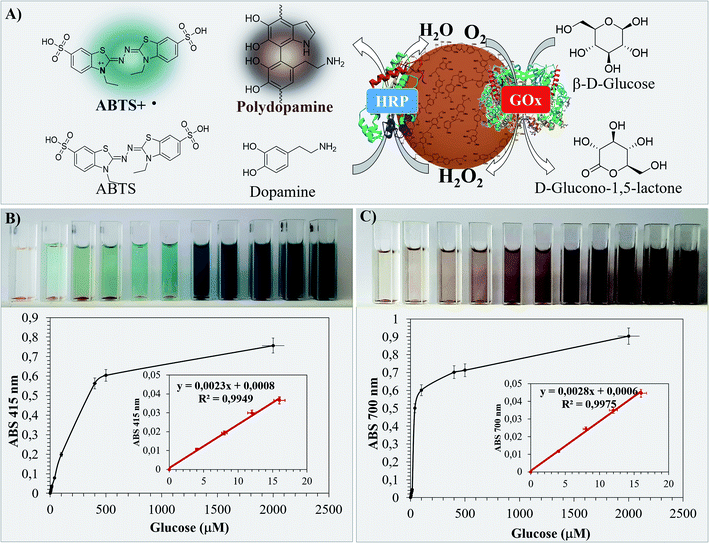
The performance of Bio I, III and IV as colorimetric biosensors was first evaluated by using the ABTS assay.51 Briefly, the appropriate sample (1.0 mg) in PBS (0.1 M, pH 7, 3.0 mL) was treated with ABTS (0.5 mM, 0.1 mL) in the presence of different concentrations of β-D-glucose (from 4.0 μM to 2000 μM). The absorbance of the ABTS radical cation produced during the HRP–GOX oxidation was monitored at 415 nm after 30 min at 25 °C. The data of the most active Bio IV are reported in Fig. 7, corresponding data for Bio I and Bio III are in SI #7.† The homogeneous HRP–GOX mixture (same ratio value than that used for the bio systems) and Con A/HRP–GOX were used as references. The color of the solution changed significantly during the addition of β-D-glucose from pale azure to deep blue and dark indigo (Fig. 7, panel B). The variation of the absorbance with respect to β-D-glucose concentration was used for the determination of the limit of detection (LOD), taking into account the linear part of the curve.78 The linear trend of Bio IV was found to be comprised between 4.0 μM and 16 μM, corresponding to a linear correlation coefficient R2 = 0.9949 and a LOD value of 1.21 μM (Table 3, entry 5). Bio IV showed a LOD value lower than Bio I, Bio III and references (Table 3, entry 5 versus entries 1–4). This result confirmed the relevance of the ordered deposition of the two enzymes on the lignin platform. Note that the shape of Bio IV particles was unchanged after the biosensing application, as evaluated by SEM analysis (SI #8, Fig. S6†).As an alternative, the LOD was evaluated by following the oxidation of L-dopamine as a natural chromogenic compound. The oxidation of L-dopamine by HRP and H2O2 to yield black poly-dopamine in quantitative yield has been reported.79 In this latter case the LOD was found to be significantly lower than that obtained with other standard chromogenic compounds.80 The oxidation of L-dopamine with Bio IV was performed under the experimental conditions previously reported for ABTS. The colorimetric variation during the addition of β-D-glucose and the respective absorbance values at 700 nm are in Fig. 7 (panel C) (LOD values of Bio I and Bio III are in Table 3, the corresponding absorbance curves are in SI #7†). As reported in Table 3, Bio IV showed lower LOD value with respect to the ABTS assay. Again, the LOD of Bio IV was lower than that of Bio I and Bio III, and of the two reference systems (Table 3, entry 5 versus entries 1–4).
Experimental
Materials
Organosolv lignin (OL), were purchased from Chemical Point (Oberhaching, Germany). Glucose oxidase (GOX, from Aspergillus niger, 160 kDa, catalytic activity according to producer specification is 100–250 U per mg), horseradish peroxidase (HRP, from Armoracia Rusticana, 44 kDa, catalytic activity according to producer specification is 173 U per mg), concanavalin A (Con A, from Canavalia ensiformis, Jack bean type VI), poly(diallyldimethylammonium chloride) PDDA (20% v/v water solution), chitosan (CH, low molecular weight, 75–85% deacetylated degree, 50–190 kDa), were purchased from Sigma-Aldrich. Cationic lignin (CATLIG) was prepared from organosolv lignin (10 mg mL; 0.1 M) in NaOH, by treatment with glycidyl tetramethyl ammonium chloride (20 mg) at 60 °C for 2 h under magnetic stirring. The crude was purified for 24 hours by dialysis with Spectrapore™ membrane (3.5 kDa molecular weight cut off). Bradford reagent, 2,2-azinobis-(3-ethylbenzothiazoline-6-sulfonic acid) (ABTS) and β-D-glucose were purchased from Sigma-Aldrich. L-dopamine were purchased from TCI Europe. All experiments were performed in phosphate buffer saline (PBS, 0.1 M, pH 7.3 or pH 8.0), or sodium acetate buffer (0.1 M, pH 5.0 or pH 6.0), prepared by using Milli-Q water (ρ = 18.2 MΩ cm a 25 °C; TOC < 10 μg L−1, Millipore, Molsheim, France).Procedure for the preparation of Bio I
Lignin nanoparticles (LNPs) were prepared from organosolv lignin (OL) by using the nanoprecipitation procedure.47 Briefly, a solution of OL (2.0 mg in 1.2 mL of tetrahydrofuran (THF)/H2O 2![[thin space (1/6-em)]](https://www.rsc.org/images/entities/char_2009.gif) :
:![[thin space (1/6-em)]](https://www.rsc.org/images/entities/char_2009.gif) 1 v/v) was added to Milli-Q water (3.8 mL) to yield LNPs. The LNPs dispersion was concentrated using a rotary evaporator in order to remove the organic solvent, frozen and lyophilized. LNPs (1.5 mg) in PBS (1.0 mL) were treated with Con A (0.5 mg) in PBS (1.0 mL, 0.1 M; pH 7.3) in order to obtain the LNPs/Con A intermediate. LNPs/Con A was added to a solution of HRP (0.12 mg mL−1) and GOX (0.25 mg mL−1) in PBS (1.0 mL, 0.1 M; pH 7.3) and left under orbital shaking at 4 °C for 24 h. LNPs/Con A/HRP–GOX Bio I was isolated by centrifugation (20 min at 6000 rpm), washed with sodium phosphate buffer (1.0 mL, 0.1 M; pH 7.3) and lyophilized, while the residual solution was evaluated for the immobilization yield and activity parameters.
1 v/v) was added to Milli-Q water (3.8 mL) to yield LNPs. The LNPs dispersion was concentrated using a rotary evaporator in order to remove the organic solvent, frozen and lyophilized. LNPs (1.5 mg) in PBS (1.0 mL) were treated with Con A (0.5 mg) in PBS (1.0 mL, 0.1 M; pH 7.3) in order to obtain the LNPs/Con A intermediate. LNPs/Con A was added to a solution of HRP (0.12 mg mL−1) and GOX (0.25 mg mL−1) in PBS (1.0 mL, 0.1 M; pH 7.3) and left under orbital shaking at 4 °C for 24 h. LNPs/Con A/HRP–GOX Bio I was isolated by centrifugation (20 min at 6000 rpm), washed with sodium phosphate buffer (1.0 mL, 0.1 M; pH 7.3) and lyophilized, while the residual solution was evaluated for the immobilization yield and activity parameters.
Procedure for the preparation of Bio II–IV
LNPs/polyelectrolyte intermediates were prepared by treatment of LNPs (1.0 mL Milli-Q water; 1.0 mg mL−1) with the appropriate amount of poly(diallyldimethylammonium chloride) (PDDA), chitosan (CH), or cationic lignin (CATLIG) (1.0 mg mL−1, 0.5 mg mL−1, and 0.1 mg mL−1, respectively), in deionized water (1.0 mL) at 25 °C under orbital shaking for 2 hours. The corresponding LNPs/PDDA, LNPs/CH and LNPs/CATLIG were isolated by centrifugation and lyophilized. Concanavalin A was adsorbed on the surface of the appropriate LNPs/polyelectrolyte (1.5 mg) in PBS (1.0 mL) by treating with Con A (0.5 mg) in PBS (1.0 mL, 0.1 M; pH 7.3) in order to obtain LNPs/polyelectrolyte/Con A intermediates.LNPs/polyelectrolyte/Con A was added to a solution of HRP (0.12 mg mL−1) and GOX (0.25 mg mL−1) in PBS (1.0 mL, 0.1 M; pH 7.3) and left under orbital shaking at 4 °C for 24 h. Bio II–IV were isolated by centrifugation (20 min at 6000 rpm), washed with sodium phosphate buffer (1.0 mL, 0.1 M; pH 7.3) and lyophilized, while the residual solution was evaluated for the immobilization yield and activity parameters.
Bradford assay
The loading of Con A on LNPs (defined as % in weight of Con A per mg of LNPs) obtained during the different procedures was evaluated by the Bradford assay of the appropriate residual solution. The Con A concentration was calculated spectrophotometrically at 595 nm by using the Bradford reagent and bovine serum albumin as reference protein.Activity and kinetic parameters
The ABTS spectrophotometric assay was used for the determination of the enzymatic activity of Con A/HRP–GOX and Bio I–IV by following the absorbance at 415 nm (ε415 = 36![[thin space (1/6-em)]](https://www.rsc.org/images/entities/char_2009.gif) 000 M−1 cm−1) for 10 minutes. In a typical experiment, Con A/HRP–GOX and Bio I–IV (0.1 mg in PBS, 0.1 M, pH 7.0, 3.0 mL), were added to ABTS (0.5 mM) and β-D-glucose (100 mM). The activity unit of HRP in the enzymatic cascade was considered as the amount of enzyme able to transforms 1.0 μmole of H2O2 per min at pH 7 at 25 °C. Kinetic parameters (Km, Vmax, and Kcat) were determined by measuring the activity at different concentrations of β-D-glucose (0−100 mM) using the ABTS assay. As a general procedure, the reaction was started by adding β-D-glucose to PBS solution containing the appropriate amount of the sample (0.1 mg in PBS, 0.1 M, pH 7.0, 3.0 mL). The data were analysed by Lineweaver–Burk plots, the initial velocities (1/V vs. 1/[S]) and Km and Vmax being calculated as intercepts at the cartesian axes, respectively. The Michaelis–Menten constant and the turnover number have been calculated performing the analysis in triplicate by the use of the GraphPad software.
000 M−1 cm−1) for 10 minutes. In a typical experiment, Con A/HRP–GOX and Bio I–IV (0.1 mg in PBS, 0.1 M, pH 7.0, 3.0 mL), were added to ABTS (0.5 mM) and β-D-glucose (100 mM). The activity unit of HRP in the enzymatic cascade was considered as the amount of enzyme able to transforms 1.0 μmole of H2O2 per min at pH 7 at 25 °C. Kinetic parameters (Km, Vmax, and Kcat) were determined by measuring the activity at different concentrations of β-D-glucose (0−100 mM) using the ABTS assay. As a general procedure, the reaction was started by adding β-D-glucose to PBS solution containing the appropriate amount of the sample (0.1 mg in PBS, 0.1 M, pH 7.0, 3.0 mL). The data were analysed by Lineweaver–Burk plots, the initial velocities (1/V vs. 1/[S]) and Km and Vmax being calculated as intercepts at the cartesian axes, respectively. The Michaelis–Menten constant and the turnover number have been calculated performing the analysis in triplicate by the use of the GraphPad software.
Temperature and pH stability and reusability assay
Temperature and pH stability, and reusability assay were performed by using a slightly modified procedure of the ABTS spectrophotometric test. In particular, the temperature stability was determined by adding Bio I, III and IV (0.1 mg in PBS, 0.1 M, pH 7.0, 3.0 mL) to a solution of ABTS (0.5 mM) and β-D-glucose (100 mM) in an oil bath at 60 °C and monitoring the absorbance at 415 nm for 10 minutes. For the pH stability, the appropriate amount of Bio I, III and IV (0.1 mg) was added to buffer solution (3.0 mL) at different pH values (sodium acetate buffer 0.1 M, at pH 5.0 and at pH 6.0, PBS 0.1 M at pH 7.3 and at pH 8.0), containing the appropriate solution of ABTS (0.5 mM) and β-D-glucose (100 mM). The production of the cation radical of ABTS was monitored at 415 nm for 10 minutes at 25 °C. The reusability of Bio I, III and IV was performed under the experimental condition described above. At the end of the transformation, Bio I, III and IV were recovered by centrifugation and washed three times with deionized water in order to eliminate the residual ABTS. After all, Bio I, III and IV were reused with fresh glucose/ABTS solution for five consecutive runs.Electrochemical characterization of Bio I, Con A/HRP–GOX, LNPs/HRP–GOX
The immobilization procedure for the development of modified glassy carbon electrodes (GCE) with Bio I, Con A/HRP–GOX and LNPs/HRP–GOX was performed by a sequential layer-by-layer drop-casting procedure. In particular, for Bio I, a three step drop casting procedure was performed as follow: LNPs (15 μL, 1.5 mg mL−1) in PBS (50 mM, pH 7.0) was sonicated for 5 minutes, the dispersion was drop-cast onto the (GCE) and let it dry for 20 minutes. Successively, a solution of Con A (15 μL, 0.5 mg mL−1) was drop-cast onto the electrode surface and let it dry for 20 minutes. The electrode was then rinsed with PBS 50 mM pH 7.0. Finally, HRP (15 μL, 0.12 mg mL−1) and GOX (15 μL, 0.25 mg mL−1) in PBS (50 mM, pH 7.0), was drop-cast onto the electrode surface and let it dry for 30 minutes. The electrode surface was then rinsed with PBS. The GCE/Con A/HRP–GOX system was prepared under the experimental conditions previously reported for Bio I without the LNPs drop-casting. The GCE/LNPs/HRP–GOX system was prepared under the experimental conditions previously reported for Bio I without the Con A drop-casting. The voltammetric experiments were performed at room temperature in PBS (50 mM, pH 7.0), using hydroquinone solution (H2Q), as the electroactive mediator (1.0 × 10⁻⁴ M, PBS, 50 mM; pH 7.0), in the absence and presence of β-D-glucose (1.0 × 10⁻² M) and in a potential range between −0.5 and 0.5 V at a scan rate of 100 mV s−1. All electrochemical measurements were carried on with a PGSAT204N potentiostat (Eco Chemie, Utrecht) controlled by the Nova 2.1 software with a conventional three electrodes configuration. A saturated calomel electrode (SCE, 244 mV vs. NHE, Cat. 303/SCG/12, AMEL, Milan, Italy) as reference, a glassy carbon rod electrode (d = 2 mm, Cat. 6.1241.020, Metrohm, Herisau, Switzerland) as counter and a glassy carbon (GC) as working electrode (d = 3 mm, Cat. 6.1204.300, Metrohm, Herisau, Switzerland). Before functionalization, GCE was polished for 10 minutes using alumina slurries with two different particle size (0.3 μm/0.05 μm) using cloth pads wet with Milli-Q water, rinsed with Milli-Q water, and further sonicated for 5 min between each polishing step.Colorimetric performance of Bio I, III and IV
The colorimetric analysis was performed by using different concentrations of β-D-glucose (from 4.0 μM to 2000 μM) into cuvettes containing the appropriate amount of Bio I, III and IV (1.0 mg, in PBS 0.1 M, pH 7.0, 3.0 mL) and ABTS (0.5 mM, 0.1 mL) or L-dopamine (0.5 mM, 0.1 mL) as chromogenic substrates. After 30 minutes under magnetic stirring at 25 °C the dispersion was photographed with a digital camera and the corresponding absorption spectra were measured by a UV-Vis spectrophotometer (Varian Cary® 50 UV-Vis) setting the wavelength at 415 nm and 700 nm for ABTS and L-dopamine, respectively.ATR FT-IR analysis
LNPs/Con A and LNPs/polyelectrolyte/Con A samples were analyzed by attenuated total reflection Fourier transform infrared (ATR-IR) spectroscopic using a PerkinElmer (Spectrum One) spectrometer (UATR unit cell) averaging 32 scans (resolution of 4 cm−1).Scanning electron microscopy
The field emission scanning electron microscopy (FESEM) of Bio I–IV was acquired on FESEM ZEISS GeminiSEM500, operated at 5 kV after drop 20 μL (with deionized water) of sample dispersion on specimen stubs, air dried and coated with gold by sputtering with AGAR (Auto Sputter Coater). Before the observations, the sample received a deposition of chromium thin film (5 nm) by sputter coating using a QUORUM Q 150T ES plus coater.Confocal laser microscopy, FRET
The detailed procedure for the labeling of HRP and GOX and for the calculation of the FRET effect are reported in SI #6.† The confocal images of Bio IV were obtained by ZEISS LSM-710 NLO confocal system equipped with a Plan Apochromat 100×/1.40 oil DIC M 27 objectives was used for laser confocal microscopy.Conclusions
LNPs proved to be an efficient green platform for the immobilization of HRP and GOX mediated by Con A. The activity and kinetic parameters of the HRP–GOX enzymatic cascade were controlled by the specific nature of the cationic polyelectrolyte layer able to modify the aggregation stability of the tetrameric sub-units of Con A, CATLIG being the best performing polyelectrolyte. In this latter case, the optimal distance of 7.0 nm was measured between immobilized HRP and GOX by Förster resonance energy transfer (FRET) effect. Cyclic voltammetry analysis confirmed the critical role played by Con A in the electrochemical responsiveness of the systems, associated to a boosting effect exerted by LNPs probably due a better electron transfer mechanism occurring at the electrode surface. The efficacy of novel immobilized Con A/HRP–GOX systems in the oxidation of β-D-glucose was tested by colorimetric assay, using ABTS and dopamine as chromogenic substrates. The lowest LOD values were obtained in the presence of CATLIG as cationic polyelectrolyte layer. Table 4 reports the comparison of the LOD value for Bio IV with that of other reference systems. In particular, a LOD value (0.85 μM) better than, or comparable to, that previously reported for other heterogeneous HRP–GOX immobilized systems was observed.37,78,81 The fact that a full renewable nanoplatform composed by lignin (organosolv and CATLIG) and Con A can efficiently support the HRP–GOX enzymatic cascade maintaining the catalytic activity open a new entry for a green and biodegradable family of biosensors useful for bio-catalytic and environmentally friendly applications.Conflicts of interest
There are no conflicts to declare.Acknowledgements
The authors acknowledge the EU project-EASME/EMFF/Blue Economy-2018/n.863697 “FISH chitinolytic biowastes FOR FISH active and sustainable packaging material” (FISH4FISH)”.Dr Lorenzo Arrizza and Microscopies center of L'Aquila University are acknowledged for SEM analyses. The Large Equipment Center (CGA) of Tuscia University are acknowledged for confocal analysis and FRET measurements.References
- P. S. Chauhan, Bioresour. Technol., 2020, 9, 100374 CrossRef.
- W. G. Glasser, Front. Chem., 2020, 7, 565 CrossRef PubMed.
- W. Zhao, B. Simmons, S. Singh, A. Ragauskas and G. Cheng, Green Chem., 2016, 18, 5693–5700 RSC.
- I. Siavash and S. V. Rajender, Green Chem., 2020, 22, 612–636 RSC.
- Z. Ma, C. Liu, N. Niu, Z. Chen, S. Li, S. Liu and J. Li, ACS Sustainable Chem. Eng., 2018, 6, 3169–3175 CrossRef CAS.
- W. Yang, E. Fortunatia, F. Bertoglio, J. S. Owczarek, G. Brunif, M. Kozanecki, J. M. Kenny, L. Torre, L. Visai and D. Puglia, Carbohydr. Polym., 2018, 181, 275–284 CrossRef CAS PubMed.
- W. Yang, E. Fortunati, F. Dominici, G. Giovanale, A. Mazzaglia, G. M. Balestra, J. M. Kenny and D. Puglia, Eur. Polym. J., 2016, 79, 1–12 CrossRef CAS.
- D. Piccinino, E. Capecchi, L. Botta, B. M. Bizzarri, P. Bollella, R. Antiochia and R. Saladino, Biomacromolecules, 2018, 19, 3883–3893 CrossRef CAS PubMed.
- Y. Deng, X. Feng, M. Zhou, Y. Qian, H. Yu and X. Qiu, Biomacromolecules, 2011, 12, 1116–1125 CrossRef CAS PubMed.
- Y. Deng, X. Feng, D. Yang, C. Yi and X. Qiu, BioResources, 2012, 7, 1145–1156 Search PubMed.
- F. C. Spano and C. Silva, Annu. Rev. Phys. Chem., 2014, 65, 477–500 CrossRef CAS PubMed.
- G. A. Di Labio and E. R. Johnson, J. Am. Chem. Soc., 2007, 129, 6199–6203 CrossRef CAS PubMed.
- A. Batra, G. Kladnik, H. Vázquez, J. S. Meisner, L. Floreano, C. Nuckolls, D. Cvetko, A. Morgante and L. Venkataraman, Nat. Commun., 2012, 3, 1086 CrossRef PubMed.
- E. Capecchi, D. Piccinino, B. M. Bizzarri, D. Avitabile, C. Pelosi, C. Colantonio, G. Calabrò and R. Saladino, Biomacromolecules, 2019, 20, 1975–1988 CrossRef CAS PubMed.
- E. Capecchi, D. Piccinino, I. Delfino, P. Bollella, R. Antiochia and R. Saladino, Nanomaterials, 2018, 6, 438 CrossRef PubMed.
- E. Capecchi, D. Piccinino, B. M. Bizzarri, L. Botta, M. Crucianelli and R. Saladino, Catalysts, 2020, 10, 313 CrossRef CAS.
- M. H. Sipponen, M. Farooq, J. Koivisto, A. Pellis, J. Seitsonen and M. Österberg, Nat. Commun., 2018, 9, 2300 CrossRef PubMed.
- D. Piccinino, E. Capecchi, L. Botta, P. Bollella, R. Antiochia, M. Crucianelli and R. Saladino, Catal. Sci. Technol., 2019, 9, 4125–4413 RSC.
- M. Frommhagen, S. K. Mutte, A. H. Westphal, M. J. Koetsier, S. W. A. Hinz, J. Visser, J. P. Vincken, D. Weijers, W. J. H. Van Berkel, H. Gruppen and M. A. Kabel, Biotechnol. Biofuels, 2017, 10, 121 CrossRef PubMed.
- L. Brenelli, F. B. Squina, C. Felby and D. Cannella, Biotechnol. Biofuels, 2018, 11, 1 CrossRef PubMed.
- E. Kim, W. T. Leverage, Y. Liu, I. M. White, W. E. Bentley and G. F. Payne, Analyst, 2014, 139, 32–43 RSC.
- A. Giannakopoulou, E. Gkantzou, A. Polydera and H. Stamatis, Trends Biotechnol., 2020, 38, 202–216 CrossRef CAS PubMed.
- C. Schmid-Dannert and F. López-Gallego, Curr. Opin. Chem. Biol., 2019, 49, 97–104 CrossRef CAS PubMed.
- J. Muschiol, C. Peters, N. Oberleitner, M. D. Mihovilovic, U. T. Bornscheuer and and F. Rudroff, Chem. Commun., 2015, 51, 5798–5811 RSC.
- K. Ariga, Q. Ji, T. Mori, M. Naito, Y. Yamauchi, H. Abe and J. P. Hill, Chem. Soc. Rev., 2013, 42, 6322–6345 RSC.
- M. Filice and J. M. Palomo, ACS Catal., 2014, 4, 1588–1598 CrossRef CAS.
- Y. H. P. Zhang, Biotechnol. Adv., 2011, 29, 715–725 CrossRef CAS PubMed.
- T. S. Schwarzer, L. Klermund, G. Wang and K. Castiglione, Nanotechnology, 2018, 29, 44 CrossRef PubMed.
- F. Lopez-Gallego, Methods Enzymol., 2019, 617, 385–411 Search PubMed.
- S. Schoffelen and J. C. Van Hest, Curr. Opin. Struct. Biol., 2013, 23, 613–621 CrossRef CAS PubMed.
- Y. Liu, T. L. Ogorzalek, P. Yang, M. M. Schroeder, E. N. G. Marsh and Z. Chen, J. Am. Chem. Soc., 2013, 135, 12660–12669 CrossRef CAS PubMed.
- J. Turková, J. Chromatogr. B: Biomed. Sci. Appl., 1999, 722, 11–31 CrossRef.
- J. Huang, W. Zhuang, C. Wei, L. Mu, J. Zhu, Y. Zhu and H. Ying, Process Biochem., 2018, 64, 160–169 CrossRef CAS.
- F. Jia, S. K. Mallapragada and B. Narasimhan, Ind. Eng. Chem. Res., 2015, 54, 10212–10220 CrossRef CAS.
- O. Idan and H. Hess, Curr. Opin. Biotechnol., 2013, 24, 606–611 CrossRef CAS PubMed.
- H. H. Nguyen, S. H. Lee, U. J. Lee, C. D. Fermin and M. Kim, Materials, 2019, 12, 121 CrossRef CAS PubMed.
- X. Zhu, J. Huang, J. Liu, H. Zhang, J. Jiang and R. Yu, Nanoscale, 2017, 9, 5658–5663 RSC.
- M. Stanisz, Ł. Klapiszewski and T. Jesionowski, Chem. Eng. J., 2020, 397, 125409 CrossRef CAS.
- A. Jędrzak, T. Rębiś, M. Kuznowicz and T. Jesionowski, Int. J. Biol. Macromol., 2019, 127, 677–682 CrossRef PubMed.
- H. Yao, Q. Gan, J. Peng, S. Huang, M. Zhu and K. Shi, Sensors, 2016, 16, 563 CrossRef PubMed.
- Y. Yong, R. Su, X. Liu, W. Xu, Y. Zhang, R. Wang and Z. Liu, Biochem. Eng. J., 2018, 129, 26–32 CrossRef CAS.
- W. Xu, Y. Yong, Z. Wang, G. Jiang, J. Wu and Z. Liu, ACS Sustainable Chem. Eng., 2016, 5, 90–96 CrossRef.
- L. Chen, Y. Fu, N. Wang, A. Yang, Y. Li, J. Wu and F. Yan, ACS Appl. Mater. Interfaces, 2018, 10, 18470–18477 CrossRef CAS PubMed.
- A. F. Che, Z. M. Liu, X. J. Huang, Z.-G. Wang and Z. K. Xu, Biomacromolecules, 2008, 9, 3397–3403 CrossRef CAS PubMed.
- M. H. Sipponen, M. Smyth, T. Leskinen, L.-S. Johansson and M. Österberg, Green Chem., 2017, 19, 5831–5840 RSC.
- F. Wu and S. D. Minteer, Biomacromolecules, 2013, 14, 2739–2749 CrossRef CAS PubMed.
- T. Leskinen, M. Smyth, Y. Xiao, K. Lintinen, M. L. Mattinen, M. A. Kostiainen and M. Österberg, Nord Pulp Pap, J. Res., 2017, 32, 586–596 CAS.
- X. Xu, Y. Yuan, G. Hu, X. Wang, P. Qi, Z. Wang and H. Yang, Sci. Rep., 2017, 7, 1452 CrossRef PubMed.
- T. Spector, Anal. Biochem., 1978, 86, 142–146 CrossRef CAS PubMed.
- B. C. Fish and L. U. Thompson, J. Agric. Food Chem., 1991, 39, 727–731 CrossRef CAS.
- Y. Zhang, Y. Yong, J. Ge and Z. Liu, ACS Catal., 2016, 6, 3789–3795 CrossRef CAS.
- A. Makky, J. P. Michel, P. Maillard and V. Rosilio, Biochim. Biophys. Acta Rev. Biomembr., 2011, 1808, 656–666 CrossRef CAS PubMed.
- S. Beisl, J. Adamcyk and A. Friedl, Molecules, 2020, 25, 1388 CrossRef CAS PubMed.
- L. T. Nguyen and K. L. Yang, Enzyme Microb. Technol., 2017, 100, 52–59 CrossRef CAS PubMed.
- R. Saladino, M. Guazzaroni, C. Crestini and M. Crucianelli, ChemCatChem, 2013, 5, 1407–1415 CrossRef CAS.
- G. Palazzo, G. Colafemmina, C. Guzzoni Iudice and and A. Mallardi, Sens. Actuators, B, 2014, 202, 217–223 CrossRef CAS.
- J. L. Lin, L. Palomec and I. Wheeldon, ACS Catal., 2014, 4, 505–511 CrossRef CAS.
- D. Simon, F. Obst, S. Haefner, T. Heroldt, M. Peiter, F. Simon and D. Appelhans, React. Chem. Eng., 2019, 4, 67–77 RSC.
- O. Idan and H. Hess, Curr. Opin. Biotechnol., 2013, 24, 606–611 CrossRef CAS PubMed.
- V. Hitaishi, R. Clement, N. Bourassin, M. Baaden, A. de Poulpiquet, S. Sacquin-Mora and E. Lojou, Catalysts, 2018, 8, 192 CrossRef.
- J. Fu, Y. R. Yang, A. Johnson-Buck, M. Liu, Y. Liu, N. G. Walter and H. Yan, Nat. Nanotechnol., 2014, 9, 531–536 CrossRef CAS PubMed.
- A. Kuzmak, S. Carmali, E. von Lieres, A. J. Russell and S. Kondrat, Sci. Rep., 2019, 9, 1 CrossRef CAS PubMed.
- G. N. Rivière, A. Korpi, M. H. Sipponen, T. Zou, M. A. Kostiainen and M. Österberg, ACS Sustainable Chem. Eng., 2020, 8, 4167–4177 CrossRef PubMed.
- F. P. Ramanery, A. A. Mansur and H. S. Mansur, Nanoscale Res. Lett., 2013, 8, 512 CrossRef PubMed.
- M. Mayer, D. Dedovets, Y. Guari, J. Larionova, J. Long and J. Causse, J. Colloid Interface Sci., 2017, 505, 364–372 CrossRef CAS PubMed.
- J. M. Khan, M. S. Khan, A. Qadeer, M. A. Alsenaidy, A. Ahmed, N. A. Al-Shabib and R. H. Khan, Colloids Surf., 2017, 522, 494–502 CrossRef CAS.
- S. K. Chaturvedi, J. M. Khan, M. K. Siddiqi, P. Alam and R. H. Khan, Int. J. Biol. Macromol., 2016, 83, 315–325 CrossRef CAS PubMed.
- J. M. Khan, M. R. Khan, P. Sen, A. Malik, M. Irfan and R. H. Khan, J. Mol. Liq., 2018, 269, 796–804 CrossRef CAS.
- B. A. M. Rocha, C. S. Teixeira, J. C. Silva-Filho, R. B. Nóbrega, D. B. Alencar, K. S. Nascimento and P. Delatorre, Int. J. Biol. Macromol., 2015, 72, 1136–1142 CrossRef CAS PubMed.
- D. H. Nagaraju, T. Rebis, R. Gabrielsson, A. Elfwing, G. Milczarek and O. Inganäs, Adv. Energy Mater., 2013, 4, 1300443 CrossRef.
- K. Gawluk, A. Modrzejwska-Sikorska, T. Rębiś and G. Milczarek, Catalysts, 2017, 7, 392 CrossRef.
- T. Kamgaing, K. I. Tonle and Y. F. Emanbou, J. Anal. Chem., 2013, 8, 64–77 Search PubMed.
- V. K. Thakur, M. K. Thakur, P. Raghvan and P. Kessler, ACS Sustainable Chem. Eng., 2014, 2, 1072–1092 CrossRef CAS.
- P. C. Ray, Z. Fan, R. A. Crouch, S. S. Sinha and A. Pramanik, Chem. Soc. Rev., 2014, 43, 6370–6404 RSC.
- Y. He, Y. Li, S. Mukherjee, Y. Wu, H. Yan and H. P. Lu, J. Am. Chem. Soc., 2011, 133, 14389–14395 CrossRef CAS PubMed.
- W. M. Shih, Z. Gryczynski, J. R. Lakowicz and J. A. Spudich, Cell, 2000, 102, 683–694 CrossRef CAS PubMed.
- Y. Zhang, F. Lyu, J. Ge and Z. Liu, Chem. Commun., 2014, 50, 12919–12922 RSC.
- Z. Li, Y. Zhang, Y. Su, P. Ouyang, J. Ge and Z. Liu, Chem. Commun., 2014, 50, 12465–12468 RSC.
- A. Palumbo, A. Napolitano, P. Barone and M. d’ Ischia, Chem. Res. Toxicol., 1999, 12, 1213–1222 Search PubMed.
- J. Li, M. A. Baird, M. A. Davis, W. Tai, L. S. Zweifel, K. M. A. Waldorf and X. Gao, Nat. Biomed. Eng., 2017, 1, 6 Search PubMed.
- H. Liang, S. Sun, Y. Zhou and Y. Liu, Catalysts, 2017, 7, 327 Search PubMed.
Footnote |
| † Electronic supplementary information (ESI) available. See DOI: 10.1039/d0ra04485g |
| This journal is © The Royal Society of Chemistry 2020 |

