 Open Access Article
Nanostructured N doped TiO2 efficient stable catalyst for Kabachnik–Fields reaction under microwave irradiation†
Sachin P. Kundeab,
Kaluram G. Kanade *ac,
Bhausaheb K. Karalea,
Hemant N. Akolkara,
Sudhir S. Arbuj
 d,
Pratibha V. Randhavanea,
Santosh T. Shindea,
Mubarak H. Shaikha and
Aniruddha K. Kulkarnie
aPG and Research Centre, Radhabai Kale Mahila Mahavidyalaya, Ahmednagar, 414 001 India. E-mail: kgkanade@yahoo.co.in
bPG and Research Centre, Mahatma Phule Arts, Science and Commerce College, Panvel, 410 206, India
cPG and Research Centre, Yashavantrao Chavan Institute of Science, Satara, 415 001 India
dCentre for Materials for Electronics Technology (C-MET), Department of Electronics and Information Technology (DeitY), Government of India, Panchavati, Off Pashan Road, Pune-411 008, India
eDr. John Barnabas School for Biological Studies, Department of Chemistry, Ahmednagar College, Ahmednagar-414 001, India
First published on 20th July 2020
Abstract
Herein, we report nitrogen-doped TiO2 (N-TiO2) solid-acid nanocatalysts with heterogeneous structure employed for the solvent-free synthesis of α-aminophosphonates through Kabachnik–Fields reaction. N-TiO2 were synthesized by direct amination using triethylamine as a source of nitrogen at low temperature and optimized by varying the volume ratios of TiCl4, methanol, water, and triethylamine, under identical conditions. An X-ray diffraction (XRD) study showed the formation of a rutile phase and the crystalline size is 10 nm. The nanostructural features of N-TiO2 were examined by HR-TEM analysis, which showed they had rod-like morphology with a diameter of ∼7 to 10 nm. Diffuse reflectance spectra show the extended absorbance in the visible region with a narrowing in the band gap of 2.85 eV, and the high resolution XPS spectrum of the N 1s region confirmed successful doping of N in the TiO2 lattice. More significantly, we found that as-synthesized N-TiO2 showed significantly higher catalytic activity than commercially available TiO2 for the synthesis of a novel series of α-amino phosphonates via Kabachnik–Fields reaction under microwave irradiation conditions. The improved catalytic activity is due to the presence of strong and Bronsted acid sites on a porous nanorod surface. This work signifies N-TiO2 is an efficient stable catalyst for the synthesis of α-aminophosphonate derivatives.
1 Introduction
In recent years, organophosphorus compounds have received much attention due to their widespread applications in medicinal and agriculture industries.1,2 α-Aminophosphonates are one such biological important framework that are structural mimics of amino acids. For example, glyphosate (N-(phosphonomethyl)glycine) is extensively utilized in agriculture as a systemic herbicide and Alafosfalin is used as an antibacterial agent3 (Fig. 1). The bioactivity of these molecules such as antimicrobial,4 antioxidant,5 anti-inflammatory,6 enzyme inhibitors7 and antibacterial8 is one of the reasons for them to be of immense interest in synthetic organic chemistry. It has been demonstrated that on incorporation of heterocycles such as thiophene,9 benzothiazoles,10 thiadiazoles,11 and pyrazole12 into the α-aminophosponates scaffold, the resulting compounds exhibited interesting biological activities. Pyrazole derivatives of α-aminophosponates have been rarely reported in the literature,13,14 thus synthesis of novel pyrazole derivatives of α-aminophosponates is important to research.Although several protocols for the synthesis of α-aminophosponates are reported, one of the most important is the Kabachnik–Fields reaction.15,16 This involves a one-pot three-component coupling of a carbonyl compound, an amine and alkylphosphite. These protocols has been accomplished in presence of a variety of catalyst such as TiCl4,17 CuI,18 hexanesulphonic sodium salt,19 trifluoroacetic acid (TFA),20 In(OTf)3,21 BiCl3,22 Cu(OTf)2,23 SbCl3/Al2O3,24 InCl3,25 LiClO4,26 ZrOCl2,27 TsCl,28 Mg(ClO4)2,29 and Na2CaP2O30 in presence or even in the absence of a solvent. However, most of these existing procedures are sluggish, require long reaction times, use of strong acidic conditions, give unsatisfactory yields and also suffer from the formation of many side products. Moreover, in all alternatives microwave reaction proved to be a kind of promising medium for such reaction.31
In the last few years, the application of transition metal oxides gained particular interest as a heterogeneous catalyst for various organic synthesis.32 Among all transition metal oxides the use of nanocrystalline titania (TiO2) has been grown extensively owing to their outstanding physiochemical properties, which furnished their wide applications in sensors,33 pigments,34 photovoltaic cells,35 and catalysis.36 Also, the use of potential titania catalyst attracted in organic synthesis due to its environmental compatibility, inexpensive, safe, stable, reusable and earth-abundant. It has been proven the desired property of TiO2 was attained by fulfilling requirements in terms of unique morphology, high crystallinity and mixed-phase composition, the ability of oxidizing and reducing ability under suitable irradiation makes promising greener alternative approach towards important organic transformations compared to other expensive, toxic, transition metal oxides. Moreover, the phase composition and the degree of crystallinity of the titania sample plays an important role in catalytic activity.8 In the past several organic transformations such as oxidation of primary alcohols,37 synthesis of xanthenes,38 Friedel–Crafts alkylation,39 Beckmann rearrangement40 efficiently utilizes TiO2 as a heterogeneous reusable catalyst. In the literature several reports have been debated to influence nitrogen doping on photocatalytic activity of nanocrystalline TiO2. However, the effect is unrevealed for catalytic applications in organic synthesis. Recently, Hosseini-Sarvari explored the use of commercial TiO2 in the synthesis of α-aminophosponates via Kabachnik–Fields reactions.41
In present investigation, we have prepared nanostructured N doped TiO2 and also investigation emphasis was given on the synthesis of a series of a novel diethyl(1-phenyl-3-(thiophen-2-yl)-1H-pyrazol-4-yl)(phenylamin) methylphosphonates under microwave irradiation.
2 Experimental sections
2.1 Synthesis of N doped TiO2 nanorods
The nanostructured N-TiO2 were synthesized by previously reported method with some modification.42,43 In a typical procedure, 0.5 mL of titanium tetrachloride (TiCl4) was added in absolute methanol (25 mL) with constant stirring at room temperature. To this solution requisite quantity a 0.1–2 M aqueous triethylamine solution is injected rapidly. The resulting solution was refluxed for 24 h with constant stirring. The white precipitate formed was collected and washed with ethanol several times followed by centrifugation (10![[thin space (1/6-em)]](https://www.rsc.org/images/entities/char_2009.gif) 000 rpm for 20 min). The precipitate was dried at 473 K for 24 h. To control the final morphologies of samples, the sample were synthesized as function of volume ratio of TiCl4, methanol, water, and triethylamine. The sample prepared in volume ratio 1
000 rpm for 20 min). The precipitate was dried at 473 K for 24 h. To control the final morphologies of samples, the sample were synthesized as function of volume ratio of TiCl4, methanol, water, and triethylamine. The sample prepared in volume ratio 1![[thin space (1/6-em)]](https://www.rsc.org/images/entities/char_2009.gif) :
:![[thin space (1/6-em)]](https://www.rsc.org/images/entities/char_2009.gif) 10
10![[thin space (1/6-em)]](https://www.rsc.org/images/entities/char_2009.gif) :
:![[thin space (1/6-em)]](https://www.rsc.org/images/entities/char_2009.gif) 50
50![[thin space (1/6-em)]](https://www.rsc.org/images/entities/char_2009.gif) :
:![[thin space (1/6-em)]](https://www.rsc.org/images/entities/char_2009.gif) 0, 1
0, 1![[thin space (1/6-em)]](https://www.rsc.org/images/entities/char_2009.gif) :
:![[thin space (1/6-em)]](https://www.rsc.org/images/entities/char_2009.gif) 10
10![[thin space (1/6-em)]](https://www.rsc.org/images/entities/char_2009.gif) :
:![[thin space (1/6-em)]](https://www.rsc.org/images/entities/char_2009.gif) 50
50![[thin space (1/6-em)]](https://www.rsc.org/images/entities/char_2009.gif) :
:![[thin space (1/6-em)]](https://www.rsc.org/images/entities/char_2009.gif) 1, 1
1, 1![[thin space (1/6-em)]](https://www.rsc.org/images/entities/char_2009.gif) :
:![[thin space (1/6-em)]](https://www.rsc.org/images/entities/char_2009.gif) 10
10![[thin space (1/6-em)]](https://www.rsc.org/images/entities/char_2009.gif) :
:![[thin space (1/6-em)]](https://www.rsc.org/images/entities/char_2009.gif) 50
50![[thin space (1/6-em)]](https://www.rsc.org/images/entities/char_2009.gif) :
:![[thin space (1/6-em)]](https://www.rsc.org/images/entities/char_2009.gif) 2, 2
2, 2![[thin space (1/6-em)]](https://www.rsc.org/images/entities/char_2009.gif) :
:![[thin space (1/6-em)]](https://www.rsc.org/images/entities/char_2009.gif) 10
10![[thin space (1/6-em)]](https://www.rsc.org/images/entities/char_2009.gif) :
:![[thin space (1/6-em)]](https://www.rsc.org/images/entities/char_2009.gif) 50
50![[thin space (1/6-em)]](https://www.rsc.org/images/entities/char_2009.gif) :
:![[thin space (1/6-em)]](https://www.rsc.org/images/entities/char_2009.gif) 2, and 2
2, and 2![[thin space (1/6-em)]](https://www.rsc.org/images/entities/char_2009.gif) :
:![[thin space (1/6-em)]](https://www.rsc.org/images/entities/char_2009.gif) 10
10![[thin space (1/6-em)]](https://www.rsc.org/images/entities/char_2009.gif) :
:![[thin space (1/6-em)]](https://www.rsc.org/images/entities/char_2009.gif) 50
50![[thin space (1/6-em)]](https://www.rsc.org/images/entities/char_2009.gif) :
:![[thin space (1/6-em)]](https://www.rsc.org/images/entities/char_2009.gif) 4 were denoted as TN0 (pure TiO2), TN1, TN2, TN3 and TN4 respectively.
4 were denoted as TN0 (pure TiO2), TN1, TN2, TN3 and TN4 respectively.
2.2 Synthesis of 1-phenyl-5-(thiophen-2-yl)-1H-pyrrole-3-carbaldehyde
1-Phenyl-5-(thiophene-2-yl)-1H-pyrrole-3-carbaldehyde were obtained via the Vilsmeier–Haack reaction of the appropriate phenylhydrazones, derived from the reaction of 2-acetyl thiophene with phenylhydrazine44 (Scheme 1).2.3 Synthesis of diethyl(1-phenyl-3-(thiophene-2-yl)-1H-pyrazole-4-yl)(phenylamino)methylphosphonates
In a typical procedure, the pyrazolealdehyde 1 (1 mmol), aniline 2 (1 mmol), triethyl phosphite 3 (1.1 mmol) and N-TiO2 (12 mol%) were taken in a round bottom flask equipped with a condenser and subjected to microwave irradiation for (10–15 min) using 420 W (RAGA's Microwave system) (Scheme 3). The progress of the reaction was monitored by TLC. After the reaction was completed, the reaction mixture extracted using ethyl acetate and insoluble catalyst separated by filtration. The crude product was purified by silica gel column chromatography using n-hexane/ethyl acetate as eluent. The product structure was determined by FTIR, 1H NMR, and LS-MS.2.4 Samples characterization
The phase purity and crystallinity were examined by X-ray diffraction (XRD) technique (Advance, Bruker AXS D8) using Cu Kα1 (1.5406 Å) radiation with scanning 2θ range from 20 to 80°. For FETEM analysis samples were prepared by evaporating dilute solution on carbon-coated grids. FE-TEM measurements were carried using the JEOL SS2200 instrument operated at an accelerating voltage of 300 kV. The Brunauer–Emmett–Teller (BET) surface area of nanocatalysts was examined using the Quantachrome v 11.02 nitrogen instrument. The optical properties of the powder samples were studied using UV-vis diffuse reflectance absorption spectra (UV-DRS) were recorded on the Perkin-Elmer Lambada-950 spectrophotometer in the wavelength range of 200–800 nm. Powder samples were used for XPS measurements. The XPS measurements of powdered samples were carried out on a VG Microtech ESCA3000 instrument. Fourier transform infrared (FTIR) spectra of prepared samples were recorded on a Shimadzu Affinity 1-S spectrophotometer in over a range of 400–4000 cm−1. 1H NMR was recorded in DMSO-d6 solvent on a Bruker Advance-400 spectrometer with tetramethylsilane (TMS) as an internal reference.3 Results and discussions
3.1 Structural study
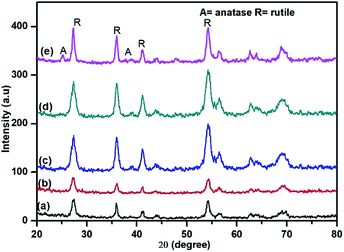
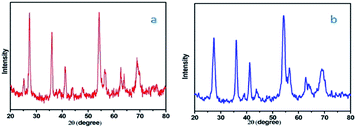
Nanostructured TiO2 and N doped TiO2 were synthesized by a simple refluxing method. The phase purity and phase formation of as-synthesized material were analysed by powder X-ray diffraction pattern. Fig. 2 compares powder XRD patterns of TiO2 and N doped TiO2 samples. The peak position and peak intensity of the pure TiO2 powder can be indexed into rutile phases (Fig. 2). Further, it is observed that an increase in the amount N-dopant (triethylamine) the intensity of the diffraction peaks of the rutile phase decreases, while that of anatase phase increases, indicating that the fraction of the anatase phase gradually increases at the expense of the rutile phase during this condition (sample TN2–TN4). The phase composition of rutile and anatase phase of TiO2 evaluated from the peak intensity using the following equation,where fA is the fraction of the anatase phase, and IA and IR are the intensities of the anatase (1 0 1) and rutile (1 1 0) diffraction peaks, respectively. The higher molar concentration of triethylamine is favourable for the transformation from rutile to anatase.45,46 Therefore, the phase composition of TiO2 samples, i.e. the fraction of anatase and rutile, can be facilely controlled through adjusting the concentration of triethylamine. The slight shift of rutile (1 1 0) diffraction peaks towards a higher angle with an increase in the amount of N dopant suggesting the incorporation of nitrogen in the TiO2 crystal structure. The crystallite size is calculated from each (1 1 0) peak in the XRD pattern using the Sherrer formula.39 The average crystalline size are 25, 19, 16, 12 and 9 nm for TN0, TN1, TN2, TN3, and TN4 respectively (Table 1). From, XRD analysis it is clear that with an increase in the concentration of nitrogen in TiO2, fraction of anatase increases phase and crystalline size decreases.
| Sample | Rutile | Anatase | Crystallite size (nm) |
|---|---|---|---|
| TN0 | 100 | 0 | 25 |
| TN1 | 98 | 2 | 19 |
| TN2 | 94 | 6 | 16 |
| TN3 | 95 | 5 | 12 |
| TN4 | 91 | 9 | 9 |
3.2 Surface and morphological study
Transmission electron microscopy (TEM) and high-resolution transmission electron microscopy (HRTEM) analysis were performed to study morphology and crystallinity of as-synthesized pure and N doped TiO2 materials (Fig. 3). The pure TiO2 (TN0) sample seems flowerlike nanostructures (Fig. 3a). At high-resolution it reveals that each flower microstructure consisting several nanorods. The length of nanorods are in the range of 50–70 nm and diameter is about 10–15 nm (Fig. 3b). Fig. 3c shows the lattice fringes of the material with interplanar spacing d spacing 0.33 nm matches well (1 0 0) plane of rutile TiO2. Fig. 3c inset shows a selected area diffraction pattern in which bright spots observed that confirm the TiO2 nanorods are in nanocrystalline nature. It was observed that addition of N dopant, resulting sample TN1 and TN2 grows into new superstructure consisting nanorods of length 30–50 nm and spheres of diameter 20–30 nm, particles size is obviously smaller than TN0 (Fig. 3d and h). HRTEM results are consistent with XRD results. The d-spacing is about 0.325 Å between adjacent lattice planes of the N doped TiO2.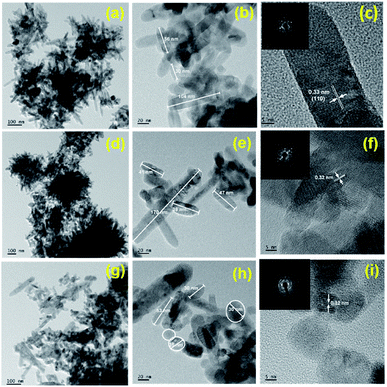 | ||
| Fig. 3 HR-TEM images of (a–c) TN0, (d–f) TN1, and (d–f) TN2; inset c, f and h SAED pattern of TN0, TN2 and TN3 respectively. | ||
It was revealed that with doubling concentration of TiCl4, sample TN3 and TN4 were grown into very fine agglomerated nanorods (Fig. 4). Further, it is observed that these nanorods having size in length 30–40 nm and diameter is around 7–10 nm which is lower than pure TiO2. Fig. 4f inset shows selected area diffraction pattern shows, surprisingly, ring-like pattern unlike TiO2, indicates N-TiO2 nanorods are in polycrystalline nature. From HR-TEM results it is concluded that increase in concentration of TiCl4 and triethylamine reduces the size of the nanorods.
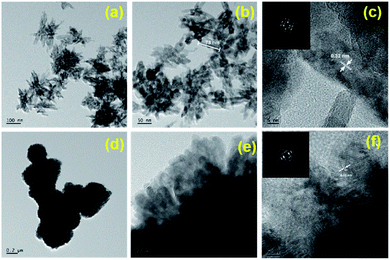 | ||
| Fig. 4 HR-TEM images of (a–c) TN3 and (d–f) TN4; inset c, and f SAED pattern of TN3, and TN4 respectively. | ||
The specific surface area of as-prepared samples was studied by (N2) nitrogen gas adsorption–desorption measurement at 77 K using the Brunauer–Emmett–Teller (BET) method. The N2 adsorption–desorption isotherm of N-TiO2 nanoparticles is shown in Fig. 5. The pure TiO2 shows type IV isotherm according to IUPAC classification,47 which are typical characteristics of a material with pore size in the range of 1.5–100 nm Fig. 5a. The shape of the hysteresis loop is H3 type may associates due to the agglomeration of nanoparticles forming slit-like pores, reflected in TEM images. At higher relative pressure (p/p0) the slope shows increased uptake of adsorbate as pores become filled; inflection point typically occurs near completion of the first monolayer. The BET surface area of pure TiO2 is found to be 21.956 m2 g−1. The pore size distribution of prepared samples was investigated by Barrett–Joyner–Halenda (BJH) method Fig. 5(a)–(c) insets. The average pore diameter of pure TiO2 nanoparticles is 18 nm which demonstrates the material is mesoporous nature. Further, it is observed that the incorporation of nitrogen in TiO2 nanoparticles the surface area shifts towards higher values. The adsorption–desorption isotherms of nitrogen-doped TiO2 samples display the type II isotherm according to IUPAC classification.46 The specific BET surface area of samples TN2 and TN4 are 40.359 m2 g−1 and 53.589 m2 g−1 respectively (Fig. 5b and 4c). This observation specifies a decrease in the particle size of TiO2 nanoparticles specific surface area increases which are in consisting of XRD and TEM results. The Brunauer–Emmett–Teller (BET) specific surface areas, pore volumes and mean pore and mean pore diameters of samples TN0, TN2, and TN4 are summarized in Table 2.
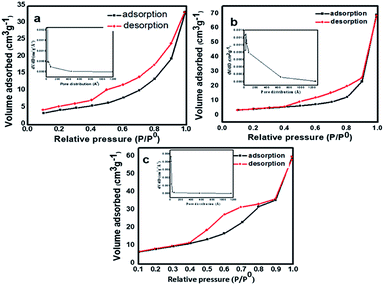 | ||
| Fig. 5 Nitrogen (N2) adsorption–desorption isotherms of (a) TN0 (TiO2), (b) TN2 (N-TiO2), (c) TN4 (N-TiO2). Insets shows their corresponding pore size distributions. | ||
| Sample | Surface area (m2 g−1) | Pore volume (cm3 g−1) | Pore radius (Å) |
|---|---|---|---|
| TN0 | 21.956 | 0.051 | 18.108 |
| TN2 | 40.359 | 0.215 | 30.811 |
| TN4 | 53.589 | 0.101 | 18.041 |
3.3 Optical and electronic property studies
The optical property of the as-synthesized material was analyzed by UV-Vis diffuse absorbance spectra as shown in Fig. 6. Fig. 6 displays the comparative UV-DRS spectra of pristine TiO2 and a series of N doped TiO2 samples. The absorption edge for the pure TiO2 (TN0) is observed at around 410 nm (Fig. 6a), which is consistent with the band gap of the rutile phase.45 The N doped TiO2 nanostructures show strong absorption in the visible region (410–600 nm). The redshift clearly indicates the successful doping of N in the lattice of TiO2. Moreover, as the concentration of triethylamine increases redshift of N-TiO2 also increases which confirms higher nitrogen doping and a higher fraction of absorption of photons from the visible region. The band gap of as-synthesized material calculated by using the Tauc plot shown in Fig. 6 (insets). The band gap (Eg) for the sample TN0, TN1, TN2, TN3, and TN4, were observed to 3.15, 3.09, 3.07, 3.03 and 2.85 eV respectively. The decrease in the band gap is attributed to higher mixing of the (O/N) 2p level is developed in the Ti-3d level falls at the top of the VB, therefore, band gap reduced compared to the pristine TiO2 nanostructure.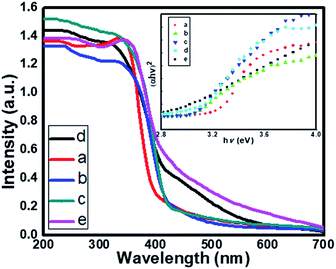 | ||
| Fig. 6 UV-DRS spectra of (a) TN0 (TiO2), (b) TN1 (c) TN2 (d) TN3 (N-TiO2), (e) TN4. Insets shows Tauc plot of TiO2 and N-TiO2 samples. | ||
3.4 FT-IR spectroscopy
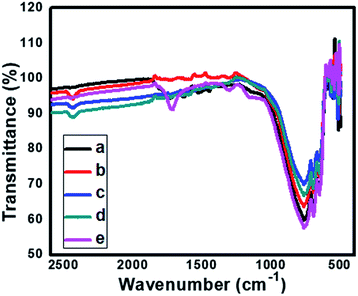
Fig. 7 shows comparative FTIR spectra for pure and N doped TiO2. The absorption peak signal in the range of 400–1100 cm−1 is characteristic of the formation of O–Ti–O lattice. The absorption at 668 cm−1, 601 cm−1, 546 cm−1 and 419 cm−1 corresponds to Ti–O vibrations.48,49 Further, for the sample TN1–TN3 the IR bands centred at 1400–1435 cm−1 indicates nitrogen doping in the TiO2 sample. The band located at 1070 cm−1 is attributed to Ti–N bond vibrations. Also, it is observed that the band at 1335 cm−1 for pure TiO2 is shifted towards longer wavenumber 1430 cm−1 supports for the claim of N doping in TiO2 lattice. Further it is also observed that some of the minor the peaks of pure TiO2 are rather different than the N-doped TiO2, this indicates the incorporation of nitrogen in TiO2 lattices. The peak centered at 1600–2180 cm−1 is ascribed due to –OH stretching frequency. From, IR spectra it is clear that N is successfully incorporated in the lattice of TiO2.3.5 X-ray photoelectron spectroscopy
The XPS were used for chemical identification and electronic state of dopant nitrogen in sample TN2 and TN4. The high resolution XPS spectra of N 1s on deconvolution shows two different peaks at 399.6 and 401.5 eV indicates nitrogen present in two different electronic state (Fig. 8a and b). The peak at 399.6 is attributed to presence of interstitial N or N–Ti–O linkage. The result is consistent with previous reports.43 The peak at 401.5 is attributed to presence of N in oxidized state as NO or NO2. The concentration of nitrogen on surface of TN2 and TN4 are 2.8% and 3.4% respectively. Fig. 8c shows the peak at 458.8 and 458.3 is attributed to Ti 2p3/2 and Ti 2p½, in good agreement the presence of Ti(IV) in TiO2. The peak at binding energy 530.1 and 530.2 eV of sample are attributed to O 1s (Fig. 8d).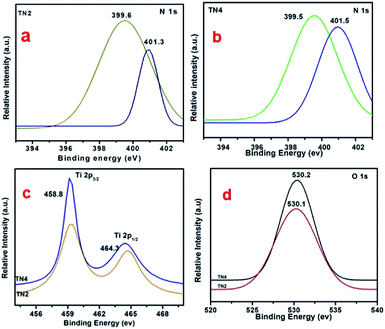 | ||
| Fig. 8 (a and b) High resolution spectrum of N 1s region (c) high resolution spectrum of Ti 2p region (d) high resolution spectrum of O 1s region. | ||
3.6 Catalytic study in synthesis of α-aminophosponates
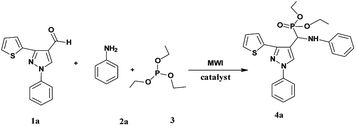
In order to find out the best experimental condition, the reaction of pyrazolaldhyde 1a, aniline 2a and triethylphospite 3 under microwave irradiation is considered as standard model reaction (Scheme 2).In the absence of a catalyst, the standard model reaction gave a small amount of product (Table 3 entry 1). These results specify catalyst is required to occur reaction. In order to check the catalytic utility, the model reaction carried out in the presence of a variety of catalysts (Table 3 entry 2–9). The N-TiO2 NRs gave better results than acetic acid, commercial ZnO and commercial TiO2.
| Entry | Catalyst | Time (minutes) | Yieldb (%) |
|---|---|---|---|
| a Reaction condition: aldehyde(1a) (1 mmol), aniline (1 mmol), triethylphosphite (1.1 mmol), catalyst, MW power 420 watt.b Isolated yield. | |||
| 1 | — | 20 | Trace |
| 2 | Acetic acid | 20 | 30 |
| 3 | Commercial ZnO | 15 | 20 |
| 4 | Commercial TiO2 | 15 | 30 |
| 5 | TN0 | 10 | 72 |
| 6 | TN1 | 10 | 73 |
| 7 | TN2 | 10 | 76 |
| 8 | TN3 | 10 | 85 |
| 9 | TN4 | 10 | 95 |
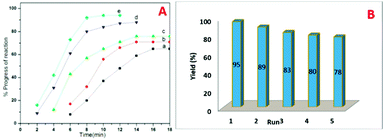
Inspiring these results, we further studied the progress of reaction at different time intervals, we observed the sample N-doped TiO2 catalyzes efficiently than undoped TiO2, and this may be attributed to the higher surface area (Fig. 9A).
The optimum concentration of the catalyst was investigated by performing the model reaction at different concentrations such as 3, 6, 9, 12 and 15 mol%. The reaction yielded in 69, 76, 86, 95 and 95% yields respectively (Table 4). This shows that 12 mol% of TN4 is adequate for the reaction by considering the yield of the product.
To evaluate the effect of solvents, different solvents such as ethanol, methanol, dichloromethane, THF, 1,4-dioxane and toluene were used for the model reaction in presence of N-TiO2 catalyst. The reaction proceed with better yield in polar protic solvent (Table 5, entries 1, 2). However it was observed that the usage of solvents slows down the rate of reaction and gives the desired product in lower yields than that for neat condition (Table 5, entries 1–6).
The recyclability of the catalyst was then examined and the outcomes are shown in Fig. 9B. After the completion of reaction, the reaction mixture was extracted with ethyl acetate. The residual catalyst was washed with acetone, dried under vacuum at 100 °C and reused for consequent reactions. The recovered catalyst could be used for 5 times without obvious loss of catalytic activity.
The difference between the XRD of fresh catalyst and reused catalyst shown in Fig. 10.
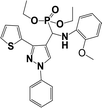
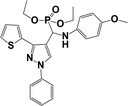
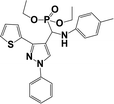
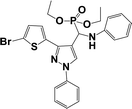
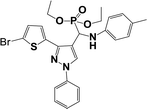
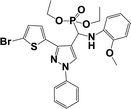
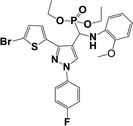
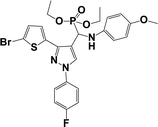
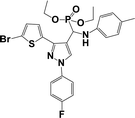
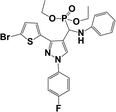
The usefulness of optimized reaction condition for model reaction (12 mmol % of catalyst, solvent-free, MWI) was extended for the synthesis of a series of novel α-aminophosphonates (4a–l) by reacting pyrazoldhyde (1a–c), anilines (2a–d) and triethylphosphite (3) in excellent yields (Scheme 3). The obtained product 4a–l was characterized by spectroscopic techniques (Table 6).
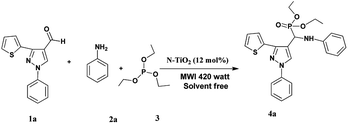 | ||
| Scheme 3 Optimized reaction condition for synthesis of diethyl(1-phenyl-3-(thiophen-2-yl)-1H-pyrazol-4-yl)(phenylamino)methylphosphonates | ||
The spectroscopic data of synthesized compounds are given in ESI (S-2 to S-26).†
4 Conclusions
In summary, we have prepared N doped TiO2 nanorods by thermal hydrolysis method using triethylamine as the source of nitrogen at relatively low temperatures. The XRD analysis showed that with varying composition molar ratios of TiCl4, CH3OH, H2O, and (C2H5)3N, phase composition of rutile to anatase also tunes. FTIR spectra show the chemical environment of doping by the formation of the N–Ti–O and Ti–O–Ti bond. The morphological study performed by the FE-TEM technique shows the formation of well-developed nanorods of size in length 30–40 nm and diameter is around 7–10 nm, which is lower than pure TiO2. Further, BET analysis N-TiO2 shows the maximum specific surface area 53.4 m2 g−1 which is 2.5 times higher than pure TiO2. The as-synthesized materials were employed for the synthesis of α-aminophosphonates via Kabachnik–Fields reaction under microwave irradiation. The N-TiO2 shows remarkable catalytic activity for aminophosphonate derivatives compared with TiO2 and other similar nanocatalysts.Conflicts of interest
There are no conflicts to declare.Acknowledgements
SPK is gratefully acknowledged UGC New Delhi for the award of Senior Research Fellowship (F.11-16/2013(SA-I). The authors are thankful to parent institute Rayat Shikshan Sanstha, Satara.Notes and references
- L. G. Costa, Toxicol. Sci., 2018, 162(1), 24–35 CrossRef CAS PubMed.
- M. Eto, Organophosphorus pesticides, CRC press, 2018 Search PubMed.
- A. Mucha, P. Kafarski and L. Berlicki, J. Med. Chem., 2011, 54(17), 5955–5980 CrossRef CAS PubMed.
- M. K. Awad, M. F. Abdel-Aal, F. M. Atlam and H. A. Hekal, Spectrochim. Acta, Part A, 2018, 206, 78–88 CrossRef PubMed.
- M. M. Azaam, E. R. Kenawy, A. S. El-din, A. A. Khamis and M. A. El-Magd, J. Saudi Chem. Soc., 2018, 22(1), 34–41 CrossRef CAS.
- R. Damiche and S. Chafaa, J. Mol. Struct., 2017, 1130, 1009–1017 CrossRef CAS.
- Z. Chen, P. Marce, R. Resende, P. M. Alzari, A. C. Frasch, J. M. Van den Elsen, S. J. Crennell and A. G. Watts, Eur. J. Med., 2018, 158, 25–33 CrossRef CAS PubMed.
- A. Hellal, S. Chafaa, N. Chafai and L. Touafri, J. Mol. Struct., 2017, 1134, 217–225 CrossRef CAS.
- D. Rogacz, J. Lewkowski, M. Siedlarek, R. Karpowicz, A. Kowalczyk and P. Rychter, Materials, 2019, 12(12), 2018 CrossRef CAS PubMed.
- L. Jin, B. Song, G. Zhang, R. Xu, S. Zhang, X. Gao and S. Yang, Bioorg. Med. Chem. Lett., 2006, 16(6), 537–1543 CrossRef PubMed.
- S. M. Lu and R. Y. Chen, Org. Prep. Proced. Int., 2000, 32(3), 302–306 CrossRef CAS.
- A. G. Nikalje, P. A. Gawhane, S. V. Tiwari, J. N. Sangshetti and M. G. Damale, Anti-Cancer Agents Med. Chem., 2018, 18(9), 1267–1280 CrossRef CAS PubMed.
- C. W. Guo, S. H. Wu, F. L. Chen, Z. Y. Han, X. H. Fu and R. Wan, Phosphorus, Sulfur Silicon Relat. Elem., 2016, 191(9), 1250–1255 CrossRef CAS.
- L. Wu, B. Song, P. S. Bhadury, S. Yang, D. Hu and L. Jin, J. Heterocycl. Chem., 2011, 48, 389–396 CrossRef CAS.
- W. Fan, Y. Queneau and F. Popowycz, RSC Adv., 2018, 8, 31496–31501 RSC.
- B. Rajendra Prasad Reddy, P. Vasu Govardhana Reddy and B. N. Reddy, New J. Chem., 2015, 39, 9605–9610 RSC.
- Y. T. Reddy, P. N. Reddy, B. S. Kumar, P. Rajput, N. Sreenivasulu and B. Rajitha, Phosphorus, Sulfur Silicon Relat. Elem., 2007, 182(1), 161–165 CrossRef CAS.
- H. Fang, X. Xie, B. Hong, Y. Zhao and M. Fang, Phosphorus, Sulfur Silicon Relat. Elem., 2011, 186(11), 2145–2155 CrossRef CAS.
- K. S. Niralwad, B. B. Shingate and M. S. Shingare, Ultrason. Sonochem., 2010, 17(5), 760–763 CrossRef CAS PubMed.
- T. Akiyama, M. Sanada and K. Fuchibe, Synlett, 2003, 10, 1463–1464 CrossRef.
- R. Ghosh, S. Maiti, A. Chakraborty and D. K. Maiti, J. Mol. Catal. A: Chem., 2004, 210(1–2), 53–57 CrossRef CAS.
- Z. P. Zhan and J. P. Li, Synth. Commun., 2005, 35(19), 2501–2508 CrossRef CAS.
- A. S. Paraskar and A. Sudalai, ARKIVOC, 2006, 183–189 Search PubMed.
- K. S. Ambica, S. C. Taneja, M. S. Hundal and K. K. Kapoor, Tetrahedron Lett., 2008, 49, 2208–2212 CrossRef.
- B. C. Ranu, A. Hajraa and U. Jana, Org. Lett., 1999, 1, 1141–1143 CrossRef CAS.
- N. Azizi, F. Rajabi and M. R. Saidi, Tetrahedron Lett., 2004, 45, 9233–9236 CrossRef CAS.
- S. Bhagat and A. K. Chakraborti, J. Org. Chem., 2008, 73, 6029–6032 CrossRef CAS PubMed.
- B. Kaboudin and E. Jafari, Synlett, 2008, 12, 1837–1839 CrossRef.
- S. Bhagat and A. K. Chakraborti, J. Org. Chem., 2007, 72, 1263–1266 CrossRef CAS PubMed.
- A. Elmakssoudi, M. Zahouily, A. Mezdar, A. Rayadh and S. Sebti, C. R. Chim., 2005, 8, 1954–1959 CrossRef CAS.
- A. Tajti, E. Szatmári, F. Perdih, G. Keglevich and E. Balint, Molecules, 2019, 24(8), 1640 CrossRef CAS PubMed.
- S. P. Kunde, K. G. Kanade, B. K. Karale, H. N. Akolkar, P. V. Randhavane and S. T. Shinde, Arabian J. Chem., 2019, 12, 5212–5222 CrossRef CAS.
- S. Ardizzone, C. L. Bianchi, G. Cappelletti, S. Gialanella, C. Pirola and V. Ragaini, J. Phys. Chem. C, 2007, 111(35), 13222–13231 CrossRef CAS.
- J. P. Jalava, Part. Part. Syst. Charact., 2006, 23(2), 159–164 CrossRef CAS.
- M. Pelaez, N. T. Nolan, S. C. Pillai, M. K. Seery, P. Falaras, A. G. Kontos, P. S. Dunlop, J. W. Hamilton, J. A. Byrne, K. O'shea and M. H. Entezari, Appl. Catal. B, 2012, 125, 331–349 CrossRef CAS.
- G. C. Nakhate, V. S. Nikam, K. G. Kanade, S. S. Arbuj, B. B. Kale and J. O. Baeg, Mater. Chem. Phys., 2010, 124(2–3), 976–981 CrossRef CAS.
- D. I. Enache, J. K. Edwards, P. Landon, B. Solsona-Espriu, A. F. Carley, A. A. Herzing, M. Watanabe, C. J. Kiely, D. W. Knight and G. J. Hutchings, Science, 2006, 311, 362–365 CrossRef CAS PubMed.
- B. F. Mirjalilia, A. Bamoniri, A. Akbari and N. Taghavinia, J. Iran. Chem. Soc., 2011, 8, S129–S134 CrossRef.
- L. Kantam, S. Laha, J. Yadav and B. Sreedhar, Tetrahedron Lett., 2006, 47, 6213–6216 CrossRef.
- H. S. Sarvar and M. H. Sarvari, J. Chem. Res., 2003, 2, 176–178 Search PubMed.
- M. Hosseini-Sarvari, Tetrahedron, 2008, 64(23), 5459–5466 CrossRef CAS.
- Y. Wang, L. Zhang, K. Deng, X. Chen and Z. Zou, J. Phys. Chem. C, 2007, 111, 2709–2714 CrossRef CAS.
- L. Hu, J. Wang, J. Zhang, Q. Zhang and Z. Liu, RSC Adv., 2014, 4, 420–427 RSC.
- B. F. Abdel-wahab, R. E. Khidre and A. A. Farahat, ARKIVOC, 2011,(i), 196–245 Search PubMed.
- J. Senthilnathan and L. Philip, Chem. Eng. J., 2010, 16(1–2), 83–92 CrossRef.
- T. C Jagadale, S. P. Takale, R. S. Sonawane, H. M. Joshi, S. I. Patil, B. B. Kale and S. B. Ogale, J. Phys. Chem. C, 2008, 11293, 14595–14602 CrossRef.
- S. Y. Choi, M. Mamak, N. Coombs, N. Chopra and G. A. Ozin, Adv. Funct. Mater., 2004, 14(4), 335–344 CrossRef CAS.
- X. Chen, X. Wang, Y. Hou, J. Huang, L. Wu and X. Fu, J. Catal., 2008, 255(1), 59–67 CrossRef CAS.
- M. Hema, A. Y. Arasi, P. Tamilselvi and R. Anbarasan, Chem. Sci. Trans., 2012, 2, 239–245 CrossRef.
Footnote |
| † Electronic supplementary information (ESI) available. See DOI: 10.1039/d0ra04533k |
| This journal is © The Royal Society of Chemistry 2020 |


