 Open Access Article
Selective oxidation of n-buthanol to butyraldehyde over MnCo2O4 spinel oxides
Gheorghita Mitran *a,
Shaojiang Chen
 b and
Dong-Kyun Seo
 *b
*b
aLaboratory of Chemical Technology and Catalysis, Department of Organic Chemistry, Biochemistry & Catalysis, University of Bucharest, 4-12, Blv. Regina Elisabeta, 030018 Bucharest, Romania. E-mail: geta_mitran@yahoo.com; geta.mitran@chimie.unibuc.ro
bSchool of Molecular Sciences, Arizona State University, Tempe, AZ 85287-1604, USA. E-mail: DSeo@asu.edu
First published on 2nd July 2020
Abstract
Partial oxidation of n-butanol to butyraldehyde, propionaldehyde and acetaldehyde over MnCo2O4 spinel oxides has been investigated. Physicochemical characteristics of samples, prepared by co-precipitation with different amounts of precipitating agent, were studied by XRD, N2 adsorption–desorption isotherms, FT-IR, SEM and XPS. The ratio between the precipitating agent and the precursors has a considerable influence both on the structure, which is evidenced by XRD, due to switching from a crystalline structure to an amorphous one and on the surface (XPS) by an obvious change in the ratio Co3+/Co2+ and Mn4+/Mn3+ and in the content of oxygen vacancies. The reaction rate is not influenced by the oxygen pressure, emphasizing that n-butanol oxidation occurs through the Mars van Krevelen mechanism. The conversion of n-butanol and yield of butyraldehyde are directly proportional to the cobalt content on the surface, while the propionaldehyde yield is proportional to the Mn4+/Mn3+ ratio.
1 Introduction
There is currently a particular interest for oxidation of higher alcohols (chains of more than 4 carbon atoms), due to their ability to convert relatively easy into valuable products such as aldehydes, esters, ethers and oxygenated fuel additives.1–3 n-Butanol is of special interest being considered a good alternative to gasoline compared to ethanol4 since it diminishes the energy crisis and reduces hydrocarbon emissions.The partial oxidation of n-butanol to butyraldehyde has been studied to a lesser extent, although it has particular industrial importance due to its use for obtaining many high-value chemicals.5,6 At the moment, the butyraldehyde production is carried out from propene via hydroformylation (oxo-synthesis), but this reaction presents a number of disadvantages such as the thermodynamically favored product is alkane (from hydrogenation of alkene), takes place at high pressures (200 bar), the reaction is homogeneously catalyzed (carbonyl complexes of cobalt or rhodium) and major products are branched aldehyde not linear which are the desired ones.7,8
Considering the fact that biobutanol can be produced by the biomass feedstock fermentation, its use as a raw material for the production of butyric aldehydes is very attractive in agreement with the current environmental policies. Withal, many chemical industries are oriented towards the development of environmentally friendly and sustainable processes for selective oxidation of alcohols.9–11
The partial oxidation of n-butanol, in the gas phase, was studied over Cu and Ru catalysts with good yields to butyraldehyde,12,13 over Au and Pd supported on titania,9 over LDH-derived Ni-based catalysts14 and over platinum supported mesoporous silica CMI-1.15
Manganese based catalysts supported on Al2O3, CeO2, ZrO2, SiO2 were studied for selective oxidation of 2-butanol to methyl-ethyl-ketone16 revealing that, the presence of Mn3O4 phase is responsible for catalytic activity. Co3O4 catalyst has been studied for the total oxidation of n-butanol17 showing that Co3+/Co2+ couple represents the active site for the oxidation reactions by a redox mechanism.
After our knowledge, spinel type MnCo2O4 oxides have not so far been studied in the partial oxidation of n-butanol. Among other spinel oxides, those of cobalt–manganese are particularly interesting because they contain metals with more than one oxidation state, which could be placed in any of the two sites (tetrahedral or octahedral), modifying the structural and respectively chemical properties. The difficulty for this type of oxides is represented by the identification of the oxidation state and the cations distribution in tetrahedral or octahedral sites.18 The cobalt and manganese cations in superior oxidation states, Co3+, Mn3+ and Mn4+ are usually placed in octahedral positions, while the cations in inferior oxidation state (Co2+, Mn2+) have no preference.
Herein, we have evaluated the behavior of cobalt-manganese spinel oxides, prepared by coprecipitation using different molar ratio between the precipitation agent and Co + Mn, in selective oxidation of n-butanol to butyraldehyde.
2 Experimental
2.1. Catalysts preparation
The spinel type oxides based on cobalt and manganese, with formula MnCo2O4 were prepared by co-precipitation method. For this purpose, the mixture of (CH3COO)2Co·4H2O (99.99% from Merck) and (CH3COO)2Mn·4H2O (99.99% from Merck) solutions in water has been homogenized by stirring for 30 min. Ammonium carbonate (99.99% from Merck), dissolved in water, was chosen as a precipitating agent, with different (Co + Mn)/NH4+ molar ratios (1![[thin space (1/6-em)]](https://www.rsc.org/images/entities/char_2009.gif) :
:![[thin space (1/6-em)]](https://www.rsc.org/images/entities/char_2009.gif) 2, 1
2, 1![[thin space (1/6-em)]](https://www.rsc.org/images/entities/char_2009.gif) :
:![[thin space (1/6-em)]](https://www.rsc.org/images/entities/char_2009.gif) 3, 1
3, 1![[thin space (1/6-em)]](https://www.rsc.org/images/entities/char_2009.gif) :
:![[thin space (1/6-em)]](https://www.rsc.org/images/entities/char_2009.gif) 4), denoted MnCo2O4(2), MnCo2O4(3) and respectively MnCo2O4(4). The precipitating agent was added dropwise, with continuous stirring, over the precursor solution. The obtained precipitates were separated through centrifugation, washed for more times with distilled water, dried at 60 °C for 24 h and calcined at 500 °C (5 °C min−1) for 6 h.
4), denoted MnCo2O4(2), MnCo2O4(3) and respectively MnCo2O4(4). The precipitating agent was added dropwise, with continuous stirring, over the precursor solution. The obtained precipitates were separated through centrifugation, washed for more times with distilled water, dried at 60 °C for 24 h and calcined at 500 °C (5 °C min−1) for 6 h.
2.2. Catalysts characterization
The samples structure was analyzed with a PANalyticalX'Pert Pro MRD X-ray diffractometer with a Cu Kα radiation (λ = 0.1514 nm). Data were recorded in the 2θ range of 5–80° with a step size of 0.0251°. The specific surface area (determined by the Brunauer–Emmett–Teller (BET) methods, in the relative pressure region P/P0 0.06–0.2) and the porosity measurements (calculated by Barrett–Joyner–Halenda (BJH) method) were performed from the nitrogen adsorption–desorption isotherms, using a Micromeritics ASAP 2020. Scanning electron microscope (SEM) morphology and the energy dispersive X-ray (EDX) composition of the samples were collected on a XL-30 Environmental SEM. X-ray photoelectron spectra (XPS) were collected on a VG-220IXL spectrometer equipped with a monochromated Al Kα radiation (1486.6 eV, line width 0.8 eV), and the energy resolution of 0.4 eV. The C1s peak (284.8 eV) was used as a reference. Deconvolution of spectra was recorded with CASAXPS software, using the Shirley background. Information on metal oxygen linkages was obtained by Fourier transform infrared (FT-IR) with a Bruker IFS 66 V/S spectrometer, equipped with a diamond attenuated total reflectance (ATR), with a resolution of 4 cm−1, covering a spectral range of 400–4000 cm−1.2.3. Catalytic activity test
The partial oxidation of n-butanol has been carried out in a continuous-flow fixed bed reactor (8 mm i.d.) at atmospheric pressure. The reaction temperature, monitored by electronic control, was varied in the range 100–250 °C. The mixture of reaction has been achieved by passing air through a stainless steel saturator with n-butanol, enabling an n-butanol concentration of 400 ppmv in air. The saturated vapor pressure of butanol was determined from Antoine equation and used for calculation of ppmv concentration. The amount of catalyst used was 0.2 g. The space velocity, expressed as Freactants/Wcat, was varied between 9000 and 21![[thin space (1/6-em)]](https://www.rsc.org/images/entities/char_2009.gif) 000 mL g−1 h−1.
000 mL g−1 h−1.
The analysis of reactants mixture and the reaction products (after a stabilization time of 30 min) was performed with a GC K072320 Thermo-Quest gas chromatograph equipped with an FID detector. The n-butanol conversion and the products yields were determined from three successive measurements with formulas:
where SD – standard deviation, n – number of measurements,
![[x with combining macron]](https://www.rsc.org/images/entities/i_char_0078_0304.gif) – the mean of xi
– the mean of xi
3 Results and discussion
3.1. Characterization of catalysts
In order to investigate the specific surface areas and pore-size distribution of MnCo2O4 catalysts, Brunauer–Emmett–Teller (BET) gas-sorption measurements were performed. N2 adsorption–desorption isotherms at 77 K are presented in Fig. 1. Likewise, the specific surface area, pore volume and average pore diameter are shown in Table 1. The isotherms could be classified as type IV with a type H1 hysteresis loop, characteristic for mesoporous structure. The average pore diameter, from BJH desorption, is about 14.0 nm for sample 1, and respectively 12.1 nm for samples 2 and 3, confirming that all the samples contain mesoscale pores. Also, the size distribution is very narrow the majority of pores are in the range 9–15 nm. The (Co + Mn)/NH4+ molar ratios did not affect the volume of mesoporous, keeping it at 0.27 cm3 g−1 irrespective of the amount of ammonium used. Conversely, the specific surface area increases at ammonium amount increasing from 71 to 86 m2 g−1.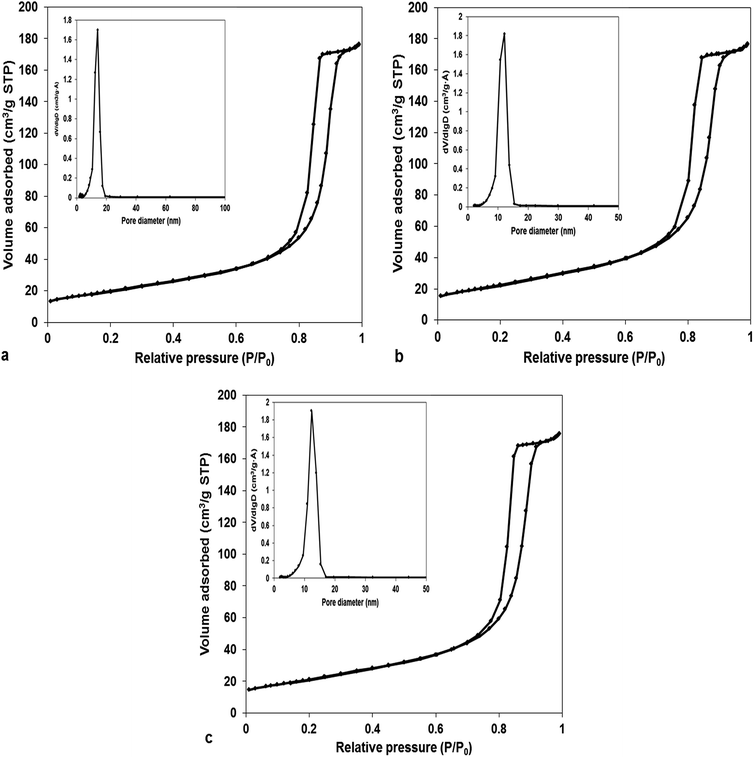 | ||
| Fig. 1 N2 adsorption–desorption isotherm and pore size distribution of MnCo2O4 samples: (a) MnCo2O4(2); (b) MnCo2O4(3); (c) MnCo2O4(4). | ||
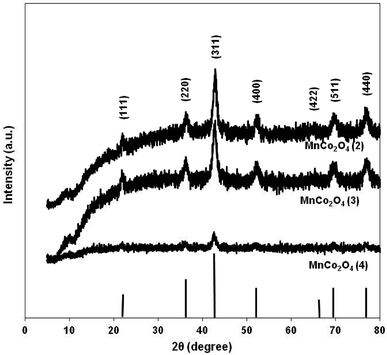
Diffraction patterns of samples are shown in Fig. 2. The diffraction peaks of the first two catalysts correspond to mesoporous MnCo2O4 spinel oxide phases (Card PDF 01-084-0482) and show better crystallinity than the third catalyst. The purity of all prepared samples was evidenced by the absence of other peaks than those corresponding to MnCo2O4 spinel. The cell parameter “a” increases from 8.11 Å for MnCo2O4(2), to 8.12 Å for MnCo2O4(3) and respectively 8.16 Å for MnCo2O4(4) catalyst. The cell parameter “a” has been determined from line corresponding to 2θ = 42.5° and Miller indices (hkl-311). The standard deviation for cell parameters is ±0.005 Å. A peak broadening has been highlighted for the (311) plane of all samples. Usually, a peak broadening is correlated with the decreasing of crystallite size and stress/strains induced in the nanoparticles.19 The average crystallite size (d) was calculated with the Scherrer formula:
d = 0.9λ/β![[thin space (1/6-em)]](https://www.rsc.org/images/entities/char_2009.gif) cos cos![[thin space (1/6-em)]](https://www.rsc.org/images/entities/char_2009.gif) θ θ |
The FT-IR spectra for all samples are shown in Fig. 3. Three distinctive bands are observed in the spectrum, at 655 cm−1 corresponding to the stretching vibration of Co2+–O bond located in tetrahedral units of the spinel structure, at 551 cm−1 corresponding to octahedral units of Co3+–O and at 500 cm−1 which corresponds of Mn3+(Mn4+)–O from the octahedral positions of the spinel.20 The peaks corresponding to octahedral positions are shifted towards higher wavenumber from first to third catalyst, emphasizing that the interactions between Co and Mn are different in the three samples.
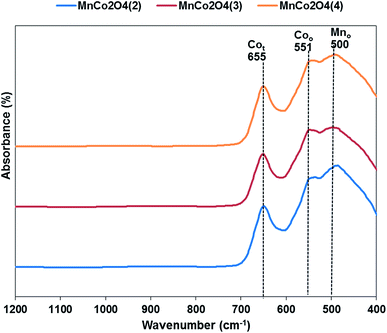 | ||
Fig. 3 FT-IR spectra of MnCo2O4 nanoparticles synthesized by coprecipitation with different (Co + Mn)/NH4+ molar ratios (1![[thin space (1/6-em)]](https://www.rsc.org/images/entities/char_2009.gif) : :![[thin space (1/6-em)]](https://www.rsc.org/images/entities/char_2009.gif) 2, 1 2, 1![[thin space (1/6-em)]](https://www.rsc.org/images/entities/char_2009.gif) : :![[thin space (1/6-em)]](https://www.rsc.org/images/entities/char_2009.gif) 3, 1 3, 1![[thin space (1/6-em)]](https://www.rsc.org/images/entities/char_2009.gif) : :![[thin space (1/6-em)]](https://www.rsc.org/images/entities/char_2009.gif) 4). 4). | ||
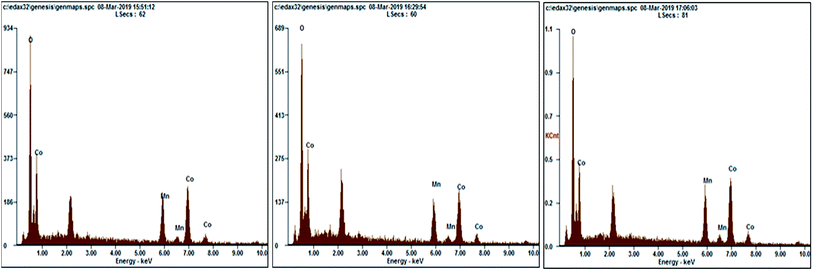
The bulk composition of MnCo2O4 nanoparticles was determined by EDX analysis and is shown in Table 2 and Fig. 4, and has been observed that Co, Mn and O are the main detected elements. The atomic compositions determined by EDX emphasize that the ratio between Co and Mn is very closed to 2, while the ratio between O and Co and between O and Mn is lower than the one calculated (2) suggesting the existence of oxygen vacancies in the prepared samples.
| Catalyst | Wt (%) | At (%) | Co/Mn | O/Co | O/Mn | ||||
|---|---|---|---|---|---|---|---|---|---|
| Co | Mn | O | Co | Mn | O | ||||
| MnCo2O4(2) | 53.69 | 23.9 | 22.41 | 33.17 | 15.84 | 50.99 | 2.09 | 1.53 | 3.2 |
| MnCo2O4(3) | 52.21 | 23.58 | 24.21 | 31.32 | 15.18 | 53.50 | 2.06 | 1.70 | 3.5 |
| MnCo2O4(4) | 55.72 | 23.95 | 20.32 | 35.66 | 16.44 | 47.90 | 2.16 | 1.34 | 2.9 |
The morphology of synthesized MnCo2O4 samples (Fig. 5) investigated by SEM evidenced the presence of microspheres that are formed by the aggregation of nanoparticles, with a hierarchical structure well-defined and well-dispersed like a flower.
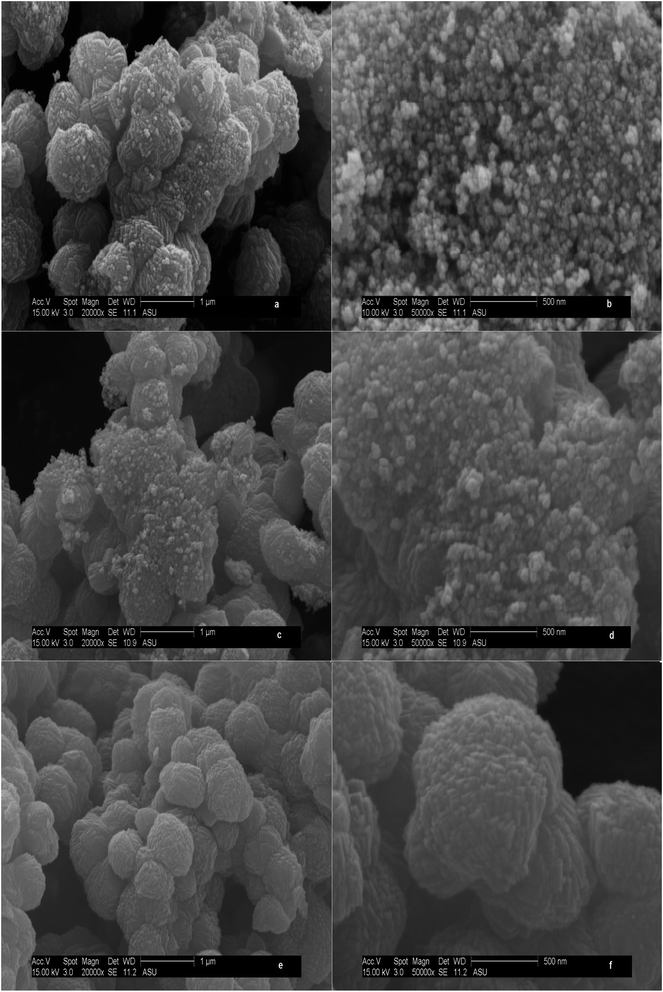 | ||
| Fig. 5 SEM images of MnCo2O4 spinel oxides: (a and b) MnCo2O4(2), (c and d) MnCo2O4(3), (e and f) MnCo2O4(4). | ||
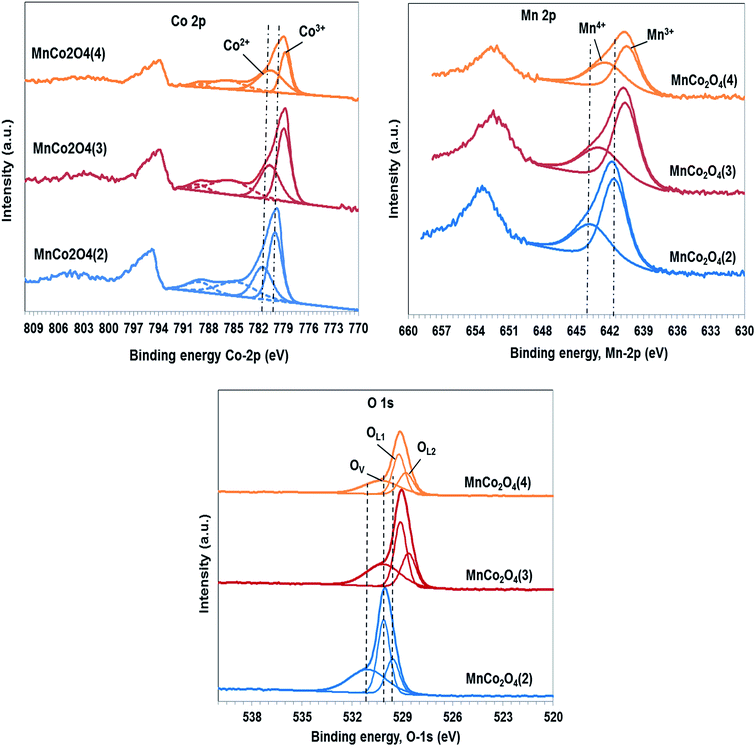
The identification of the chemical states and the composition of species on the surface were carried out using XPS spectra of all samples that are shown in Fig. 6. The peak of C 1s, which is used as standard, was evidenced at 284.8 eV. The Co 2p3/2 spectra confirm the presence of Co2+ and Co3+ on the surface. The binding energies of Co2+ species are located in the region 780.6–781.5 eV, the value of binding energy decreasing continuously from the first to the third catalyst. The Co3+ species present peaks in the region 778.8–780 eV, the binding energy decreasing in the same order, which indicates a decrease in the interaction between Co and Mn in the same order. The satellite peak at 784.6–785.3 eV is ascribed to Co2+ in tetrahedral oxygen coordination while the satellite peak from 789.1 eV is characteristic of Co3+ species in octahedral coordination, according to literature data.21
The ratio between Co3+/Co2+ also decreases from first to last catalyst (Table 3) from 1.53 to 1.41 and respectively to 0.73. The species of cobalt with lower valence do not contribute to oxygen vacancies formation, therefore it is expected that by increasing of Co3+ composition to increase the percentage of oxygen vacancies by the process: 2Co3+ + O2− → 2Co2+ + □ + 1/2O2.
The spectra of Mn 2p3/2 confirm the presence of Mn3+ and Mn4+ as the major manganese species. The peak corresponding to Mn3+ is located at 640.5–641.6 eV22 the binding energy values decreasing at NH4+/(Co + Mn) molar ratio in the catalysts preparation increasing. The peak at 642.3–643.6 eV corresponds to Mn4+ cations being shifted in the same order as that of Mn3+ cations. The ratio between Mn4+/Mn3+ increases in order MnCo2O4(2) (0.59) < MnCo2O4(3) (0.61) < MnCo2O4(4) (0.83), in the same way should increase the percentage of oxygen vacancies. The ratio Co/Mn on the surface is 2 for the first sample while for the second and the third sample is approximately 1.5.
The O 1s peaks are fitted at 528.6–530.1 eV, typical for lattice oxygen in the metal–oxygen bond23 which is split into two peaks, one corresponding to oxygen lattice of cobalt oxide (OL1), and the other to oxygen lattice of manganese oxide (OL2); while the peak situated at 530.2–531.0 eV is associated with oxygen defects in the subsurface. Percentage of lattice oxygen corresponding to cobalt oxide decrease at Co/Mn ratio decreasing, while the percentage of lattice oxygen corresponding to manganese oxide increase at manganese composition on the surface increasing. The composition of oxygen defects, on the surface of the first sample, is with approximately 2–2.5% more than for the others. Presence of oxygen vacancies can promote Co3+ and respectively Mn4+ formation that contribute to active oxygen species apparition like peroxo (O22−) or superoxo (O2−) on the catalyst surface. The standard deviation for composition of oxygen defects has been of ±5%.
3.2. Catalytic activity
The partial oxidation of n-butanol, in the gas phase, was studied over MnCo2O4 catalysts. The n-butanol conversion and the products yields as a function of reaction temperature, for three successive measurements, over all studied catalysts are shown in Fig. 7. The experimental errors are up to ±5%, as shown in error bars from graphs. The conversion increased with temperature increasing for all catalysts. The catalyst with ratio (Co + Mn)/NH4+ equal with 2 showed a higher conversion compared to others, in the case of the other two catalysts the conversion decreases with increasing of the ammonium content. The T50 temperature (50% n-butanol conversion) is at 120 °C, for the first catalyst, at 148 °C and respectively 165 °C for the second and third catalyst. The activity was improved by the presence of spinel structure as could be observed from XRD patterns.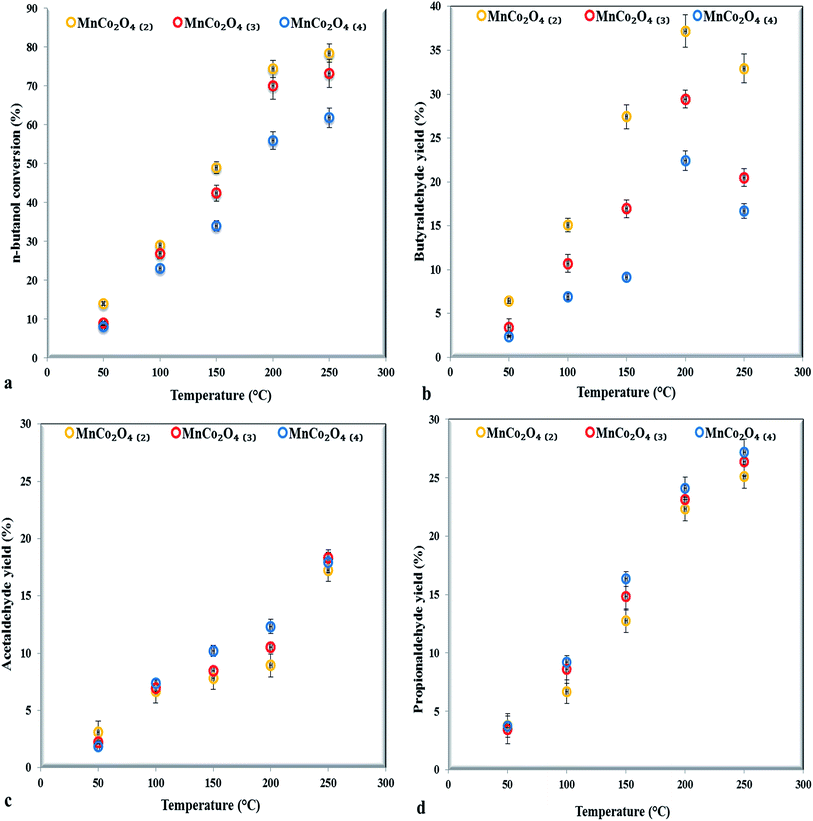 | ||
| Fig. 7 The catalytic performance of MnCo2O4 samples for n-butanol selective oxidation (a), butyraldehyde (b), acetaldehyde (c) and propionaldehyde (d) yield (0.2 g catalyst, 400 ppmv n-butanol). | ||
The major products observed are butyraldehyde, propionaldehyde and acetaldehyde while formaldehyde was detected in traces. The n-butyraldehyde yields increased with temperature increasing, reaching a maximum at 200 °C then decreasing, probably due to the secondary combustion reactions of butyraldehyde, as observed by Jiang24 in partial oxidation reaction of butanol to butyraldehyde over a series of perovskites with Mn, Fe and Co. The highest yield in butyraldehyde (37%) was achieved on the first samples with higher ratio Co/Mn and Co3+/Co2+ (from XPS). Our results are in agreement with those reported by Xie25 in carbon monoxide oxidation observing that Co3+ represents the active site for reaction, while the Co2+ was almost inactive.
The propionaldehyde and acetaldehyde yields, conversely, increased with temperature increasing, in line with the increase of Mn4+/Mn3+ ratio, proving that manganese is more effective for breaking of C–C bonds than cobalt. The presence in octahedral positions of both cobalt and manganese trivalent and tetravalent cations leads to appearance of active sites, octahedral positions being more reactive than tetrahedral ones towards the oxidation reactions that occur by Mars–van-Krevelen mechanism.26
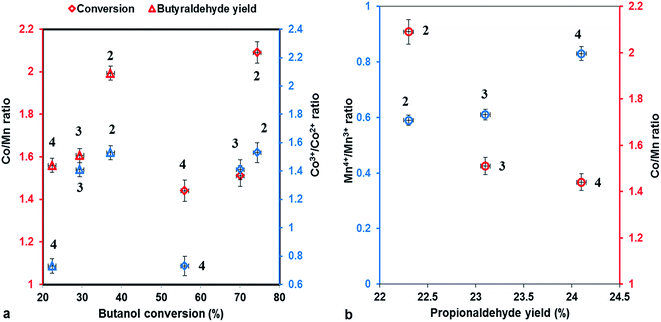
The correlation between conversion of butanol, yield of butanal, respectively propanal and Co/Mn, Co3+/Co2+, Mn4+/Mn3+ ratios is shown in Fig. 8, emphasizing that the conversion and the butanal yield depend of Co/Mn ratio and Co3+/Co2+ ratio, being directly proportional to them, while the propanal yield increase to Mn loading and Mn4+/Mn3+ ratio increasing.
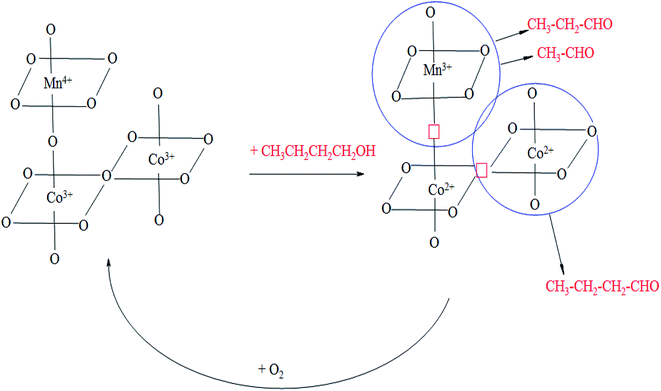
Based on these findings we propose the following scheme of oxidation of n-butanol on the studied catalysts (Scheme 1).
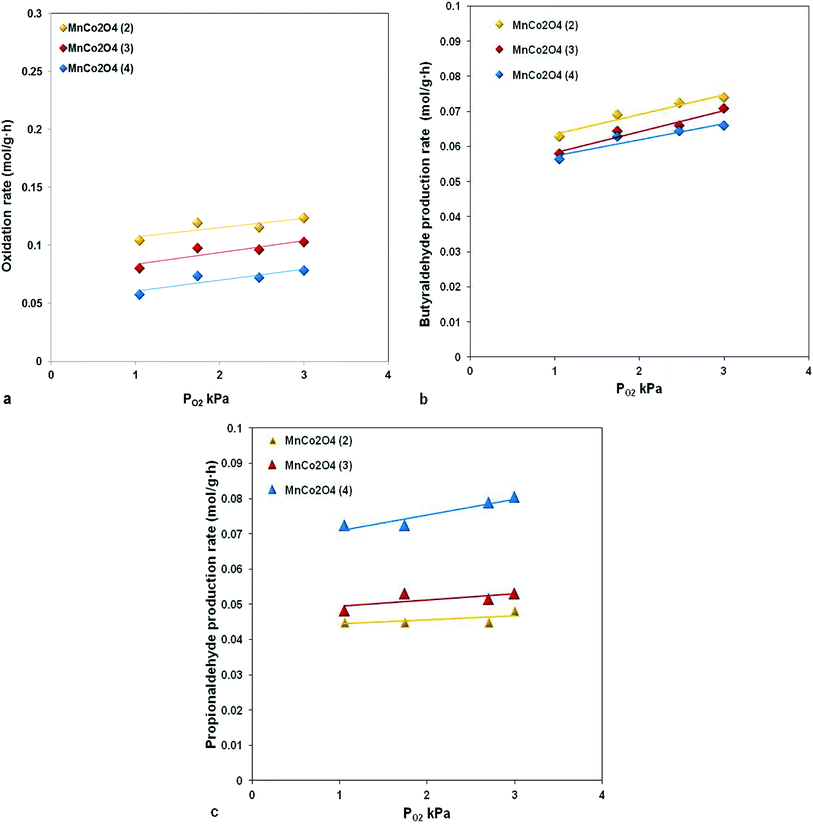
The reaction rate dependence as function of oxygen partial pressure, presented in Fig. 9, evidenced that an increasing in oxygen partial pressure almost does not have any influence on the reaction rate both in terms of reactants and reaction products. This type of behavior is specific to the reactions which occur through the Mars van Krevelen mechanism, where the lattice oxygen is implied in oxidation reaction.
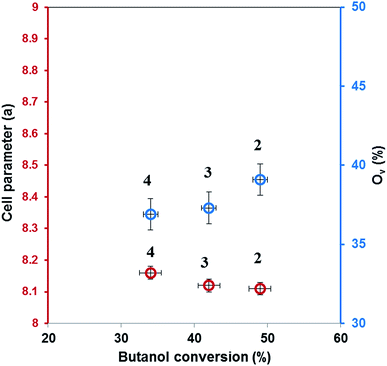
For our catalysts the presence of oxygen vacancies which ensure the mobility of lattice oxygen is evidenced from XRD by decreasing of lattice parameter and from XPS, the catalyst with lowest parameter and with highest concentration of active oxygen species, MnCo2O4(2), has the highest activity (Fig. 10).
4 Conclusions
Partial oxidation of n-butanol over cobalt–manganese spinel oxides, prepared by coprecipitation with different amounts of ammonium carbonate, has been examined. The active sites for this reaction are represented by the Co3+ cations and Mn3+/Mn4+ cations, situated in octahedral positions, these being more reactive than tetrahedral position towards the oxidation reactions, that occur by Mars–van-Krevelen mechanism.The n-butanol conversion and the yield to butyraldehyde are directly proportional to Co/Mn ratio and Co3+/Co2+ ratio, while the propionaldehyde yield increase to Mn loading and to Mn4+/Mn3+ ratio increasing.
The oxygen vacancies presence ensures lattice oxygen mobility, contributing to increasing the concentration of active oxygen species and respectively to increase the catalytic activity.
Conflicts of interest
There are no conflicts to declare.References
- R. B. Wagh and J. M. Nagarkar, Tetrahedron Lett., 2018, 59, 3443–3447 CrossRef CAS.
- M. Amini, M. Mahdi Najafpour, M. Zare and E. Amini, J. Mol. Catal. A: Chem., 2014, 394, 303–308 CrossRef CAS.
- F. Saberi, D. Rodríguez-Padrón, E. Doustkhah, S. Ostovar, A. Franco, H. Reza Shaterian and R. Luque, Catal. Commun., 2019, 118, 65–69 CrossRef CAS.
- M. Franco Finol, J. Rooke, S. Siffert, R. Cousin, P. Carniti, A. Gervasini, J.-M. Giraudon, B.-L. Su and J.-F. Lamonier, New J. Chem., 2014, 38, 1988–1995 RSC.
- A. Mahajan, S. Banik, D. Majumdar and S. K. Bhattacharya, ACS Omega, 2019, 4, 4658–4670 CrossRef CAS PubMed.
- I. Gandarias, E. Nowicka, B. J. May, S. Alghareed, R. D. Armstrong, P. J. Miedziak and S. H. Taylor, Catal. Sci. Technol., 2016, 6, 4201–4209 RSC.
- A. Haynes, P. M. Maitlis, G. E. Morris, G. J. Sunley, H. Adams, P. W. Badger, C. M. Bowers, D. B. Cook, P. I. Elliott, T. Ghaffar, H. Green, T. R. Griffin, M. Payne, J. M. Pearson, M. J. Taylor, P. W. Vickers and R. J. Watt, J. Am. Chem. Soc., 2004, 126, 2847–2861 CrossRef CAS PubMed.
- H. Bahrmann, H. Bach, Ullmann'S Encyclopedia of Industrial Chemistry: Oxo Synthesis, Wiley-VCH Verlag GmbH & Co. KGaA, 7th ed, 2005 Search PubMed.
- Y. Khan, M. Marin, T. Viinikainen, J. Lehtonen, R. L. Puurunen and R. Karinen, Appl. Catal., A, 2018, 562, 173–183 CrossRef CAS.
- W. Huang, B. Chiyin Ma, H. Lu, R. Li, L. Wang, K. Landfester and K. A. I. Zhang, ACS Catal., 2017, 78, 5438–5442 CrossRef.
- H. B. Ji, K. Ebitani, T. Mizugaki and K. Kaneda, Catal. Commun., 2002, 3(11), 511–517 CrossRef CAS.
- J. Requies, M. B. Güemez, A. Iriondo, V. L. Barrio, J. F. Cambra and P. L. Arias, Catal. Lett., 2012, 142, 417–426 CrossRef CAS.
- J. Requies, M. B. Güemez, P. Maireles, A. Iriondo, V. L. Barrio, J. F. Cambra and P. L. Arias, Appl. Catal., A, 2012, 423–424, 185–191 CrossRef CAS.
- L. Huang, J. Zhou, A. T. Hsu and R. Chen, Int. J. Hydrogen Energy, 2013, 38, 14550–14558 CrossRef CAS.
- S. Sabour, C. Especel, C. Fontaine, M. Bidaoui, L. Benatallah, N. Saib-Bouchenafa, J. Barbier Jr and O. Mohammedi, J. Mol. Catal. A: Chem., 2016, 420, 50–55 CrossRef CAS.
- K. Prabu, M. Prabu, A. K. Venugopal, A. T. Venugopalan, W. V. Y. S. Sandilya, C. S. Gopinath and T. Raja, Appl. Catal., A, 2016, 525, 237–246 CrossRef CAS.
- P. Mountapmbeme Kouotou and Z. Y. Tian, Surf. Coat. Technol., 2017, 326, 11–17 CrossRef CAS.
- A. N. Naveen and S. Selladurai, Physica B, 2015, 457, 251–262 CrossRef CAS.
- R. Tholkappiyan, A. Nirmalesh Naveen, S. Sumithra and K. Vishista, J. Mater. Sci., 2015, 50(17), 5833–5843 CrossRef CAS.
- K. Cheng, F. Yang, G. Wang, J. Yin and D. Cao, J. Mater. Chem. A, 2013, 1, 1669–1676 RSC.
- L. Daheron, R. Dedryvere, H. Martinez, M. Menetrier, C. Denage, C. Delmas and D. Gonbeau, Chem. Mater., 2008, 20, 583–590 CrossRef CAS.
- J. M. Cerrato, M. F. Hochella Jr, W. R. Knocke, A. M. Dietrich and T. F. Cromer, Environ. Sci. Technol., 2010, 441, 55881–55886 Search PubMed.
- J. F. Marco, J. R. Gancedo, M. Gracia, J. L. Gautier and F. J. Berry, J. Solid State Chem., 2000, 153, 74–81 CrossRef CAS.
- B. S. Jiang, R. Chang, Y. C. Hou and Y. C. Lin, Ind. Eng. Chem. Res., 2012, 51, 13993–13998 CrossRef CAS.
- X. Xie, Y. Li, Z. Q. Liu, M. Haruta and W. Shen, Nature, 2009, 458, 746–749 CrossRef CAS PubMed.
- A. Choya, B. Rivas, J. I. Gutiérrez-Ortiz and R. López-Fonseca, Catalysts, 2018, 8, 427 CrossRef.
| This journal is © The Royal Society of Chemistry 2020 |


