 Open Access Article
Preparation of Ti, Ti/TiC or Ti/TiN based hollow fibres with extremely low electrical resistivity†
Ronald P. H. Jonga,
Piotr M. Krzywda ab,
Nieck E. Benes
 b and
Guido Mul
 *a
*a
aPhotocatalytic Synthesis Group, Faculty of Science & Technology of the University of Twente, PO Box 217, Enschede, The Netherlands. E-mail: g.mul@utwente.nl
bMembrane Science and Technology Cluster, Faculty of Science & Technology of the University of Twente, PO Box 217, Enschede, The Netherlands
First published on 28th August 2020
Abstract
Porous Ti based hollow fibres with extremely low electrical resistivity (4.1–9.6 μΩ m), orders of magnitude smaller than reported for Ti-fibres in the literature, were produced by dry-wet spinning of a mixture of Ti-particles, polyethersulfone (PES), and N-methylpyrrolidone (NMP). Utilizing a two-step thermal decomposition of PES, consisting of treatment in air at 475 °C, followed by treatment in argon at 800 °C, hollow fibres of entirely metallic Ti are obtained, as confirmed by XRD, SEM-EDS, and TGA-MS analyses. Only a thin oxide layer is formed due to ambient surface oxidation, as identified by XPS analysis. Carbonization of the polymer under an inert atmosphere can be used to produce a Ti/TiC-composite. To obtain a Ti/TiN composite, the porous Ti-tubes can be treated in nitrogen atmosphere at 800 °C. The porosity, pore size distribution, and bending-strength of the fibres were determined for a low (800 °C) and high (1100 °C) degree of sintering, and it was found that these are largely independent of the chemical surface composition. The presence of TiC or TiN, likely in an outer, but crystalline shell (based on XRD and XPS data), results in lower resistivity than of the pure Ti fibres, which can be attributed to the insulating layer of TiC or TiN preventing capacitive effects at the Ti/air interface. The developed preparation methodology results in porous metallic and composite Ti based fibres, which are very suitable for electrochemical applications.
Introduction
Inorganic membranes in tubular form (also called hollow fibres) can be produced using a scalable dry-wet spinning method. Ceramic fibres, based on e.g. Al2O3, as well as metallic fibres made of stainless steel, Cu, Ni or Ti have been previously prepared using this method.1–4 Inorganic hollow fibres have been investigated as electrode materials and recent study of electrochemical reduction of CO2, using Cu-based fibres, indicates significant application potential.3,5,6 Ti is also an attractive metal for electrochemical applications due to various properties such as a high conductivity, favourable mechanical strength, and high corrosion resistance.7 Ti furthermore is utilized in structural and bio-medical applications.8 The same application window exists for TiN or TiC, while coating of Ti with a layer of TiN or TiC further improves the corrosion resistance and the mechanical strength.8 While the effect of the temperature of sintering, ranging from 1100 to 1500 °C, on the properties of Ti-hollow fibres has been previously addressed,4 to the best of our knowledge, methods to control the chemical composition of porous Ti hollow fibres have not been developed. Ti readily oxidizes at elevated temperatures, resulting in fibres with a high electrical resistivity. Furthermore, Ti becomes highly reactive towards many substrates, e.g. used as crucibles, above 800 °C,9 and any reductive H2 treatment at elevated temperatures could cause embrittlement.10In this work the synthesis of Ti hollow fibres is reported with focus on the process conditions during the thermal treatment steps, to control the decomposition chemistry of the polymer and the resulting composition of the sintered Ti-particles. We demonstrate that metallic Ti can be obtained without any reductive H2 treatment, if Ti oxidation is limited to a semi-stable oxide layer by applying relatively low temperatures in air.11–15 This TiOx-layer can be reduced to Ti, under the appropriate conditions, by reaction with carbon residues of the decomposed polymer. This is possible due to the two step decomposition behaviour of polyethersulfone (PES), used in the preparation of the fibers.16,17 It is furthermore shown that carbonization of the polymer under an inert atmosphere can be used to produce a Ti/TiC-composite. The resulting TiC content has been analysed by XRD and XPS. To further evaluate the effect of a poor conducting shell on the properties of Ti hollow fibres, the porous metallic Ti hollow fibre was treated in nitrogen atmosphere to create a Ti/TiN composite.18–20 The properties of the resulting fibers (Ti, Ti/TiC and Ti/TiN), including porosity, pore size distribution, bending strength and resistivity, are reported for a low (800 °C) and high (1100 °C) degree of sintering.
Experimental
Materials
Titanium powder (ASTM, grade 2), particle size average 6 μm, was obtained from TLS Technik GmbH & Co. Polyethersulfone (PES, Ultrason E 6020P, BASF) was used as binder, and N-methylpyrrolidone (NMP, Sigma Aldrich) as solvent.Dry-wet spinning
The porous tube electrodes were produced by a dry-wet spinning method.1–4 During dry-wet spinning the homogenous spinning mixture is introduced to a non-solvent (water is commonly used). Solvent exchange occurs between the solvent and non-solvent resulting in a phase inversion, and solidification of the previously dissolved polymer. The spinning mixture consisted of 69.8 wt% Ti, 22.7 wt% NMP and 7.5 wt% PES for a total weight of 150 g. Ti powder was added to the NMP while stirring; this suspension underwent 30 minutes of ultrasonic treatment. PES (kept at 120 °C before addition) was added in four equivalent portions with an interval of 2 hours between each addition. The resulting mixture was stirred for 1.5 days. Hereafter, the mixture was transferred to the spinning vessel and kept under vacuum prior to use (overnight). The spinneret had an outer diameter of 2.0 mm and an inner diameter of 0.8 mm. For the bore liquid and coagulation bath demineralised water was used. The air gap was set to 20 mm. The bore liquid flow rate was set to 7 mL min−1 and 3 bar of N2 pressure was used to extruded the mixture. After spinning, the green fibres were kept in a demineralized water bath for 2 days, followed by drying for another 2 days under ambient conditions. A movie of the spinning process can be found in the ESI.†Thermal treatment
Three types of Ti-based porous tube electrodes are discussed in this work, namely; Ti, Ti/TiC and Ti/TiN. For each of these three types two sets were made; one without severe sintering (thermal treatment up to 800 °C) and one after thermal treatment up to 1100 °C (in the case of Ti/TiN prior to reaction with N2). Each type and set requires its own specific treatment, which is described in Table 1. It is to be noted that the incorporation of nitrogen, to obtain the Ti/TiN samples, is an additional step of the material obtained after steps Ti-2 and Ti-3. It was found that Ti can reduce Al2O3 at 800 °C, therefore a quartz (SiO2) substrate which does not exhibit any reaction with Ti at 800 °C was applied instead. However, at temperatures above 800 °C, an exchange between Ti and SiO2 was noticed; to prevent this a Mo-foil substrate was used when preparing samples at 1100 °C.9 The substrates (crucibles) used in steps Ti-1 and Ti-2 needed to be cleaned after use to remove any organic residue. The removal of Ti dust from the Ti-2 substrate is also necessary as the Ti/TiOx/C sample is very brittle. Keeping the substrate clean is much more feasible when using Al2O3 (cleaning by thermal oxidation) or quartz (acid cleaning), rather than Mo. The Mo substrate was therefore only used for treatment of the samples at 1100 °C, after initial sintering in quartz at 800 °C.The process conditions are given in Table 1 and a processing scheme is presented in Fig. 1 to summarise the procedures. The obtained samples from the previously discussed treatments are denoted Ti, Ti-s, Ti/TiC, Ti/TiC-s, Ti/TiN and Ti/TiN-s in the remainder of the text. These notations indicate the respective material; Ti metal, Ti/TiC composite and Ti/TiN composite, accompanied by “-s” to indicate the additional sintering step at 1100 °C.
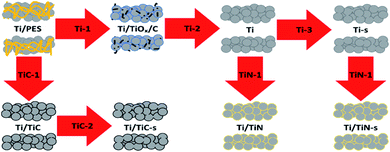 | ||
| Fig. 1 Processing scheme of green fibre (Ti + PES) after spinning to obtain Ti, Ti/TiC and Ti/TiN porous tubes. | ||
Characterization
The obtained porous tubes where characterized by means of powder X-ray diffraction (XRD, Bruker Phaser D2) and Scanning Electron Microscopy (SEM) coupled with Energy-Dispersive X-ray Spectroscopy (EDS) (JSM-6010LA, JEOL system). X-ray photoelectron spectroscopy (XPS) spectra were recorded on a Quantera SXM (scanning XPS microprobe) spectrometer from Physical Electronics, in which X-rays were generated from an Al Kα source, emitting at 1486.6 eV. For sputtering conditions, please see the ESI.† Thermogravimetric analysis (TGA) was performed on a STA 449 F3 Jupiter, Netzsch, TGA-system, using a 5 °C min−1 heating rate, unless otherwise indicated. TGA-MS was performed by combining the aforementioned TGA-system with a mass spectrometer (1 to 100 m/z, QMS 403 D Aëolos, Netzsch). The furnace exhaust was monitored using a mass-spectrometer (1 to 100 m/z, OMNISTAR, THERMOSTAR, GSD 320 Gas Analysis System, Pfeifer vacuum). Porosity was calculated from the measured apparent density of samples with known volume and weight. The pore size distribution was measured by capillary flow porometry based on the liquid extrusion technique, using a Porolux 500 Porometer. The bending strength was determined using the four-point method with a 20 mm span size, on the mechanical strength testing system INSTRON 5942. The resistivity was determined by a four-probe method using a BioLogic potentiostat. Current was initiated between the two outer probes across 88.5 mm and the voltage was measured between the two inner probes across 72.5 mm of the tube. For the porosity, conductivity and pore size distribution, the average of 10 samples will be reported. For the bending strength every specimen in a sample group of ten had three segments tested, making a total of 30 points for any sample type.Results and discussion
Analysis of the composition and morphology
Photographs of the prepared samples are presented in Fig. 2. The oxidation step at low temperature yields sample (A), which appears blue. The blue colour indicates the presence of a mixed valence state (III, IV) in Ti-oxide, while residual carbon is likely also present, as will be discussed shortly. The Ti and Ti-s samples (B and C) show a shiny grey colour, which is expected for metallic Ti tubes. The Ti/TiC and Ti/TiC-s samples (D and E) are observed to be darker grey, indicating the presence of TiC. The Ti/TiN and Ti/TiN-s samples (F and G) have a distinct yellow colour, resulting from the formed TiN after nitridation. A higher temperature treatment of 1100 °C was applied using the Mo-substrate, which did not result in Mo contamination or adhesion to the substrate. After treatment at 1100 °C the samples appear slightly paler than shown in Fig. 2.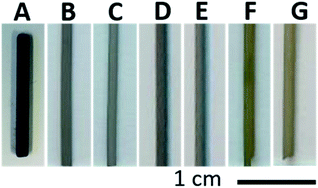 | ||
| Fig. 2 Photographs of (A) Ti/TiOx/C, (B) Ti, (C) Ti-s, (D) Ti/TiC, (E) Ti/TiC-s, (F) Ti/TiN, (G) Ti/TiN-s. | ||
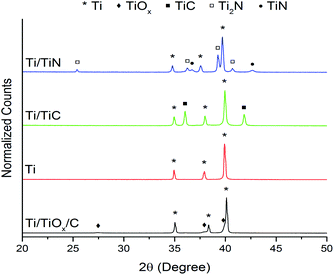
The XRD results for samples Ti/TiOx/C, Ti, Ti/TiC and Ti/TiN, are shown in Fig. 3 (bottom to top, respectively). The XRD-pattern for Ti/TiOx/C, i.e. the intermediate composition formed after calcination (in air) at 475 °C (the Ti-1 step indicated in Fig. 1), confirms that an oxidized form of Ti is present. The (crystalline) oxide layer is likely covering a metallic Ti-core, as can be judged from the very clear Ti signal in the XRD patterns. After the next treatment step (Ti-2), a pure metallic Ti phase is observed (Fig. 3). The absence of crystalline TiOx species after the treatment in Ar, suggests a polymer associated carbon residue is present in sample A (Fig. 2), which induces reduction of TiOx during the Ar-treatment at 800 °C. More important is that crystalline TiC is not formed during this step, indicating that the polymer was effectively converted into CO2, as will be further discussed on the basis of MS data (Fig. 8). The other two XRD patterns (Ti/TiC and Ti/TiN) presented in Fig. 3, show that after the treatments TiC-1 and TiN-1 (Fig. 1), TiC and TiN are indeed formed.
In samples Ti/TiC and Ti/TiN a Ti core remains, as is evident from the diffraction patterns. Furthermore it is observed that for the TiN samples, a mix of TiN and Ti2N phases is present. This is the result of the relatively low temperature used for nitridation.18–20 XRD results for the sintered samples Ti-s, Ti/TiC-s and Ti/TiN-s are provided in the ESI (Fig. S1†).
It should be mentioned that carbon residues, before and after sintering, have not, and cannot be observed in the X-ray diffraction patterns. The temperatures of the TiC-1 and Ti-2 processes (see Table 1 and Fig. 1) are relatively low for crystallization of carbon to occur. Carbon can be expected to be amorphous (which does not give a diffraction signal) or possibly nanocrystalline. In the latter case the signal would be very weak. Furthermore, we have considered the formation of TiCxO(1−x) (oxycarbide phases). The diffractograms (Fig. 3 and S1†) are unfortunately of insufficient quality to find any clear differences and deviations of TiC-line positions in the Ti/TiC and Ti/TiC-s samples, respectively, expected when an oxycarbide phase would be present. XRD identification of TiCxO(1−x) requires high-end diffraction patterns and analysis of lattice parameters, which is unfortunately not possible on the basis of Fig. 3 and S1.†
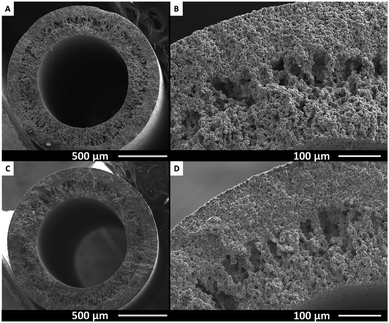
In Fig. 4, SEM pictures of the cross section and wall of Ti (top) and Ti-s (bottom) are shown. The porous structure of the metallic tubes originates from the dry-wet spinning process. By varying spinning conditions e.g. bore liquid flow, applied pressure, spinning mixture or coagulation bath composition, the morphology can be varied. The spinning conditions used here, result in a structure that consists of macro voids starting from the inside, towards a more dense sponge like structure on the outside of the sample. The clear boundary between these two types of structures can be seen at approximately the middle of the tube wall in both Ti and Ti-s samples. The overall structure of the porous tubes is thus retained after treatment at 1100 °C. Similar wall structures are found for the Ti/TiC, Ti/TiC-s, Ti/TiN and Ti/TiN-s samples (see Fig. S2 and S3†).
Although the macro structure appears similar after treatment at 1100 °C, an increased degree of particle sintering is observed using a higher magnification, as is displayed in Fig. 5. Comparing panel A with B for example shows that the Ti particles are more intimately connected in panel B, after treatment at 1100 °C. For comparison, in panel A the spheres are connected to less extent, as indicated by the breaking points. However in panel B these breaking points constitute the particles themselves and a larger contact area between particles can be seen. The SEM picture of the Ti/TiC sample (Fig. 5C) shows that the particles are connected in different ways from those in the Ti-type samples. The surface after breaking is significantly rougher, suggesting a multiple phase contact between the particles. This is likely due to the layer of TiC around the Ti particles, which is higher in hardness compared to Ti metal. Increased connectivity of the particles due to sintering is also visible for Ti/TiC (compare panels C and D of Fig. 5). The result appears less pronounced however, when compared to the Ti samples (compare panels B and D). A probable cause is the almost twice as high melting point for TiC compared to Ti. The Ti/TiN and Ti/TiN-s materials (compare Fig. 5E and F) show a result quite similar to Ti and Ti-s. This is not surprising since the titanium nitride-containing fibres were prepared via modification of the previously synthesized Ti and Ti-s structures, and the connection between particles was thus already established prior to the nitridation step.
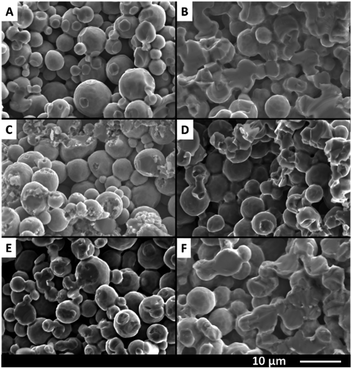 | ||
| Fig. 5 Cross-sectional SEM images of (A) Ti, (B) Ti-s, (C) Ti/TiC, (D) Ti/TiC-s, (E) Ti/TiN and (F) Ti/TiN-s indicating the degree of sintering. | ||
While EDS spectroscopy should be treated with care for quantitative analysis of light elements (Z < 11) such as O, N and C, an indication of the elemental composition of the porous tubes, determined by EDS, is presented in Table 2. In general, the EDS data confirm the suggested composition for all types of the porous tubes, as it was reasoned from the XRD data and the processing steps. Amorphous, adventitious carbon naturally shows up for all samples. However, notably more carbon is found for the Ti/TiOx/C and Ti/TiC samples.
| Element (%) | Ti/TiOx/C | Ti | Ti-s | Ti/TiC | Ti/TiC-s | Ti/TiN | Ti/TiN-s |
|---|---|---|---|---|---|---|---|
| Ti | 63.8 | 93.5 | 93 | 75.4 | 73 | 74.1 | 74.5 |
| C | 11.6 | 6.5 | 7 | 23.6 | 25.8 | 4 | 6 |
| S | — | — | — | 1 | 1.2 | — | — |
| N | — | — | — | — | — | 21.9 | 19.5 |
| O | 24.6 | — | — | — | — | — | — |
The EDS result for Ti/TiOx/C indicates that a significant amount of oxygen is also present, which confirms the presence of TiOx after treatment Ti-1. Moreover, the C-content of 11,6% suggests that some organic residue from the polymer might still be present in the sample and this is supported by the TGA and MS analyses. After step Ti-2, the Ti sample is obtained. Oxygen could no longer be detected by EDS in this sample, thus the heat treatment in Ar appears to have reduced the previously present TiOx by reaction with the C-residue to a large extent. This is supported by the absence of a TiC peak in the XRD pattern of the Ti sample (Fig. 2). The Ti/TiC sample contains a significantly higher amount of C and no oxygen. The presence of sulphur suggests that the source of this carbon is the pyrolyzed polymer.
XPS spectra of Ti, Ti/TiC, and Ti/TiN, before and after sintering, respectively, are shown in Fig. 6. The main observation is the presence of a significant TiO2 signal in all samples, which can be assigned to the presence of a native oxide layer formed by oxidation in ambient conditions. In agreement with an increased oxidation resistance in the order of Ti < TiC < TiN, the relative contribution of the (native) TiO2 peak decreases in the series Ti, Ti/TiC, and Ti/TiN. The XPS spectra before and after the sintering treatment are quite similar. The spectra of Ti, Ti/TiC, and Ti/TiN show interesting differences in the range of 452–458 eV, where surface TiC can be identified at 454.5 eV. The C 1s spectra (see Fig. S4†) confirm the presence of TiC, which is difficult to quantify due to the overwhelming presence of adventitious carbon. TiN can be identified by the overall spectral signature containing multiple peaks, including the broad feature between 455 and 457 eV. It should be mentioned that depth profiling has been attempted for various samples, using sputtering to a depth of ∼10 nm (see Fig. S5 and S6†). In all cases the oxide contribution decreased (by removal of the native oxide layer), while nitride and carbide were observed after sputtering. The quantification was largely affected by the formation of TiC by the sputtering induced reaction of Ti with adventitious carbon, leading to TiC signals in the Ti/TiN samples, and over-estimation of the quantity of TiC in the Ti/TiC samples. Please find a more detailed interpretation of the spectra, including literature, in the ESI.†
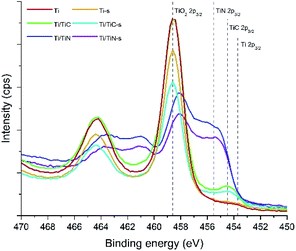 | ||
| Fig. 6 XPS spectra in the Ti 2p region for the Ti, Ti-s, Ti/TiC, Ti/TiC-s, Ti/TiN, and Ti/TiN-s composites. | ||
Formation mechanism of the variable Ti surface compositions
In order to clarify the chemistry during thermal treatments that led to Ti and TiC, several TGA/MS measurements were performed of which the TGA results are presented in Fig. 6. TiN formation from Ti and N2 by thermal treatment is a method often reported in literature and will not be discussed in detail.18–20 In order to obtain metallic Ti porous tube electrodes from dry-wet spinning, the polymer needs to be removed. PES has a distinct two-step decomposition in air; the oxygen bonds (ether and sulfone groups) are released below 600 °C, whereas the decomposition of the aromatic ring structures is only achieved at temperatures above 600 °C.16 This oxidation behaviour in air, and the decomposition in Ar are shown in Fig. 6A. As can be seen, the first oxidation regime is largely auto-oxidative, since the same trend can be observed under an inert atmosphere.17 Complete removal of PES can thus be achieved by thermal oxidation in air above 600 °C, but not in Ar. However, titanium is a material which readily oxidizes in conditions which are suitable for complete PES removal. Thus thermal processing of Ti + PES has to be done with great care.By keeping a relatively low temperature of only 475 °C it is possible to remove most of the ether and sulfone groups from the polymer, while slightly oxidizing Ti into semi-stable TiOx. Fig. 6B shows the TGA of Ti + PES in an air atmosphere. The mass loss at the beginning of the measurement is attributed to the removal of water and NMP. Ti oxidation causes the slight increase in mass, prior to a decay in weight-loss related to the oxidation of PES. The weight loss due to PES oxidation in the sample is compensated by the growth of an oxide layer. A self-limiting growth of the TiOx layer is clear from the TGA measurement as the curve can be seen to flatten near the end of the treatment. This layer can be considered a sub-stoichiometric oxide of Ti, which means that a stable TiO2 layer is not formed. Therefore this layer may be used to oxidize remaining carbon species under the right conditions in the next step of the thermal treatment sequence. Mass-spectrometry data from the TGA measurements further clarify that the thermal decomposition of PES under an Ar or air atmosphere (see Fig. S7 and S8†) is in line with reports in literature.
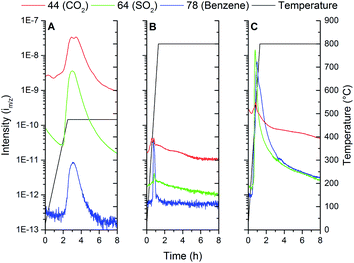
MS-analysis of the furnace exhaust (Fig. 7) during thermal treatment of the samples allows further insight into the chemical processes that occur during the PES decomposition and Ti oxidation. Three cases are presented in Fig. 7. The three major decomposition products are tracked over time, being m/z 44, 64 and 78. These m/z values, given weight by their respective signal intensities on the left y-axis, can be attributed to the compounds CO2, SO2 and benzene respectively (with consideration of the fragmentation peaks). The temperature of the furnace is shown on the right y-axis and follows the black line. Fig. 7A shows what occurs during low temperature oxidation under an air atmosphere at 475 °C (Ti-1). From this data it is observed that mostly oxidized decomposition products, such as CO2 and SO2, are released, which is in agreement with PES decomposition measured by TGA in air. The benzene-type fragment is apparently remaining as a decomposition product of PES. From this MS result and TGA data it can be judged that initial oxidation of PES has been completed after treatment step Ti-1.
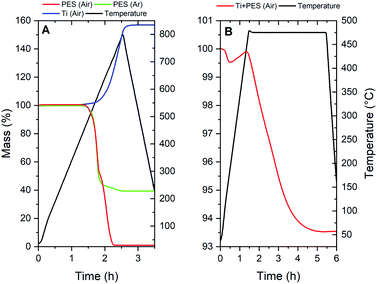 | ||
| Fig. 7 TGA of (A) PES in air and Ar atmospheres and Ti powder in an air atmosphere; (B) Ti + PES (Ti-1). | ||
In Fig. 7B the next step in the thermal treatment in an Ar atmosphere (Ti-2) is shown. The maximum temperature of 800 °C is chosen to facilitate at least a minimum level of particle sintering, while preventing reaction of Ti with the substrate. During the heating stage, relatively small signals for both CO2 and SO2 are observed, while a more significant change is observed for the benzene-type fragment. The formation of CO2 and SO2 is attributed to reaction of the sub-stoichiometric Ti-oxide formed at 475 °C with residuals of the decomposed PES. The elegance of this two-step PES removal is that it allows for the formation of metallic Ti fibres without significant quantities of Ti-oxide or TiC. However, the intensity line m/z of the CO2 mass does not reach zero under test conditions, which may suggest an additional source of CO2. TiCxO(1−x) oxidation might occur, and there might thus be a basis for the presence of TiCxO(1−x), then likely formed under the conditions of the manufacturing process of the fibres.
Fig. 7C displays the MS-data gathered form the furnace exhaust when the oxidation process (Ti-1) was omitted, and the green fibres were heated to 800 °C in Ar (TiC-1). CO2 and SO2 are still formed due to auto oxidation. A significant increase in the signal for benzene-compounds is now observed due to thermal decomposition of PES. The auto oxidation of the sulfone and ether bonds appears to drive the polymer break-up, since the CO2 and SO2 signal maximum appears before the one attributed to benzene-compounds. The carbon residues which remain from decomposing the PES eventually lead to the formation of TiC at higher temperatures.
Physical properties of the fibres
Certain characteristic properties for the obtained porous tube electrodes are reported in Table 3. The data sets obtained for the measurements of the resistivity, pore diameter, and bending strength can be found in the ESI (Fig. S9, Fig. S10 and Fig. S11,† respectively). Although numerous approximations exist for the expression of conductivity in porous materials,21–23 it was found that these equations are not readily applicable to the pore systems which are obtained for the hollow fibres, since it is not possible for the shape parameter to be expressed or approximated with the data available.24 Therefore the measured resistivity is presented and no adjustments have been made for porosity.| Sample | OD (mm) | Wall (mm) | Porosity (%) | Max pore size (μm) | MFP size (μm) | Min pore size (μm) | Bending strength (MPa) | Resistivity (μΩ m) |
|---|---|---|---|---|---|---|---|---|
| Ti | 1.70 [0.04] | 0.50 [0.02] | 59 [2] | 2.92 [0.05] | 1.62 [0.02] | 1.30 [0.06] | 63 [5] | 9.58 [0.70] |
| Ti/TiC | 1.71 [0.02] | 0.49 [0.04] | 58 [2] | 2.64 [0.03] | 1.57 [0.02] | 1.23 [0.04] | 126 [4] | 5.72 [0.30] |
| Ti/TiN | 1.74 [0.04] | 0.49 [0.02] | 61 [2] | 2.98 [0.08] | 1.63 [0.03] | 1.35 [0.08] | 51 [3] | 5.50 [0.22] |
| Ti-s | 1.58 [0.07] | 0.44 [0.03] | 49 [5] | 2.34 [0.08] | 1.28 [0.06] | 0.96 [0.06] | 131 [6] | 5.38 [0.58] |
| Ti/TiC-s | 1.67 [0.04] | 0.43 [0.03] | 53 [4] | 2.56 [0.04] | 1.34 [0.04] | 1.00 [0.03] | 195 [7] | 4.73 [0.47] |
| Ti/TiN-s | 1.62 [0.03] | 0.48 [0.03] | 55 [2] | 2.35 [0.05] | 1.32 [0.04] | 1.05 [0.04] | 102 [5] | 4.12 [0.29] |
The data set presented in Table 3 most importantly shows a limited influence of sintering (800 °C vs. 1100 °C) on the structural parameters. When sintering the Ti based materials at 1100 °C the reversible phase transition from Ti-α to Ti-β (around 890 °C) occurs, resulting in the known densification of the material due to the increased sintering rate.9 Consequently, after sintering at 1100 °C a slight decrease in the outer diameter (OD), wall thickness and pore size of the fibres can be noted. Furthermore, sintering leads to a relatively equal decrease in pore size for the Ti and Ti/TiN fibres, which shows that nitrogen incorporation has a minimal effect on the general geometry of the samples. The Ti/TiC samples appear to behave differently; prior to sintering the pore size is notably smaller and after the sintering treatment the decrease in pore size is less significant than for the Ti and Ti/TiN samples (as can be observed in Fig. S10†). That the initial pore size of the Ti/TiC samples is smaller may indicate the presence of a rather thick TiC shell, which would increase the average particle size. The notably higher mechanical strength of these Ti/TiC samples further supports the idea of larger inter-particle contacts. The sintering temperature for TiC is about a 1000 °C higher as compared to titanium, explaining the less significant change in pore size due to treatment at 1100 °C. However, Ti–Ti inter-particle contacts should still be present in the Ti/TiC samples, as will be discussed shortly on the basis of resistivity results. It are these Ti–Ti inter-particle contacts within the Ti/TiC composite that benefit from the sintering treatment at 1100 °C.
Bending strength measurements also indicate that sintering improves the contact between particles. In particular in the case for Ti and Ti/TiN type samples, the bending strength has doubled after sintering at 1100 °C. The Ti/TiC samples have the highest bending strength of all fibres, however the increase in bending strength resulting from additional sintering is less prominent here, due to the higher melting point of TiC. TiC is known to have superior hardness to Ti and thus a value double the bending strength of the Ti sample prior to sintering is explained. The relatively smaller increase in bending strength after sintering, suggests the inter-particle contacts are predominantly of a Ti–Ti nature. Incorporation of nitrogen should also have resulted in enhanced bending strength, given the properties of TiN in comparison to Ti. Interestingly, it had the opposite effect and appears to have weakened the structure. We suggest this is related to the limited penetration of nitrogen into the individual Ti particles, due to the relatively mild conditions used in the TiN preparation step.19,20 The presence of two TiN phases (TiN and Ti2N) further implies a disruptive boundary is present, resulting in a rather brittle shell around the Ti core. The bending strength of the Ti/TiN composite can be improved through optimization of the nitridation procedure by increasing the temperature and time of the treatment. This is however beyond of the scope of the current study, since the Ti/TiN composite is primarily used to explain the lowered resistivity.
The most striking result of Table 3 is in the observed resistivity values. The resistivity values found in literature are; Ti: 0.42 μΩ m, TiC: 8 × 10³ μΩ m and TiN: 1.3 × 10¹² μΩ m,25 while those reported in Table 3 for the TiC and TiN containing composites are all within the range of 4–10 μΩ m. This suggests that in all cases electrical conduction is predominantly established through Ti–Ti contacts, thus metallic Ti dominates the electrical conductivity. As previously mentioned, for the TiN samples the Ti–Ti contacts are established in the sintering procedure before conversion to TiN. For the TiC containing samples the low resistivity suggests that the processes occurring during step TiC-1 includes the formation of Ti–Ti contacts, followed by conversion of the outer Ti layer to TiC. If the interparticle contacts would be composed of TiN or TiC with high intrinsic resistivity, the apparent resistivity should increase. On the contrary, the presence of TiC or TiN, likely in an outer, but crystalline shell (based on XRD and XPS data), results in significantly lower resistivity, which can be attributed to the insulating layer of TiC or TiN preventing capacitive effects at the Ti/air interface.26 The densification of the materials after the sintering treatment results in an expected lower resistivity, when compared to the Ti, Ti/TiN or Ti/TiC samples prior to sintering. This is likely due to increasingly favourable capacitive effects.
When comparing the resistivity data reported in Table 3 to the Ti-based porous tubes reported in literature,4 it appears that there is a significant difference. A resistivity value of approximately 33 × 103 μΩ m was recalculated from the available data, compared to about 5 μΩ m found in this work. It is reasoned that the difference originates from the preparation procedure. The method reported in literature uses 600 °C in air for oxidation of the polymer from the as-spun fibre. According to the TGA data presented in Fig. 6A, at this temperature significant oxidation of titanium occurs. Therefore, high quantities of TiO2 can be expected in such material, which would significantly increase the resistivity of the porous tube. In this work, by choosing 475 °C for polymer oxidation, formation of titanium dioxide can be significantly prevented, in particular when oxidation is followed by the treatment in Ar at 800 °C, resulting in a much lower resistivity.
Conclusions
We have developed a systematic approach for the production of Ti hollow fibres of variable composition. In order to obtain a purely metallic Ti porous electrode after dry-wet spinning using PES and NMP, decomposition of PES in the presence of oxygen should be performed at mild temperatures (475 °C). This treatment is to be followed up by a higher temperature treatment in Ar (800 °C) to decompose the oxide, concurrently removing residual PES fragments. If formation of Ti/TiC is desired, treatment in Ar at 800 °C suffices, without the prior oxidation step. Ti-fibres can be converted to Ti/TiN at 800 °C in a nitrogen atmosphere. Generally, the produced fibres show high bending strength and remarkably low electrical resistance, which is further improved by sintering at 1100 °C. These properties makes them suitable for various applications in the field of electrochemistry. We currently evaluate the potential of these hollow fibres in the electrochemical reduction of carbon-dioxide, nitrogen and oxidation of alkenes.Conflicts of interest
There are no conflicts to declare.Acknowledgements
This work took place within the framework of the Institute of Sustainable Process Technology, co-funded with subsidy from the Topsector Energy by the Ministry of Economic Affairs and Climate Policy, The Netherlands. R. P. H. Jong acknowledges financial support from the NWO financed Graduate Research Program on Solar Fuels.References
- M. W. J. Luiten-Olieman, L. Winnubst, A. Nijmeijer, M. Wessling and N. E. Benes, J. Membr. Sci., 2011, 370, 124–130 CrossRef CAS.
- M. W. J. Luiten-Olieman, M. J. T. Raaijmakers, L. Winnubst, T. C. Bor, M. Wessling, A. Nijmeijer and N. E. Benes, J. Membr. Sci., 2012, 407–408, 155–163 CrossRef CAS.
- R. Kas, K. K. Hummadi, R. Kortlever, P. De Wit, A. Milbrat, M. W. J. Luiten-Olieman, N. E. Benes, M. T. M. Koper and G. Mul, Nat. Commun., 2016, 7, 1–7 Search PubMed.
- O. David, Y. Gendel and M. Wessling, J. Membr. Sci., 2014, 461, 139–145 CrossRef CAS.
- I. Merino-Garcia, J. Albo, P. Krzywda, G. Mul and A. Irabien, Catal. Today, 2020, 346, 34–39 CrossRef CAS.
- D. Bell, D. Rall, M. Großeheide, L. Marx, L. Hülsdünker and M. Wessling, Electrochem. Commun., 2020, 111, 106645 CrossRef CAS.
- Trends in Electrochemistry Research, ed. M. Nunez, Nova Science Publishers, Inc., New York, 2007 Search PubMed.
- CRC Handbook of Chemistry and Physics, ed. D. R. Lide, Internet Version 2005, CRC Press, Boca Raton, FL, 2005 Search PubMed.
- M. Qian, G. B. Schaffer and C. J. Bettles, in Sintering of Advanced Materials - Fundamentals and Processes, 2010, pp. 324–355 Search PubMed.
- E. Tal-Gutelmacher and D. Eliezer, J. Miner. Met. Mater. Soc., 2005, 57, 46–49 CrossRef CAS.
- T. Smith, Surf. Sci., 1973, 38, 292–312 CrossRef CAS.
- W. D. Sylwestrowicz, J. Electrochem. Soc., 1975, 122, 1504–1508 CrossRef CAS.
- I. Vaquila, L. I. Vergara, M. C. G. Passeggi, R. A. Vidal and J. Ferrón, Surf. Coat. Technol., 1999, 122, 67–71 CrossRef CAS.
- Y. Mizuno, F. K. King, Y. Yamauchi, T. Homma, A. Tanaka, Y. Takakuwa and T. Momose, J. Vac. Sci. Technol., A, 2002, 20, 1716–1721 CrossRef CAS.
- E. Gemelli and N. H. A. Camargo, Matéria, 2007, 12, 525–531 Search PubMed.
- X. G. Li, H. T. Shao, H. Bai, M. R. Huang and W. Zhang, J. Appl. Polym. Sci., 2003, 90, 3631–3637 CrossRef CAS.
- P. Tranchard, S. Duquesne, F. Samyn, B. Estèbe and S. Bourbigot, J. Anal. Appl. Pyrolysis, 2017, 126, 14–21 CrossRef CAS.
- H. Rode and V. Hlavacek, Combust. Sci. Technol., 1994, 99, 161–177 CrossRef CAS.
- H. Rode and V. Hlavacek, AIChE J., 1995, 41, 377–388 CrossRef CAS.
- C. Li, X. Lv, J. Chen, X. Liu and C. Bai, Int. J. Refract. Met. Hard Mater., 2015, 52, 165–170 CrossRef CAS.
- T. Mori and K. Tanaka, Acta Metall., 1973, 21, 571–574 CrossRef.
- I. Sevostianov and V. Kushch, Int. J. Solids Struct., 2009, 46, 4419–4429 CrossRef.
- B. Q. Li and X. Lu, Transp. Porous Media, 2011, 87, 179–189 CrossRef CAS.
- I. Sevostianov, J. Kováčik and F. Simančík, J. Mater. Sci. Eng. A, 2006, 420, 87–99 CrossRef.
- J. F. Shackelford and W. Alexander, CRC Materials Science and Engineering Handbook, CRC Press LLC, Boca Raton, 3rd edn, 2001 Search PubMed.
- R. J. D. Tilley, Understanding Solids: The Science of Materials, John Wiley & Sons Ltd., United Kingdom, 2nd edn, 2013 Search PubMed.
Footnote |
| † Electronic supplementary information (ESI) available. See DOI: 10.1039/d0ra04905k |
| This journal is © The Royal Society of Chemistry 2020 |

