 Open Access Article
Mechanistic pathways for the degradation of SMX drug and floatation of degraded products using F–Pt co-doped TiO2 photocatalysts
Majid Jahdi *a,
Shivani B. Mishra
 *a,
Edward N. Nxumaloa,
Sabelo D. Mhlangab and
Ajay K. Mishraa
aNanotechnology and Water Sustainability Research Unit, College of Science, Engineering and Technology, University of South Africa, Johannesburg, Florida 1709, South Africa. E-mail: bhards@unisa.ac.za; majid.jahdi@gmail.com; Tel: +2711 670 9199
bDST/Mintek Nanotechnology Innovation Centre, Council for Mineral Technology (MINTEK), Private Bag X3015 Randburg, 2125, South Africa
First published on 24th July 2020
Abstract
This work presents smart pathways to enhance the photocatalytic activity of TiO2 via co-doping with fluorine (F) and platinum (Pt) to form F–Pt co-doped TiO2 photocatalysts and investigates the unique and unusual fluorination of the floated products. Our investigations indicate that the crystalline structure of the photocatalysts was a mixture of anatase and brookite phases and that the nanoparticles of the synthesized nanocomposites had nanometric sizes (4–25 nm). The F–Pt co-doped TiO2 nano-photocatalysts demonstrated degradation of sulfamethoxazole (SMX) drug of >93% within 90 min under direct solar light and 58% degradation within 360 min under a solar simulator. Thus, co-doping TiO2 with F and Pt atoms to form F–Pt co-doped TiO2 nanocomposite is an efficient pathway to achieve high photocatalytic performance escorted with the formation of floating metal-fluoropolymer, unlike pristine TiO2 which has less photocatalytic degradation and no generation of a floating polymer. Our photocatalytic protocol demonstrates that the degradation of SMX started with redox reactions of oxygen and water absorbed on the surface of the prepared nanocomposites to form superoxide anions (O2˙−) and hydroxy radicals (˙OH) which have oxidation superpower. The resultant products were subsequently fluorinated by fluoride radical ions and floated as metal-fluoropolymer.
1. Introduction
Many pharmaceutical industries and hospitals have been found to discharge pharmaceutical wastes directly into the environment. The presence of pharmaceutical compounds in the aquatic environment and their possible effects on living organisms have emerged as a serious environmental concern.1 Pharmaceuticals are designed to have a physiological response in humans, plants, and animals and they pose significant risks to the aquatic life due to their natural lipophilic tendency to accumulate in the ecosystem, which might lead to the development of antibiotic-resistant microbial strains.2 Sulfamethoxazole (SMX) belongs to the sulfonamide group and is a representative antibiotic extensively used in both human and veterinary medicine, and thus frequently detected in water resources.3 Moreover, SMX might have toxic effects on aquatic organisms because of its antibiotic-resistant nature once released into the aquatic systems, thus it needs to be effectively degraded and/or removed from water resources.4The photocatalytic pathway remains one of the most promising environmental cleaning routes to overcome the problem of water contamination by pharmaceuticals. Titanium dioxide (TiO2) is known as a key nanotechnology photocatalyst due to its unique properties. However, because of its wide band gap (∼3.2 eV), TiO2 has a poor photocatalytic activity toward diverse water pollutants.5 By employing TiO2, only a small portion (less than 5%) of sunlight can be exploited for photocatalytic processes; thus, the photocatalytic response is not enough to initiate chemical reactions that may be efficient for the degradation of pollutants in water.6 The band gap of TiO2 does not only strictly depend on its crystalline phase but is also strongly controlled by the morphology of TiO2 and the presence of anionic and/or cationic impurities in the lattice.7 The incorporation of noble metals such as Au, Ag, Pd, and Pt into semiconductor nanomaterials has been investigated to induce the response of TiO2 to the visible light as well as enhance the separation of electron–hole pairs, thereby improving the photocatalytic efficiency.8,9 The modification of TiO2 matrix with metal ions as dopants has significant a marked influence on the charge carrier (e−/h+) recombination and interfacial electron-transfer rates.10
Platinum has so far been recognized as an important catalyst for electrochemical applications such as hydrogen production.11 It is one of the noble metal used to modify and enforce the photocatalytic activity of TiO2.12 Xiong Xu (2016) have studied the synergetic effect of Pt and B on the photocatalytic performance of TiO2 and their impacts on the photocatalytic degradation of phenolic compounds in water.13 The local structure of Pt species in TiO2 nanocrystal and its effect on the photocatalytic reactivity were investigated with various analytical methods.14 The morphology, pH, particle size, dispersion, and oxidation state of Pt nanoparticles are the main parameters that improve and enhance the photocatalytic activity of TiO2 and thereby extend its adsorption range to the visible light. The latter parameters have been controlled by a simplistic Pt-doping TiO2 method.15
Doping TiO2 with a single element (metal or non-metal) does not lead to an efficient shift of the photocatalytic activity to the visible region because one dopant alone might add a single energy level to TiO2 band gap, either above the valence band (VB) or below the conduction band (CB) and produces a small redshift caused by low absorption of the visible light.7 Besides that, these energy levels can trap only one type of charge carrier, i.e. either electrons or holes.16 On the other hand, co-doping TiO2 with two different dopants, mainly the combination of metal and non-metal, produces synergic effects to enhance the visible light absorption efficiency and reduce the recombination processes of the photocatalytic generated charges.16,17 The fluoride ion (F−), with its high electronegativity and other properties has attracted great interest as an anatase-brookite TiO2 control agent.6 It was reported that F− ions could influence the photocatalytic reactions by occupying the substituted oxygen sites and then create active sites, oxygen vacancies or Ti3+ ions.18 Czoska et al. reported that the incorporation of F− ions in TiO2 matrix lead to the formation of Ti3+ reduced centers due to the charge compensation between Ti4+ and F−, which localize one electron in the t2g orbitals of the metal without generating oxygen vacancies.19 The presence of F− as dopant or as a morphology controlling agent play a significant role on the growth of anatase phase.20 Moreover, the introduction of F− into TiO2 lattice enhances the absorptivity of molecules, increases the temperature of anatase-to-rutile phase transformation, and also enhances the surface acidity of TiO2.21,22
In this present study, a rapid one-step microwave-assisted hydrothermal synthesis method was used to synthesize the F–Pt co-doped TiO2 nanocomposites in order to achieve similar properties of the conventional hydrothermal method within a short time; thus, get an efficient photocatalyst at an effective cost. The purpose of this work was to investigate the synergistic effects of Pt and F on the photocatalytic performance of TiO2 photocatalysts. Hence, we investigate TiO2, F-doped TiO2, and F–Pt co-doped TiO2 nanocomposites for the degradation of SMX drug using a solar simulator and direct solar light as light energy source and expose the mechanistic models responsible for the photocatalytic processes involved. The advantage of co-doping TiO2 with Pt and F resides on the enhancement of the photocatalytic activity of TiO2 based nanocomposites and the generation of an unusual floating polymer on the treated water.
2. Experimental
2.1 Materials and reagents
Titanium butoxide purum, ≥97.0% (gravimetric) with density of 1 g mL−1 was used as TiO2 source. Chloroplatinic acid hexahydrate bioxtra and trifluoroacetic acid were (ReagentPlus® with 99% purity) were used as platinum and fluorine sources, respectively. Sulfamethoxazole (C10H11N3O3S), a pharmaceutical secondary standard, was used to investigate the photocatalytic performance of prepared nanocomposites. Acrodisc syringe filters equipped with hydrophilic polypropylene (GHP membrane) and having pore size of 0.45 μm were used for filtering samples during the photocatalytic degradation process. 2-Butanol with purity ≥99.5% (Gravimetric) was used as a solvent.23 GHP membranes and all chemical reagents were commercial products supplied by Sigma Aldrich (South Africa) and used without any further treatment. Deionized water was prepared using a Direct-Q® (Millipore) Purification System in our laboratory (pH = 7.4 at 14.1 °C).2.2 Synthesis of doped TiO2
![[thin space (1/6-em)]](https://www.rsc.org/images/entities/char_2009.gif) 000 rpm min−1 for 1 h. The nanomaterials were then dried in an oven at 100 °C for 8 h, crushed in a mortar, and calcined in a muffle furnace at 400 °C for 4 h.
000 rpm min−1 for 1 h. The nanomaterials were then dried in an oven at 100 °C for 8 h, crushed in a mortar, and calcined in a muffle furnace at 400 °C for 4 h.2.3 Analysis of synthesized nanocomposites
The X-ray diffraction (XRD) patterns were obtained using the Rigaku SmartLab with high-resolution diffractometer. High resolution scanning electron microscopy (HR-SEM) images and energy dispersive spectroscopy (EDS) analysis were performed on a JEOL-7800F Field Emission Scanning Electron Microscope (FE-SEM) with a cathode-luminescence spectrometer. Prior to FE-SEM analysis, the samples were coated with carbon to increase their conductivity and prevent them from charging. The microstructure of the materials was studied using a JOEL JEM-2100 transmission electron microscope (TEM). By using the Perkin-Elmer Lambda 650 UV/VIS spectrophotometer over a wavelength range of 200 to 800 nm, ultraviolet and visible (UV-Vis) absorbance were measured. Band gaps were calculated using both Kubelka–Munk function and Tauc equation. Kubelka–Munk function F(R) is described in eqn (1):
 | (1) |
The Tauc equation for permitted indirect electronic transition is:
| (αhν)1/2 = A(hν − Eg) | (2) |
2.4 Energy positions of conduction and valence bands
The energy levels for the valence band (VB) potential EVB and conduction band (CB) potentials ECB of the semiconductors (TiO2 and TiO2 based nanocomposites) were calculated is using the following empirical equation:| EVB = χsemiconductor − Ee + 0.5Eg | (3) |
ECB, conduction band potential of TiO2, F–TiO2, FPt0.5–TiO2, FPt1–TiO2 and FPt3–TiO2 semiconductor can be calculated by:
| ECB = EVB − Eg | (4) |
The absolute electronegativity of TiO2 and TiO2 based nanocomposites were calculated using the following equation:
| χsemiconductor = [χ(A)aχ(B)bχ(C)c]1/(a+b+c) | (5) |
IA and EA are the ionization energy and electron affinity of each atom from the doped semiconductor, respectively.27
2.5 Photocatalytic degradation process of SMX
The photocatalytic degradation of SMX drug was monitored using a Lambda 650 UV/VIS spectrometer under UV-visible irradiation at various times including: −30, 0 (after 30 min in dark), 15, 30, 45, 60, 90, 120, 180, 240, and 360 min. Initially, the photocatalytic degradation of SMX was carried out in a 250 mL glass beaker containing 50 mL of SMX (20 mg L−1) and photocatalyst (50 mg), under the following conditions: photolysis of SMX with UV-visible light in the absence of F–Pt co-doped TiO2 nanocomposites, SMX solution with the synthesized photocatalyst in dark for 30 min under stirring to establish the adsorption–desorption phenomena (interaction between SMX drug and the surface of F–Pdx co-doped TiO2 nanocomposites), and then exposed the mixture of SMX drug and the photocatalyst to the light using solar simulator and direct sunlight radiations.SMX degradation percentage is calculated using the following equation:
It should be mentioned that there was no adjustment of potential for hydrogen (pH) during this study. However, pH of SMX in deionized water was around pH = 6.5 at T = 14 °C which been decreased to pH = 5.8 by adding undoped TiO2. Moreover, the pH of SMX mixed with TiO2 based nanocomposites (FPtx–TiO2) was, more acidic than with TiO2, varying between pH = 5.1 and 5.3 at T = 17 °C.
3. Result and discussion
3.1 X-ray diffraction (XRD)
The crystalline phase of the prepared TiO2, F-doped TiO2 and F–Ptx co-doped TiO2 nanocomposites with different proportions of Pt were evaluated by XRD (Fig. 1). The XRD patterns of all the synthesized nanocomposites exhibited diffraction peaks at 2θ = 25.32°, 37.87°, 48.05°, 54.03°, 55.01°, 62.75°, 68.91°, 70.20°, 75.14° and 82.80° corresponding to the (101), (103)/(004)/(112), (200), (105), (211), (204), (116), (220), (215) and (224) diffraction planes of anatase TiO2 (JCPDS, file no. 21-1272).29 The brookite phase was also found to be present in all the XRD patterns. The characteristic peak of brookite at 2θ = 30.77°, which is not superposed with any diffraction peaks of anatase phase and/or platinum provided evidence of the presence of brookite TiO2.30,31 However, it should be noted that there was no existence of rutile crystalline phase of TiO2.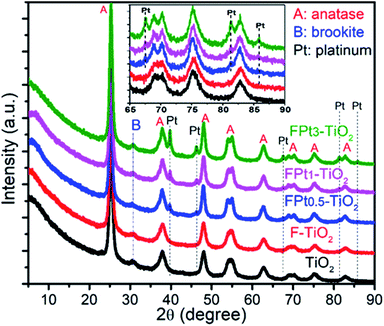 | ||
| Fig. 1 XRD patterns of TiO2, F–TiO2 and FPtx–TiO2 with different proportions of Pt; calcined at 400 °C in air. | ||
On the other hand, the peaks at around 2θ = 39.78°, 46.23°, 67.57°, 81.35°, 85.71° assigned to the (111), (200), (220), (311), and (222) diffraction planes respectively were present in all XRD patterns (except where there is no Pt present) of FPtx–TiO2 nanocomposites with different intensities according to the amount of Pt as dopant and are in good agreement with the literature.32,33 The diffraction planes of anatase phase located at 2θ = 54.03°, 55.01°, 68.91° and 70.20° reveal that the incorporation of Pt in TiO2 matrix increased the crystallinity of TiO2 as shown in the XRD patterns of FPtx–TiO2 nanocomposites compared to TiO2 and F–TiO2 nanomaterials.
3.2 High resolution scanning electron microscopy (HR-SEM)
The FE-SEM images and EDS elemental analysis of synthesized nanocomposites (i.e., TiO2, F–TiO2, and FPtx–TiO2) are shown in Fig. 2. The almost spherical shape of the nanocomposites was found to be uniform and similar in all synthesized nanocomposites. Moreover, the morphology of TiO2 based nanocomposites were kept unchanged after doping TiO2 and the diameters of the doped and co-doped TiO2 nanocomposites possessed almost the same average sizes as pure TiO2. The uniform morphology appears in all images is due to the unchanged cristalline phase of TiO2 after doping F− and co-doping with Pt. On the other hand, the elemental composition supplied by EDS analysis of (d) TiO2, (e) F–TiO2, and (f) FPtx–TiO2 are shown in Fig. 2; indicating high percentage of titanium (Ti) element compared to oxygen (O) element. This big difference generated huge defects in TiO2 lattice which increased its photocatalytic activity without any further modifications. The small percentage of F element in (e) and (f) samples might be because of the ionic radius of fluorine and/or its high electronegativity.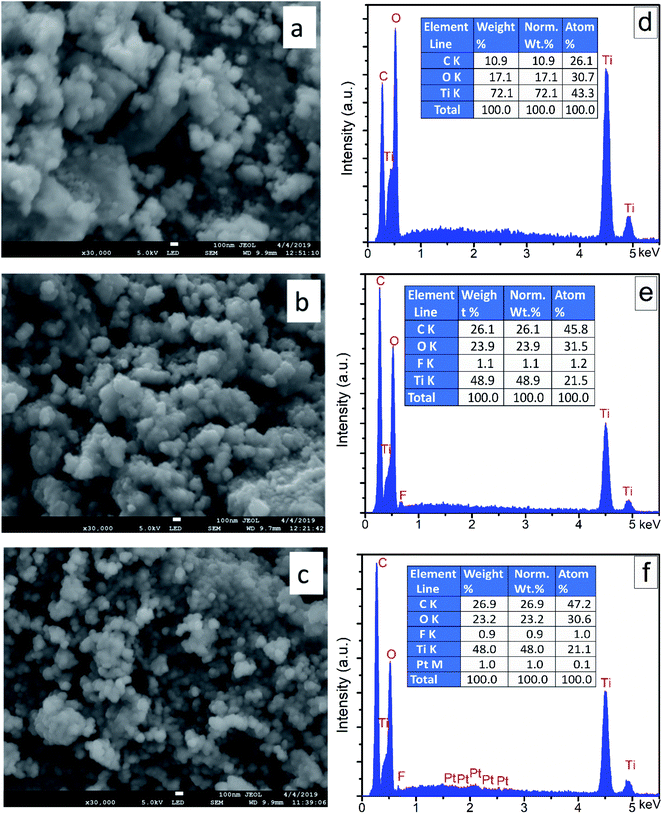 | ||
| Fig. 2 (a)–(c) are HR-SEM images; (d), (e), and (f) are EDS of TiO2, F–TiO2, and FPt1–TiO2 nanocomposites, respectively; calcined at 400 °C. | ||
3.3 Transmission electron microscopy (TEM)
The morphology and the internal nanostructure of (a) TiO2, (b) F–TiO2, and (c) FPt0.5–TiO2 synthesized nanocomposites were evaluated using TEM. Fig. 3 shows TEM and HRTEM images of (a) TiO2, (b) F–TiO2, and (c) FPt0.5–TiO2 prepared nanocomposites; calcined at 400 °C in air. The nanoparticles of (a) TiO2, and (b) F–TiO2 nanomaterials where a mixture of squares and compressed tetragonal shapes with an average diameter range of 10–20 nm as shown in Fig. 3(a) and (b). The HR-TEM images shows that the nanoparticle size of (b) F–TiO2 nanomaterials was reduced after incorporating fluoride ions (F−) in the TiO2 lattice. However, Fig. 3(c) shows a mixture of cubes and compressed tetragonal shapes integrated with dark dots attributed to Pt nanoparticles with an average size of 4–10 nm, forming heterojunction structures.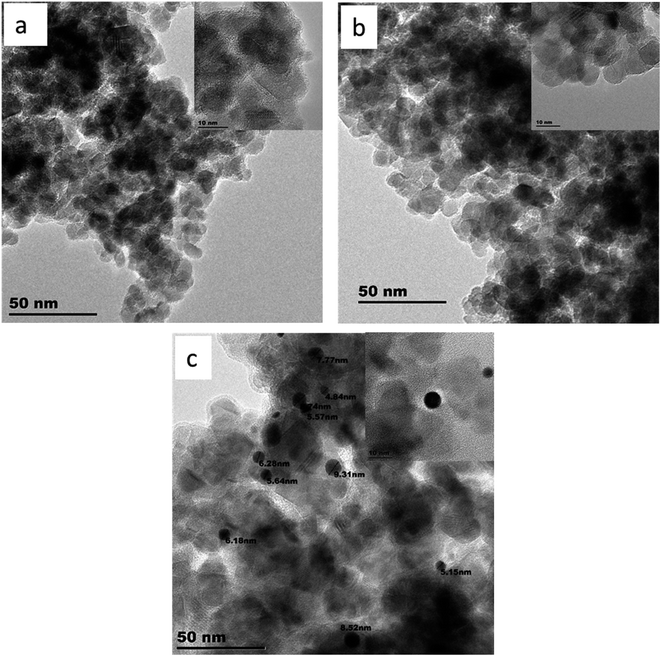 | ||
| Fig. 3 TEM and HR-TEM images of (a) TiO2, (b) F–TiO2, and (c) FPt0.5–TiO2 nanocomposites; calcined at 400 °C. | ||
3.4 UV-Vis absorption, band gap and potential energies positions of TiO2 based nanocomposite
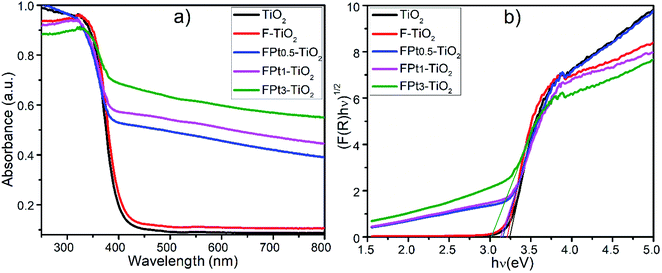
| Nanocomposite | Band gap (eV) | Valence band (eV) | Conduction band (eV) |
|---|---|---|---|
| TiO2 | 3.24 | 2.93 | −0.31 |
| F–TiO2 | 3.21 | 2.92 | −0.29 |
| FPt0.5–TiO2 | 3.16 | 2.89 | −0.27 |
| FPt1–TiO2 | 3.13 | 2.88 | −0.25 |
| FPt3–TiO2 | 3.02 | 2.82 | −0.2 |
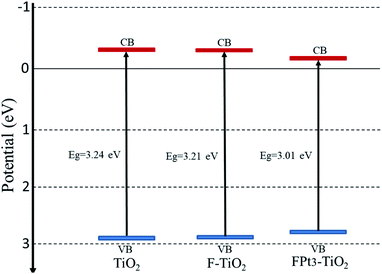 | ||
| Fig. 5 Conduction band (red line) and valence band (blue line) positions of pure TiO2, F–TiO2 and FPt3–TiO2 nanocomposites. | ||
The conduction band of the pure TiO2 is more negative than that of TiO2 based nanocomposites (FPtx–TiO2) due to the induction of new energy levels by co-doping TiO2 with Pt and F; hence there is diffusion of electrons (eCB−) from the CB potential of TiO2 to the new CB generated levels of TiO2 based nanocomposites to react on the surface with the absorbed O2 in order to generate superoxide anions (O2˙−) as super-oxidizing radicals for the degradation of SMX drugs. Meanwhile, the VB potential of TiO2 is more positive than that of pure TiO2, thus there is transfer of holes (hVB+) from the VB of TiO2 to the new added energy level of TiO2 based TiO2 caused by the induction of F and Pt to react on the surface and then generate hydroxyl radicals (˙OH) which also act for the destruction of SMX.36,37 In addition, the incorporation of F and Pt into the TiO2 lattice generate considerable defects, which tend to produce deep or low energy levels near the conduction band with typical Ti3+ states.38 Table 1 presents the estimated band gap energies of TiO2, F–TiO2, and FPtx–TiO2 nanocomposites prepared at 180 °C and calcined at 400 °C in air.
3.5 Photocatalytic degradation of SMX using solar simulator and direct solar light
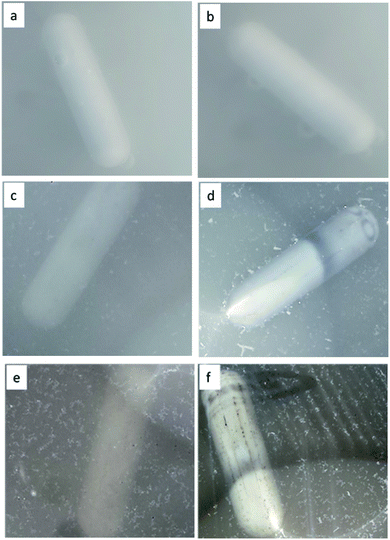
The Fig. 6 shows the images of (SMX plus photocatalyst) solutions during the photocatalytic degradation process. Actually, the images demonstrate clearly the formation of a floating product during the photocatalytic degradation of SMX. Fig. 6(a), (c) and (e) images were taken after 30 min in dark, while Fig. 6(b), (d) and (f) was taken after 120 min of photocatalytic degradation of SMX drug using TiO2, F–TiO2 and FPt3–TiO2 nanocomposites under direct solar light, respectively. Fig. 6(a) and (b) images show a clean surface with no floatation of any product while other images show that the floatation of the generated polymer started after 30 min in dark (Fig. 6(c) and (d) images) and appears at high intensity after 120 min (Fig. 6(d) and (f)). Indeed, the floatation occurred only by including F− in the TiO2 lattice. The following images were taken during the photocatalytic degradation of SMX using direct sunlight, however it should be mentioned that there is floataion even with solar simulator of fluoropolymer.![[thin space (1/6-em)]](https://www.rsc.org/images/entities/char_2009.gif) 630 and 18
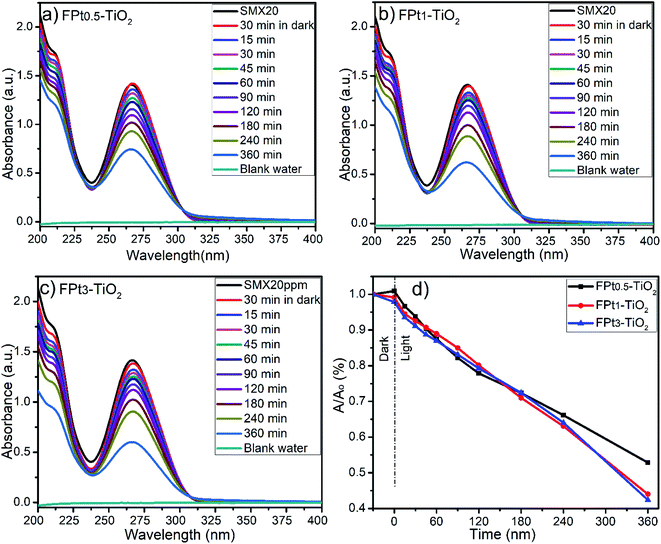
630 and 18![[thin space (1/6-em)]](https://www.rsc.org/images/entities/char_2009.gif) 360 LUXs. The temperature of the reaction medium was ranging between 31 and 33 °C. The degradation of SMX was slightly improved by increasing the amount of Pt from 0.5 to 3% in TiO2 matrix as shown by Fig. 7(a)–(c). The photocatalytic degradation was incomplete at 360 minutes (min) after 30 min in dark even with FPt3–TiO2. The wide absorbance gap shown by UV-Vis spectra (a)–(c) in Fig. 7, especially between 240 min and 360 min was due to the volume decrease of the treated solution. After sampling many times, the volume of the solution become less, thus, the degradation rate become fast. The light energy power supplied by the solar simulator was not sufficient to complete the degradation of SMX, hence, less than 60% of SMX degradation was achieved within 360 min while increasing the amount of Pt in TiO2 matrix as shown in Fig. 7(d). To overcome this photocatalytic degradation weakness, the degradation of SMX has been moved under direct solar light irradiation.
360 LUXs. The temperature of the reaction medium was ranging between 31 and 33 °C. The degradation of SMX was slightly improved by increasing the amount of Pt from 0.5 to 3% in TiO2 matrix as shown by Fig. 7(a)–(c). The photocatalytic degradation was incomplete at 360 minutes (min) after 30 min in dark even with FPt3–TiO2. The wide absorbance gap shown by UV-Vis spectra (a)–(c) in Fig. 7, especially between 240 min and 360 min was due to the volume decrease of the treated solution. After sampling many times, the volume of the solution become less, thus, the degradation rate become fast. The light energy power supplied by the solar simulator was not sufficient to complete the degradation of SMX, hence, less than 60% of SMX degradation was achieved within 360 min while increasing the amount of Pt in TiO2 matrix as shown in Fig. 7(d). To overcome this photocatalytic degradation weakness, the degradation of SMX has been moved under direct solar light irradiation.
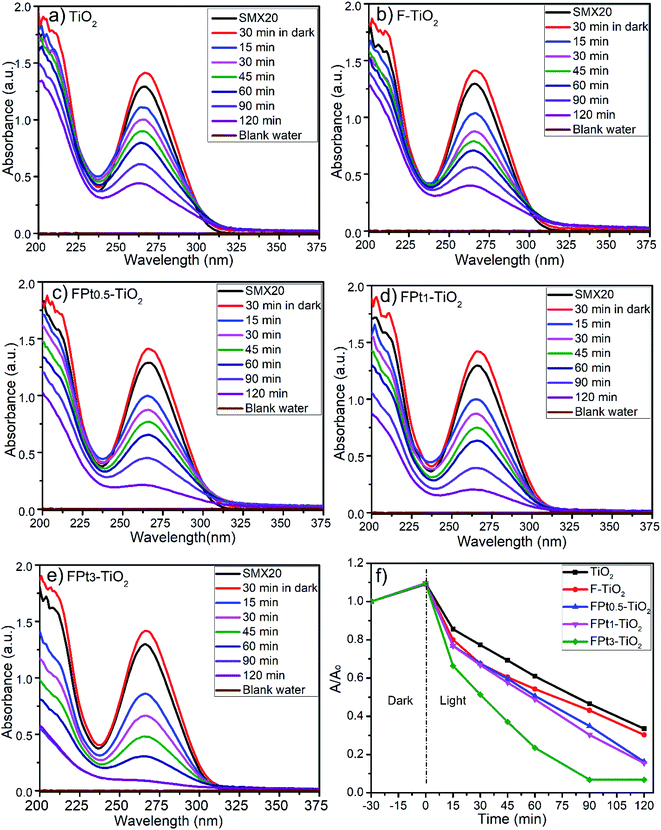
Photocatalytic degradation rate of SMX has been previously studied by Chiang and Doong using 1g L−1 of pure TiO2 and Cu deposited on TiO2 surface but with less concentration of SMX (4 mg L−1); where the photocatalytic degradation process initiated by irradiating the mixture with visible light irradiation after 30 min of stirring in dark (pH = 5.2). Indeed, the photocatalytic degradation rate of SMX, using pristine P25 TiO2, was around 35% within 120 min which remains similar or slightly higher even by increasing the degradation time.39 The reported results in the literature shows clearly that the unchanged TiO2 has less effect on the photocatalytic degradation of SMX which is in good agreement with the displayed results in this work. Ioannidou et al. reported a complete photocatalytic degradation of (1 mg L−1) SMX, which is a very low concentration compared to that used in the present work (20 mg L−1), within 120 min using 250 mg L−1 of P25 TiO2 modified with tungsten under solar simulator irradiation.40 Recently, Borowska et al. have investigated 50 mg L−1 of TiO2 and TiO2 modified with 1% of palladium and 1% of platinum for the degradation of 1 mg L−1 of SMX using solar light. Indeed, less than 5% of SMX was degraded using undoped TiO2 within 30 min while almost complete degradation SMX within 10 min using palladium modified TiO2 and around 90% of degradation was achieved within 30 min using platinum modified TiO2,41 which is matching with degradation rate in the present work. However, in the literature there is no reporting documents that shows the floatation of the degraded product except our earlier published work.42
In contrast with our results and the mentioned results above reported in the literature, Nasuhoglu et al. reported that the degradation rate of (12 mg L−1) SMX diminishes as TiO2 concentration increases using UV-C radiation (λmax = 254 nm).43
Table 2 presents the photocatalytic degradation of SMX using solar simulator and direct solar light irradiations escorted with temperature of the reaction medium.
| Nanocomposite | Degradation of SMX using solar simulator | Degradation of SMX using direct sunlight | ||||||
|---|---|---|---|---|---|---|---|---|
| Degradation (%) | Time (min) | T (°C) | Degradation (%) | Time (min) | T (°C) | |||
| Dark | Light | Dark | Light | |||||
| TiO2 | — | — | — | — | 66.5 | 120 | 42 | 36–38 |
| F–TiO2 | — | — | — | — | 69.7 | 120 | 41 | 34–36 |
| FPt0.5–TiO2 | 47.3 | 360 | 33 | 28 | 83.8 | 120 | 42 | 35–37 |
| FPt1–TiO2 | 56 | 360 | 33 | 28 | 84.5 | 120 | 41 | 34–35 |
| FPt3–TiO2 | 57.6 | 360 | 33 | 28 | 93.2 | 90 | 41 | 33–34 |
| 93.3 | 120 | 41 | 33–34 | |||||
3.6 Kinetics of reaction
The kinetics of reaction occurred during the photocatalytic degradation of SMX using TiO2 based nanocomposites can be described in such system by the Langmuir–Hinshelwood model:44where C is the concentration of substrate, Kr is the reaction rate constant and K is the adsorption constant. For diluted solutions in which the substrate concentration is <10−3 M, the value of KC ≪ 1; thus, the equation can be simplified to pseudo-first order kinetic equation:44,45
where C0 and Ct are the initial concentration and concentration at time t, respectively. k is the reaction rate constant.
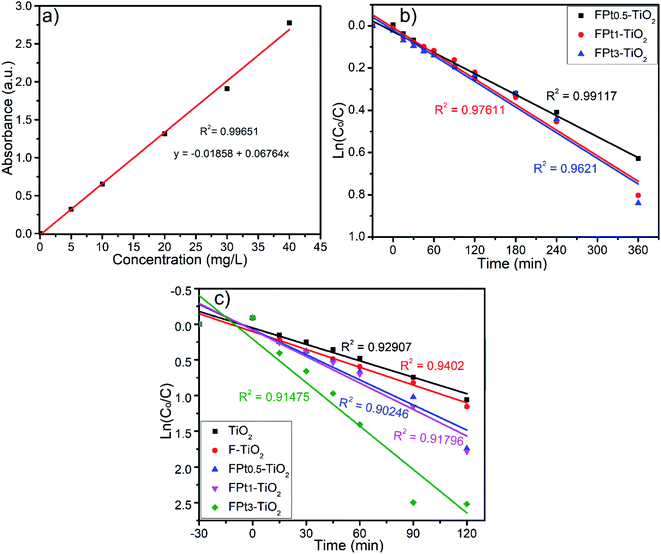
In order to study the kinetics of photocatalytic degradation of SMX using TiO2 based nanocomposites, experiments were conducted under both solar simulator and direct sunlight irradiations. Meanwhile, calibration curve with R2 = 0.99651 was investigated to determine the concentration for each specimen during the photocatalytic degradation process. Fig. 9(a)–(c) shows the calibration curve, kinetics of reaction using solar simulator and kinetics of reaction under direct sunlight irradiation, respectively. The photocatalytic degradation of SMX using F and Pt co-doped TiO2 under both solar simulator and direct sunlight irradiations find to be commonly explained by the first-order kinetics as shown in Fig. 9(b) and (c), respectively. The photocatalytic degradation rate of SMX was fast using direct sunlight irradiation with respect to solar simulator irradiation which can be explained by the low intensity of solar simulator irradiation and wide wavelength range absorbed by TiO2 based nanocomposites.
3.7 SEM images and EDS analysis of the floated polymer after degradation of SMX
The external morphology and elemental composition of the floated product, i.e. F–TiO2 and FPt3–TiO2 photocatalysts after the degradation of SMX are shown by SEM images and EDS analysis (Fig. 10). The SEM images and EDS analysis of the floated product obtained after the photocatalytic degradation of SMX drug using F–TiO2 and FPt3–TiO2 nanocomposites, show similar morphology and same elemental composition. The morphology of the floated polymer displayed by (a) and (b) SEM is flat and with irregular shape. Meanwhile, the EDS analysis showed in Fig. 10(c) and (d) a very intense peak of fluorine with more than 46.9% of the elemental composition of the floated polymer as indicated in the elemental composition tables. This can only predict that the floated polymer is a metal-fluoropolymer. The absence of Pt in the elemental composition of the metal-fluoropolymer might be due to it low percentage or due to its non-contribution on the photo-generation of the floated polymer during the photocatalytic degradation of SMX drug.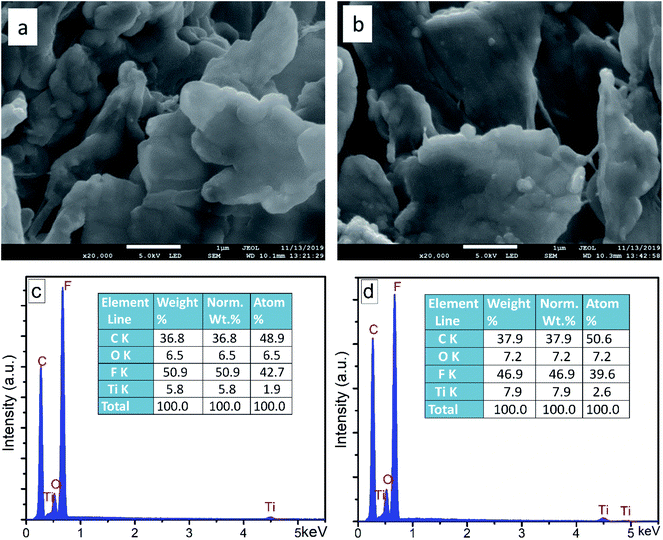 | ||
| Fig. 10 SEM images and EDS analysis of the floated polymer after photocatalytic degradation of SMX drug using (a) and (c) F–TiO2 and (b) and (d) FPt3–TiO2, respectively. | ||
3.8 Fourier-transform infrared (FT-IR) spectroscopy analysis
The FT-IR spectra of TiO2, F–TiO2, FPt3–TiO2 nanocomposites, sulfamethoxazole drug and the floated product after the photocatalytic degradation of sulfamethoxazole drug using F–TiO2 and FPt3–TiO2 nanocomposites are given in Fig. 11. The spectra shown in Fig. 11(a) are characteristically similar of absorption peaks of TiO2. Typically, the FT-IR spectra of TiO2, F–TiO2 and FPt3–TiO2 nanocomposites (Fig. 11(a)) show a broad absorption band in the region of 3000–3642 cm−1 (with maximum at 3400 cm−1) and 1635 cm−1 assigned to the stretching vibrations (νOH) and symmetric bending vibrations (δsOH) of absorbed water on the surface of the photocatalyst, respectively. Moreover, the peaks at 2068 and 1387 cm−1 were assigned to the bending mode of coordinated water (H–O–H) and O–H, respectively. The strong absorption peak in the region of 432–892 cm−1 with a maximum absorption at 665 cm−1 is attributed to the symmetric stretching vibrations of the Ti–O (νsTi–O).46 The small peak at 1112 cm−1 was assigned to the asymmetric stretching vibrations of the Ti–O (νasTi–O).47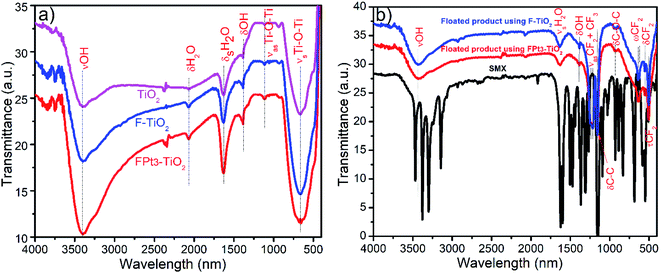 | ||
| Fig. 11 FTIR of (a) synthesized photocatalysts used for photocatalytic degradation of SMX drug and (b) floated products collected after the photocatalytic degradation of SMX. | ||
On the other hand, the FT-IR spectra of SMX drug and floated product after degradation of SMX using F–TiO2 and FPt3–TiO2 photocatalyst are shown in Fig. 11(b); hence, there are no similarity between the floated product and SMX drug. It should be mentioned that all the bands appeared in the spectra of the photocatalyst are present in the FT-IR spectra of the floated product except νsTi–O and νasTi–O. Bands located on the floated product spectra at 1216 and 1155 cm−1 assigned to the (CF3 and CF2) asymmetric and (CF2) symmetric stretching vibrations, respectively.48,49 The small band at 929 cm−1 was assigned to the bending vibration of C–O–C group.50 The doublets at 640 and 625 cm−1 are matched to the CF2 wagging vibrations.48 Additionally, the two bands on the floated product spectrum, using F–TiO2 and FPt3–TiO2 photocatalysts, located at 556 and 506 cm−1 reflect the CF2 bending and twisting vibrations, respectively.51,52 The FT-IR analysis confirm that the generated product floated on the surface of the treated solution is due to the presence of fluoride irons (F−) which further react with the degraded products to form a metal-fluoropolymer.42
3.9 Possible photocatalytic degradation pathways of SMX
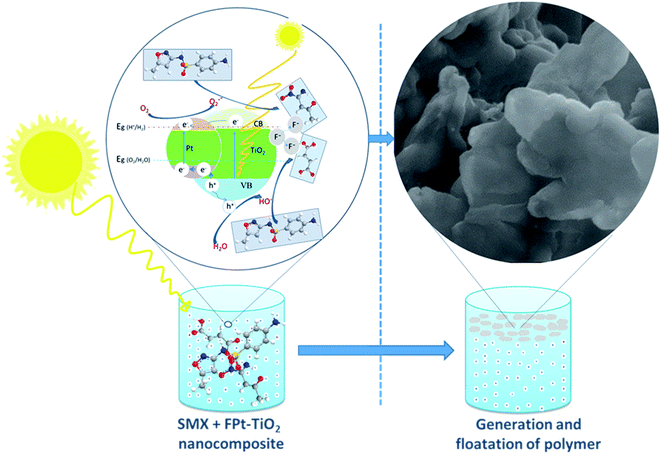
Fig. 12 illustrates the possible photocatalytic degradation of SMX followed by fluorination of the degraded products and then floatation of the formed polymer using the FPtx–TiO2 nanocomposites prepared via a one-step microwave-assisted hydrothermal method. The photocatalytic degradation process starts in the dark to assure the equilibrium absorption–desorption of SMX on the surface of FPt–TiO2 nanocomposites. This is where the superoxide anions (O2˙−) and hydroxyl radicals (˙OH) initially formed, after the exposure of FPt–TiO2 surface to the light, due to the oxidation of O2 and H2O existing on the surface of the prepared photocatalyst (FPt–TiO2).53 These superoxide anions and hydroxyl radicals exhibiting the power of oxidation destruction degrade SMX to smaller fragments which is fluorinated by fluoride ions and act to form a polymer floating on the surface of the treated solution as demonstrated in Fig. 12.42The presence of fluorine induces the replacement of ![[triple bond, length as m-dash]](https://www.rsc.org/images/entities/char_e002.gif) Ti–OH groups located on the surface of TiO2 nanoparticles by
Ti–OH groups located on the surface of TiO2 nanoparticles by ![[triple bond, length as m-dash]](https://www.rsc.org/images/entities/char_e002.gif) Ti–F groups, thus generate free hydroxyl radicals (˙OH) with larger redox potential than that of ˙OH radicals adsorbed on surface TiO2.54,55 The fluoride ions, therefore, present a positive effect on the photocatalytic activity of TiO2 when the reaction happening on the surface of the nanoparticles requires the intervention of the ˙OH radicals, but in the main time has a negative effect when the reaction proceeds through the photogenerated holes.55,56 Hence, the presence fluorine on the surface of TiO2 can only acts using free ˙OH radicals formed and dispersed in the reaction solution for the degradation of SMX drugs, instead of the photogenerated ˙OH radicals on the surface of TiO2. Meanwhile, SMX can be destructed directly on the surface of platinum as a result of electron escape, as well as indirectly by photogenerated oxidizing radicals: O2˙− from excited electrons on the conduction band (eCB−) and ˙OH from the holes leaving after excitation of electrons on the valence band (hVB+).36 On the other hand, the fluoride radical ions photogenerated on the surface of TiO2 acts for the fluorination of TiO2 the degraded products and finally floatation as fluoropolymer.42
Ti–F groups, thus generate free hydroxyl radicals (˙OH) with larger redox potential than that of ˙OH radicals adsorbed on surface TiO2.54,55 The fluoride ions, therefore, present a positive effect on the photocatalytic activity of TiO2 when the reaction happening on the surface of the nanoparticles requires the intervention of the ˙OH radicals, but in the main time has a negative effect when the reaction proceeds through the photogenerated holes.55,56 Hence, the presence fluorine on the surface of TiO2 can only acts using free ˙OH radicals formed and dispersed in the reaction solution for the degradation of SMX drugs, instead of the photogenerated ˙OH radicals on the surface of TiO2. Meanwhile, SMX can be destructed directly on the surface of platinum as a result of electron escape, as well as indirectly by photogenerated oxidizing radicals: O2˙− from excited electrons on the conduction band (eCB−) and ˙OH from the holes leaving after excitation of electrons on the valence band (hVB+).36 On the other hand, the fluoride radical ions photogenerated on the surface of TiO2 acts for the fluorination of TiO2 the degraded products and finally floatation as fluoropolymer.42
4. Conclusions
TiO2, F–TiO2 and FPtx–TiO2 nanocomposites were successfully synthesized via a facile hydrothermal-assisted microwave process and investigated for the photocatalytic degradation of SMX drug. The prepared photocatalysts possessed multiple roles on the photocatalytic removal of SMX such as photocatalytic degradation, photo-generation of a new product (referred to as metal-fluoropolymer), and then floatation of resulting product. This unique kind of photocatalysts will attract a lot of interest in the future as it provides a facile route towards micropollutants degradation and removal. The incorporation of fluoride ions in the TiO2 lattice serves to (i) control the growth of anatase phase, which is the most suitable photocatalytic active phase in TiO2, and (ii) enhance the fluorination process of the degraded products. On the other hand, platinum, known as an electrochemical catalyst, was used to add new energy levels between the valence band and conductive band of TiO2 in order to narrow the band gap of TiO2 thereby broadening the photocatalytic absorption to the visible and near infrared regions. The photocatalytic performance of the synthesized photocatalysts was studied using SMX drug under both solar simulator and direct sunlight irradiations. The photocatalytic performance increased by using direct solar irradiations, hence, the degradation time was reduced from 360 min after 30 min in the dark (with a degradation efficiency ca 57% using solar simulator) to 90 min after 30 min in dark (with a degradation efficiency > 93% using direct sunlight irradiation).Conflicts of interest
The authors announce that there are no conflicts to declare.Acknowledgements
This work was supported by the University of South Africa (Nanotechnology and Water Sustainability Research Unit), the National Research Foundation (NRF), and the Water Research Commission (WRC).References
- M. Patel, R. Kumar, K. Kishor, T. Mlsna, C. U. Pittman and D. Mohan, Chem. Rev., 2019, 119, 3510–3673 CrossRef CAS PubMed.
- S. A. Kraemer, A. Ramachandran and G. G. Perron, Microorganisms, 2019, 7, 180 CrossRef CAS PubMed.
- V. Calisto, C. P. Silva, V. I. Esteves, D. L. D. Lima, C. Oliveira and M. Otero, Sci. Total Environ., 2018, 648, 1403–1410 Search PubMed.
- L. Yang, L. Jiang, X. Cao, M. Inyang, Y. Yao, B. Gao, H. Chen, A. R. Zimmerman, H. Li and Y. Xue, J. Hazard. Mater., 2012, 209–210, 408–413 Search PubMed.
- W. Ouyang, E. Kuna, A. Yepez, A. Balu, A. Romero, J. Colmenares and R. Luque, Nanomaterials, 2016, 6, 93 CrossRef PubMed.
- M. V. Dozzi, C. D'Andrea, B. Ohtani, G. Valentini and E. Selli, J. Phys. Chem. C, 2013, 117, 25586–25595 CrossRef CAS.
- M. Kapilashrami, Y. Zhang, Y.-S. Liu, A. Hagfeldt and J. Guo, Chem. Rev., 2014, 114, 9662–9707 CrossRef CAS PubMed.
- K. H. Leong, H. Y. Chu, S. Ibrahim and P. Saravanan, Beilstein J. Nanotechnol., 2015, 6, 428–437 CrossRef CAS PubMed.
- X. Qin, Z. Zheng, Y. Dai, X. Zhang, M.-H. Whangbo and B. Huang, J. Mater. Chem., 2011, 21, 9079–9087 RSC.
- X. Chen and S. S. Mao, Chem. Rev., 2007, 107, 2891–2959 CrossRef CAS PubMed.
- N. Roy, K. T. Leung and D. Pradhan, J. Phys. Chem. C, 2015, 119, 19117–19125 CrossRef CAS.
- J. Gomes, R. Costa, A. Lopes, R. Quinta-Ferreira, K. Bednarczyk, M. Gmurek, M. Quinta-Ferreira, A. Zaleska-Medynska, M. Stelmachowski and R. Martins, ChemEngineering, 2018, 2, 1–14 CrossRef.
- X. Xiong and Y. Xu, J. Phys. Chem. C, 2016, 120, 3906–3912 CrossRef CAS.
- Y. Hu, X. Song, S. Jiang and C. Wei, Chem. Eng. J., 2015, 274, 102–112 CrossRef CAS.
- F. Zhang, J. Chen, X. Zhang, W. Gao, R. Jin, N. Guan and Y. Li, Langmuir, 2004, 20, 9329–9334 CrossRef CAS PubMed.
- R. Jaiswal, N. Patel, A. Dashora, R. Fernandes, M. Yadav, R. Edla, R. S. Varma, D. C. Kothari, B. L. Ahuja and A. Miotello, Appl. Catal., B, 2016, 183, 242–253 CrossRef CAS.
- R. Jaiswal, J. Bharambe, N. Patel, A. Dashora, D. C. Kothari and A. Miotello, Appl. Catal., B, 2015, 168–169, 333–341 CrossRef CAS.
- H. Sun, S. Wang, H. M. Ang, M. O. Tadé and Q. Li, Chem. Eng. J., 2010, 162, 437–447 CrossRef CAS.
- A. M. Czoska, S. Livraghi, M. Chiesa, E. Giamello, S. Agnoli, G. Granozzi, E. Finazzi, C. Di Valentiny and G. Pacchioni, J. Phys. Chem. C, 2008, 112, 8951–8956 CrossRef CAS.
- T. Butburee, P. Kotchasarn, P. Hirunsit, Z. Sun, Q. Tang, P. Khemthong, W. Sangkhun, W. Thongsuwan, P. Kumnorkaew, H. Wang and K. Faungnawakij, J. Mater. Chem. A, 2019, 7, 8156–8166 RSC.
- J. C. Yu, J. Yu, W. Ho, Z. Jiang and L. Zhang, Chem. Mater., 2002, 14, 3808–3816 CrossRef CAS.
- D. Li, H. Haneda, S. Hishita, N. Ohashi and N. K. Labhsetwar, J. Fluorine Chem., 2005, 126, 69–77 CrossRef CAS.
- Z. Zhang, O. Bondarchuk, B. D. Kay, J. M. White and Z. Dohnálek, J. Phys. Chem. C, 2007, 111, 3021–3027 CrossRef CAS.
- P. Ganguly, S. Mathew, L. Clarizia, S. Kumar R, A. Akande, S. Hinder, A. Breen and S. C. Pillai, Appl. Catal., B, 2019, 253, 401–418 CrossRef CAS.
- M. Jahdi, S. B. Mishra, E. N. Nxumalo, S. D. Mhlanga and A. K. Mishra, Opt. Mater., 2020, 104, 109844 CrossRef CAS.
- M. Mousavi, A. Habibi-Yangjeh and M. Abitorabi, J. Colloid Interface Sci., 2016, 480, 218–231 CrossRef CAS PubMed.
- R. S. Mulliken, J. Chem. Phys., 1934, 2, 782–793 CrossRef CAS.
- E. M. Samsudin, S. B. A. Hamid, J. C. Juan, W. J. Basirun, A. E. Kandjani and S. K. Bhargava, Appl. Surf. Sci., 2016, 365, 57–68 CrossRef CAS.
- M. D. Dramićanin, Z. Antić, S. Ćulubrk, S. P. Ahrenkiel and J. M. Nedeljković, Nanotechnology, 2014, 25, 485501 CrossRef PubMed.
- J. G. Li, C. Tang, D. Li, H. Haneda and T. Ishigaki, J. Am. Ceram. Soc., 2004, 87, 1358–1361 CrossRef CAS.
- W. Kang, C. S. Spanjers, R. M. Rioux and J. D. Hoefelmeyer, J. Mater. Chem. A, 2013, 1, 7717–7728 RSC.
- K. Huang, K. Sasaki, R. R. Adzic and Y. Xing, J. Mater. Chem., 2012, 22, 16824–16832 RSC.
- Z. Yao, M. Zhu, F. Jiang, Y. Du, C. Wang and P. Yang, J. Mater. Chem., 2012, 22, 13707–13713 RSC.
- J. L. Gole, J. D. Stout, C. Burda, Y. Lou and X. Chen, J. Phys. Chem. B, 2004, 108, 1230–1240 CrossRef CAS.
- X. Yong and M. A. A. Schoonen, Am. Mineral., 2000, 85, 543–556 CrossRef.
- D. Benz, K. M. Felter, J. Köser, J. Thöming, G. Mul, F. C. Grozema, H. T. Hintzen, M. T. Kreutzer and J. R. van Ommen, J. Phys. Chem. C, 2020, 124, 8269–8278 CrossRef CAS.
- Q. Yuan, L. Chen, M. Xiong, J. He, S. L. Luo, C. T. Au and S. F. Yin, Chem. Eng. J., 2014, 255, 394–402 CrossRef CAS.
- X. Chen, L. Liu, P. Y. Yu and S. S. Mao, Science, 2011, 331, 746 CrossRef CAS PubMed.
- L. F. Chiang and R. A. Doong, Sep. Purif. Technol., 2015, 156, 1003–1010 CrossRef CAS.
- E. Ioannidou, Z. Frontistis, M. Antonopoulou, D. Venieri, I. Konstantinou, D. I. Kondarides and D. Mantzavinos, Chem. Eng. J., 2017, 318, 143–152 CrossRef CAS.
- E. Borowska, J. F. Gomes, R. C. Martins, R. M. Quinta-Ferreira, H. Horn and M. Gmurek, Catalysts, 2019, 9, 500 CrossRef CAS.
- M. Jahdi, S. B. Mishra, E. N. Nxumalo, S. D. Mhlanga and A. K. Mishra, Appl. Catal., B, 2020, 267, 118716 CrossRef CAS.
- D. Nasuhoglu, V. Yargeau and D. Berk, J. Hazard. Mater., 2011, 186, 67–75 CrossRef CAS PubMed.
- M. Długosz, P. Zmudzki, A. Kwiecień, K. Szczubiałka, J. Krzek and M. Nowakowska, J. Hazard. Mater., 2015, 298, 146–153 CrossRef PubMed.
- A. Mirzaei, L. Yerushalmi, Z. Chen, F. Haghighat and J. Guo, Water Res., 2018, 132, 241–251 CrossRef CAS PubMed.
- H. Khan, M. G. Rigamonti, G. S. Patience and D. C. Boffito, Appl. Catal., B, 2018, 226, 311–323 CrossRef CAS.
- G. Devanand Venkatasubbu, S. Ramasamy, V. Ramakrishnan and J. Kumar, Adv. Powder Technol., 2013, 24, 947–954 CrossRef CAS.
- T. Hwang, V. Palmre, J. Nam, D. C. Lee and K. J. Kim, Smart Mater. Struct., 2015, 24, 105011 CrossRef.
- C. Guo, M. Xu, S. Xu and L. Wang, Nanoscale, 2017, 9, 7163–7168 RSC.
- M. Zhao, Y. Yu, Z. Han and H. Li, Polymers, 2017, 9, 606 CrossRef PubMed.
- L. N. Ignatieva, G. A. Zverev, N. A. Adamenko, A. V. Kazurov and A. Y. Ustinov, J. Fluorine Chem., 2019, 217, 58–62 CrossRef CAS.
- J. Mihály, S. Sterkel, H. M. Ortner, L. Kocsis, L. Hajba, É. Furdyga and J. Minka, Croat. Chem. Acta, 2006, 79, 497–501 Search PubMed.
- M. V. Sofianou, V. Psycharis, N. Boukos, T. Vaimakis, J. Yu, R. Dillert, D. Bahnemann and C. Trapalis, Appl. Catal., B, 2013, 142–143, 761–768 CrossRef CAS.
- J. Yu, W. Wang, B. Cheng and B. L. Su, J. Phys. Chem. C, 2009, 113, 6743–6750 CrossRef CAS.
- J. F. Montoya and P. Salvador, Appl. Catal., B, 2010, 94, 97–107 CrossRef CAS.
- M. Bellardita, C. Garlisi, A. M. Venezia, G. Palmisano and L. Palmisano, Catal. Sci. Technol., 2018, 8, 1606–1620 RSC.
| This journal is © The Royal Society of Chemistry 2020 |


