 Open Access Article
Creative Commons Attribution 3.0 Unported Licence
Constructing high-performance electrode materials using core–shell ZnCo2O4@PPy nanowires for hybrid batteries and water splitting†
Xiaoyun Liu *a,
Qian Lia,
Yanli Qina and
Yueqiu Jiang*b
aSchool of Science, Shenyang Ligong University, Shenyang 110159, P. R. China. E-mail: liuxy@imr.ac.cn
bDepartment of Development and Planning, Shenyang Ligong University, Shenyang 110159, P. R. China. E-mail: yueqiujiang@sylu.edu.cn
First published on 29th July 2020
Abstract
Heterogeneity can be used as a promising method to improve the electrochemical performance of electrode materials; thus, ZnCo2O4@PPy samples were prepared using a facile hydrothermal route and an electrochemical deposition process. The as-prepared products possess a specific capacitance of 605 C g−1 at a current density of 1 A g−1. The asymmetric supercapacitor (ASC) possesses an energy density of 141.3 W h kg−1 at a power density of 2700.5 W kg−1 and capacity retention of 88.1% after 10![[thin space (1/6-em)]](https://www.rsc.org/images/entities/char_2009.gif) 000 cycles, indicating its promising potential for energy devices. ZnCo2O4@PPy-50 exhibited an excellent OER performance and outstanding HER performance in alkaline media. As an advanced bifunctional electrocatalyst for overall water splitting, a voltage of 1.61 V at a current density of 50 mA cm−2 outperforms the majority of noble-metal-free electrocatalysts.
000 cycles, indicating its promising potential for energy devices. ZnCo2O4@PPy-50 exhibited an excellent OER performance and outstanding HER performance in alkaline media. As an advanced bifunctional electrocatalyst for overall water splitting, a voltage of 1.61 V at a current density of 50 mA cm−2 outperforms the majority of noble-metal-free electrocatalysts.
1. Introduction
Our rapidly developing economic society requires a technological evolution to construct high-efficiency energy-storage devices for future renewable power tools.1–5 Supercapacitors exhibit excellent cycling, fast-charging abilities, and small sizes, which makes them the most promising candidates for next generation power devices.6–8 However, for practical applications, the low power density limits their rapid development.9–12 At the same time, electrode materials play a crucial role in high-performance devices. Thus, the design and selection of ideal electrode materials can effectively solve this problem.13 In addition, electrocatalytic water splitting has been regarded as the most hopeful method to generate high-purity hydrogen.14,15 However, the efficiency of water splitting is restricted by the kinetically sluggish oxygen evolution reaction (OER).16,17 Therefore, the construction of efficient and economical electrode materials is the key to improving the device performance and fabricating highly active catalysts.Owing to their rich redox active sites and large specific surface areas, various transition metal oxides, including ZnO, SnO2, Co3O4, and ZnCo2O4 materials, have been widely investigated.18–21 Among them, ZnCo2O4 electrodes stand out because of their high theoretical capacitance and a high number of active sites.22,23 For example, Pail et al. fabricated a rGO–ZnCo2O4 nanocomposite through a hydrothermal method, which possesses a specific capacitance of 500.8 F g−1 at a current density of 1 A g−1.24 The Kamble group synthesized a ZnCo2O4 thin film electrode, which presents a specific capacitance of 127.8 F g−1 at a current density of 1 A g−1 and 80.6% capacity retention after 3000 cycles.25 Su and coworkers researched flower-like ZnCo2O4 with a specific capacitance of 384 F g−1 at a current density of 1 A g−1.26 Choi et al. reported a ZnCo2O4 electrode, which was fabricated through simple methods. The samples can be directly utilized as electrode materials and show excellent OER performances.27 However, the single-crystalline ZnCo2O4 electrodes possess poor cycle stability. An effective strategy for improving this is compounding with conductive polymers. As a typical conjugated polymer, PPy is considered to be a very promising electrode material due to its high electrical conductivity. At the same time, reports indicate that combining PPy with metal compounds can greatly improve the specific capacitance and cycle performance as well as decrease the overpotential. This can be attributed to PPy promoting electron transport and reaction internal resistance.
In this work, we synthesized novel ZnCo2O4@PPy-50 nanostructures directly grown on Ni foam using a hydrothermal method and an electrochemical deposition process. The ZnCo2O4@PPy electrode materials show a capacitance of 605 C g−1 at a current density of 1 A g−1. When used as anode materials, the as-fabricated device exhibits an energy density of 141.3 W h kg−1 at a power density of 2700.5 W kg−1 and a capacity retention of 88.1% after 10![[thin space (1/6-em)]](https://www.rsc.org/images/entities/char_2009.gif) 000 cycles. As electrocatalysts, the ZnCo2O4@PPy-50 samples show a low overpotential of 240 mV at 50 mA cm−2 and a low cell voltage of overall water splitting.
000 cycles. As electrocatalysts, the ZnCo2O4@PPy-50 samples show a low overpotential of 240 mV at 50 mA cm−2 and a low cell voltage of overall water splitting.
2. Experimental details
In the experiments, Ni foam (4 × 4 cm2) was immersed in a 1.0 M HCl solution for 30 min. Next, the Ni foam was repeatedly cleaned with ethanol and deionized water and then dried overnight.2.1 Synthesis of the ZnCo2O4 nanowires
The ZnCo2O4 nanowires were fabricated on Ni foam via a facile hydrothermal method. 2 mmol Zn(NO3)2·6H2O, 4 mmol Co(NO3)2·6H2O, 3 mM NH4F, and 6 mM urea were dissolved in 60 mL deionized water and magnetically stirred for 30 min. Then, the pre-treated Ni foam was placed in a uniform solution and kept at 140 °C for 6 h. After cooling to room temperature, the ZnCo2O4 precursor was washed with deionized water and ethanol and dried at 60 °C overnight. Afterwards, the sample was calcinated at 350 °C for 2 h. The average mass loading of the sample was 1.9 mg cm−2.2.2 Synthesis of the ZnCo2O4@PPy composite structures
The PPy nanofilm was fabricated on ZnCo2O4 nanowire surfaces by the electrochemical deposition method. For the cathodic deposition, a solution of 1 mL Py and 3 g p-toluenesulfonic acid was used as the electrolyte. The deposition was carried out in a three-electrode system, consisting of a piece of Ni foam with ZnCo2O4 as the working electrode, a Pt foil as the counter electrode, and Ag/AgCl as the reference electrode. The deposition was carried out at a constant potential of 0.95 V for 50 s at room temperature. The final samples were washed with deionized water and dried at 60 °C. The average mass loading was 2.0 mg cm−2.2.3 Structure characterization
The morphology and crystal structure of the as-prepared samples were studied by X-ray powder diffraction (XRD) using a Shimadzu-7000 with Cu Kα radiation, X-ray photoelectron spectroscopy (XPS) analysis utilizing an ESCALAB 250 with an Al Kα source, and Fourier transform infrared spectroscopy (FTIR, 4000–500 cm−1). Scanning electron microscopy (SEM) using a JSM-7001F microscope and transmission electron microscopy (TEM) using JEM-2100 PLUS were also performed. The surface area of the samples was investigated through N2 absorption and desorption isotherms.2.4 Electrochemical measurements
The electrochemical characteristics of the electrode materials were studied using a CHI660E electrochemical workstation (Chenhua, Shanghai). Cyclic voltammetry (CV) curves, galvanostatic charge–discharge (GCD) tests and electrochemical impedance spectroscopy (EIS) results were measured in a three-electrode system in 3.0 M KOH solutions. The as-produced samples, Pt foil, and Hg/HgO were used as the working electrode, counter electrode, and reference, respectively.2.5 Assembly of asymmetric supercapacitors (ASCs)
Asymmetric supercapacitors were constructed using the ZnCo2O4@PPy-50 samples as the cathode and active carbon (AC) as the anode. The specific capacitance (Cs) of the electrode materials were obtained using discharge times (Δt) according to the following equation:| Cs = IΔt/mΔV | (1) |
| E = 1/2CV2 | (2) |
| P = 3600E/t | (3) |
2.6 Electrocatalytic performance
Linear sweep voltammetry (LSV) polarization curves and long-term durability measurements were obtained on a CHI 660E electrochemical workstation (Shanghai Chenhua) with Ag/AgCl as the reference electrode and Pt foil as the counter electrode, and the as-prepared samples as the working electrode in 1.0 M KOH electrolyte.3. Results and discussion
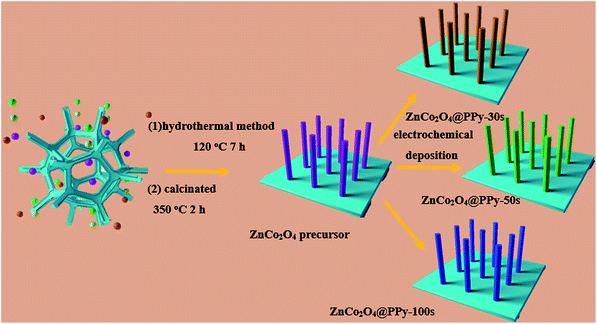
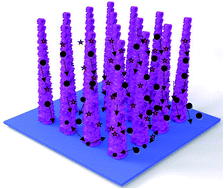
The fabrication process of the positive electrode is schematically illustrated in Fig. 1. Firstly, Ni foam uniformly coated with ZnCo2O4 samples is obtained using a facile hydrothermal method. Subsequently, by using an electrochemical deposition method, which employs ZnCo2O4 as the precursor under different conditions, the positive electrodes can be immediately obtained.Concerning the composition of the as-prepared materials, typical XRD patterns of the ZnCo2O4 and ZnCo2O4@PPy samples are shown in Fig. 2a, in which the highest peaks are from the Ni foam (2θ = 44.6°, 51.8°, and 76.6°). In the blue curves, the main peaks at 2θ values of 31.6°, 36.4°, 44.6°, 59.1°, and 64.5° can be indexed to the (220), (311), (400), (511), and (440) planes of the cubic spinel ZnCo2O4 phase (PDF no. 23-1390). In the XRD pattern of the composite structure, the diffraction peaks located at the same peak position may be assigned to the ZnCo2O4 phase. In the XRD pattern of the composite material, a clear peak appears at about 26°, proving that PPy successfully coated the surface of ZnCo2O4. FTIR spectroscopy was utilized to further study the distinct structures of the ZnCo2O4, PPy, and ZnCo2O4@PPy materials (Fig. 2b). The peak situated at 674 cm−1 is attributed to the Zn–O vibrations of the ZnCo2O4 electrode material. The peaks located at 1061 cm−1 correspond to the C–H and C–N vibration of PPy.28 The strong peak at 3616 cm−1 is attributed to absorbed water. In addition, the peaks at 2357 cm−1 and 2914 cm−1 come from N–H bonds in the aromatic amines. In the FITR spectra of the ZnCo2O4@PPy materials, all of the peaks are present, which proves that PPy is successfully coated on the surface of the ZnCo2O4 samples.
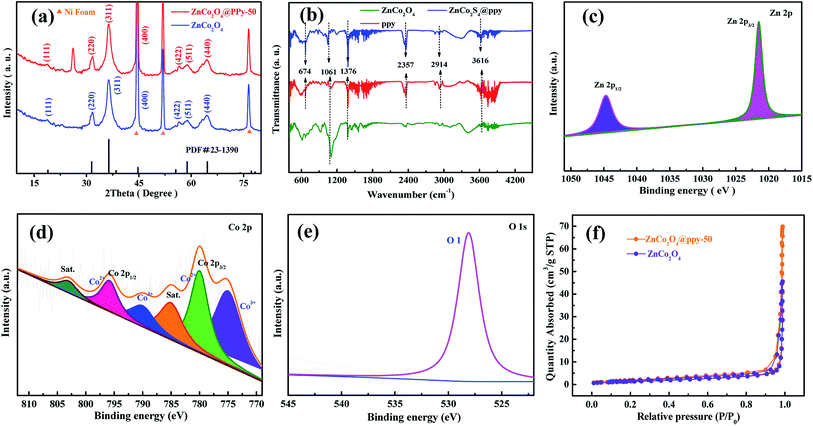 | ||
| Fig. 2 (a) XRD patterns of the as-produced samples (b) FTIR spectra (c) Zn 2p XPS spectra of the composites (d) Co 2p (e) O 1s (f) N2 adsorption/desorption isotherms. | ||
The XPS pattern of the ZnCo2O4@PPy-50 material was measured to comprehend the surface chemical states. The C 1s XPS pattern is shown in Fig. S1.† In Fig. 2c, the Zn 2p spectrum exhibits two strong peaks at 1044.60 eV and 1021.60 eV, which are attributed to the binding energy of Zn 2p1/2 and Zn 2p3/2, respectively, indicating the existence of Zn2+ in the ZnCo2O4@PPy-50 composite materials. In Fig. 2d, the Co 2p spectrum contains four spin–orbit components, Co 2p3/2 and Co 2p1/2 and two satellites. The four peaks are at 774.9 eV, 780.1 eV, 790.2 eV, and 795.8 eV, respectively. The strongest splitting peak value is about 15.3 eV, which is attributed to the existence of Co3+ and Co2+.29 As shown in Fig. 2e, the O 1s XPS spectrum of the composite materials consist of the O 1s peak (528.1 eV), which is attributed to the metal–oxygen bonds. Fig. 2f exhibits the N2 isotherms of the ZnCo2O4 and ZnCo2O4@PPy-50 samples. The IV isotherm (ZnCo2O4@PPy-50 electrode material) is presented at a relative pressure between 0 and 1.0, which indicates the presence of the mesoporous structure. The BET surface areas of the ZnCo2O4 and ZnCo2O4@PPy-50 samples are calculated to be 45 and 69 m2 g−1, respectively. It can be found that the ZnCo2O4@PPy-50 electrodes possess a larger surface area than the ZnCo2O4 electrode materials.
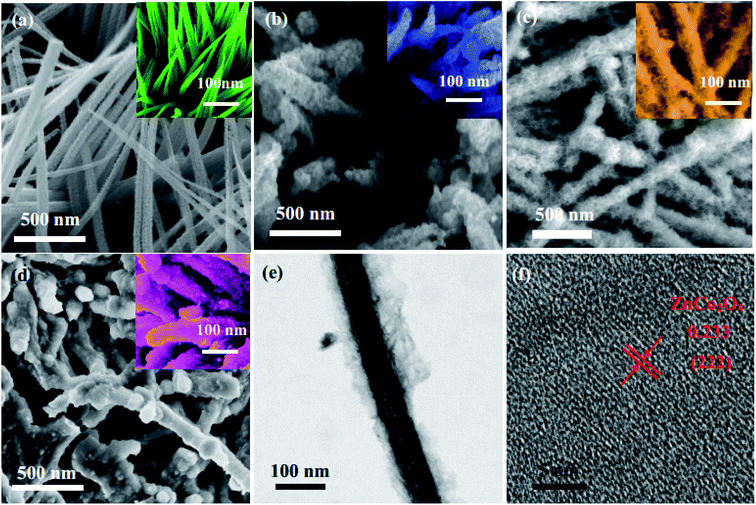
The morphologies of the electrode materials are observed by SEM. As shown in Fig. 3a, the ZnCo2O4 samples possess wire-like shapes. From the high magnification SEM images, the diameter of the nanowires is approximately 20 nm. In Fig. 3b, it can be seen that PPy is covered on the surface of the ZnCo2O4 electrode materials. After an electrochemical deposition process, the morphologies of the ZnCo2O4@PPy-20 samples are more rough and uneven than the ZnCo2O4 products. The average diameter of ZnCo2O4@PPy-50 is around 25 nm (Fig. 3c), which leads to a large surface area with an extensive number of active sites. This structure is more conducive to the transmission of electrons. The structural information of the ZnCo2O4@PPy-50 samples was further obtained by TEM (Fig. 3e and f). It is consistent with the XRD results. As shown in Fig. 3f, the ultra-thin PPy is evenly coated on the surface of the ZnCo2O4 samples. The HRTEM image (Fig. 2i) exhibits interplanar spacings of 0.233 nm, corresponding to the (222) plane of the cubic ZnCo2O4 structures.
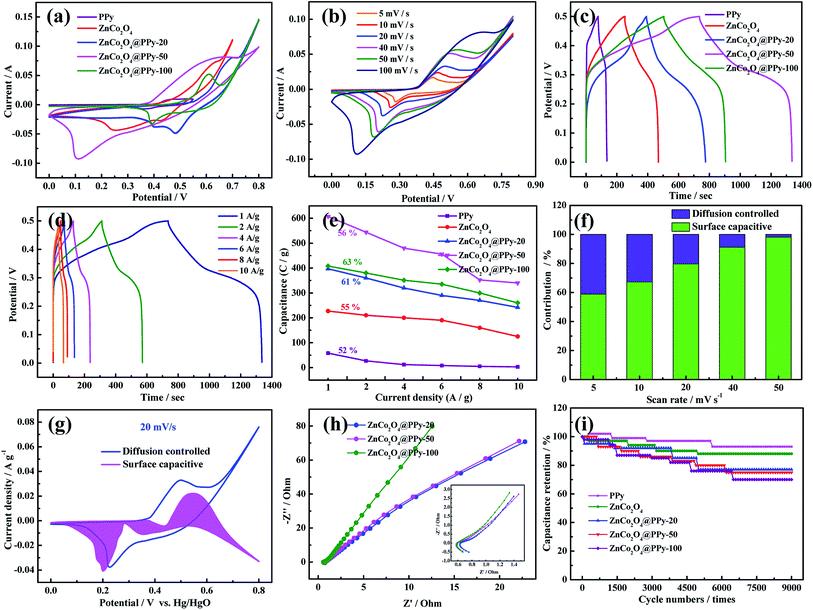
In order to compare the electrochemical performance of the three-electrode materials, CV, GCD, and EIS curves were measured in a 3.0 M KOH electrolyte using a standard three-electrode system with a Pt foil counter electrode, a Hg/HgO reference electrode, and the as-prepared samples as the working electrode. For comparison, the electrode materials were tested under the same conditions. In Fig. 4a, the ZnCo2O4@PPy-50 electrode materials show a larger area than the other four-electrode materials at a scan rate of 100 mV s−1, suggesting that synergy can significantly increase the capacitance of the electrode.30 As seen in Fig. 4b, the CV curves possess obvious redox peaks. As the sweep speed increases, the area of the curve increases, demonstrating that the electrode materials possess good reversibility. In Fig. 4c, the ZnCo2O4@PPy-50 electrode exhibits a longer discharge time than the other four materials. The specific capacitances of the composite samples are significantly increased, reaching 605 C g−1 at 1 A g−1. Fig. 4d presents the GCD curves of the ZnCo2O4@PPy-50 electrodes. The discharge time of the samples decreases with increasing current density.
We calculated the areal specific capacitance of the test electrodes at different current densities from 1 A g−1 to 10 A g−1 to evaluate their charge/discharge rate performance, as shown in Fig. 4e. It can be perceived that the ZnCo2O4@PPy-50 electrode still maintains 56% of the capacitance value at 10 A g−1. The CV curve is an efficient means to study the reaction kinetics of the as-prepared materials:31
| i = k1v + k2v1/2 | (4) |
The k1 and k2 values can be obtained via the CV curves. The surface capacitive and diffusion-controlled contributions to the total stored charges of the electrodes are shown in Fig. 4f. For the as-prepared electrode material, the diffusion controlled contribution gradually reduces with increasing scan rate, resulting in a decrease in the total capacitance at high scan rates. The capacitive contribution of the ZnCo2O4@PPy-50 electrode material (Fig. 4g) is 79% at a scan rate of 20 mV s−1. The capacitive and diffusion contributions at a scan rate of 5, 10, 40, and 50 mV s−1 are shown in Fig. S2.† The capacitive contribution of the sample is 98% at a scan rate of 50 mV s−1. The EIS analysis of the as-prepared products is shown in Fig. 4h and the ZnCo2O4@PPy-50 electrode material exhibits the smallest semicircle and maximum slope when compared with the ZnCo2O4@PPy-20 and ZnCo2O4@PPy-100 materials, revealing the faster diffusion rate of the electrons and better conductivity. The intercepts of the ZnCo2O4@PPy-20, ZnCo2O4@PPy-50, and ZnCo2O4@PPy-100 electrode materials with the X axis are 0.64, 0.52, and 0.59 Ω, respectively. This means that the ZnCo2O4@PPy-50 electrode material possesses the lowest internal resistance. Fig. 4i presents the capacitance retention of the as-prepared samples as a function of the cycle number at 10 A g−1. The capacitance retention of the ZnCo2O4@PPy-50 electrode material is 93.5%.
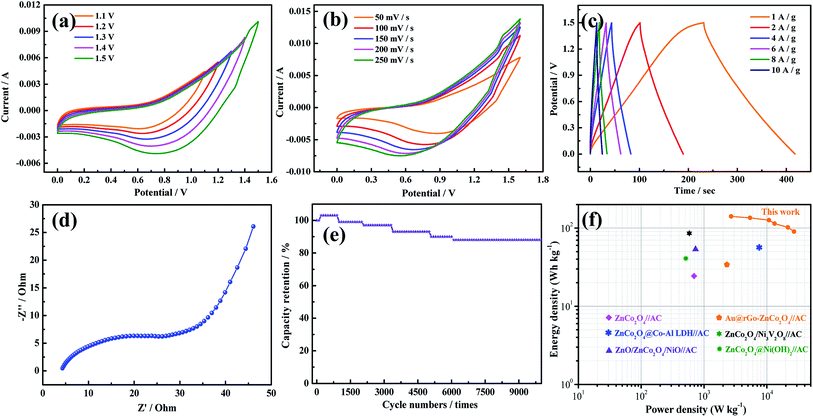
To evaluate the efficiency of the asymmetric supercapacitors (ASCs), the CV curves of the ASCs at different voltage windows were obtained and show that the ZnCo2O4@PPy-50//AC ASC has a high operating cell voltage of up to 1.5 V (Fig. 5a). The curve was measured at the scan rate of 100 mV s−1. Fig. 5b shows the CV curves at different scan rates from 5 mV s−1 to 100 mV s−1. With an increasing sweep rate, the shape of the curve remains unchanged, indicating that the device displays an ideal capacitance performance. To further study the capacitive behavior of the devices, the discharge curves between 0 and 1.5 V at different current densities are illustrated in Fig. 5c. The discharge time of the device is 188 s, indicating that the ZnCo2O4@PPy-50//AC device exhibits superior electrochemical performance. The EIS analyses of the devices are shown in Fig. 5d. It is obviously found that the device shows a low bulk resistance and the internal resistance of the device is 0.65 Ω. Fig. 5e shows that the capacitance retention of the device is 88.1% after 10![[thin space (1/6-em)]](https://www.rsc.org/images/entities/char_2009.gif) 000 cycles. Based on the discharge curves at different current densities, the power densities and energy densities of the device were calculated using Ragone plots (Fig. 5f). The ASC delivers a maximum energy density of 141.3 W h kg−1 at a power density of 2700.5 W kg−1, which is higher than that of the other reported devices.21,24,32–35
000 cycles. Based on the discharge curves at different current densities, the power densities and energy densities of the device were calculated using Ragone plots (Fig. 5f). The ASC delivers a maximum energy density of 141.3 W h kg−1 at a power density of 2700.5 W kg−1, which is higher than that of the other reported devices.21,24,32–35
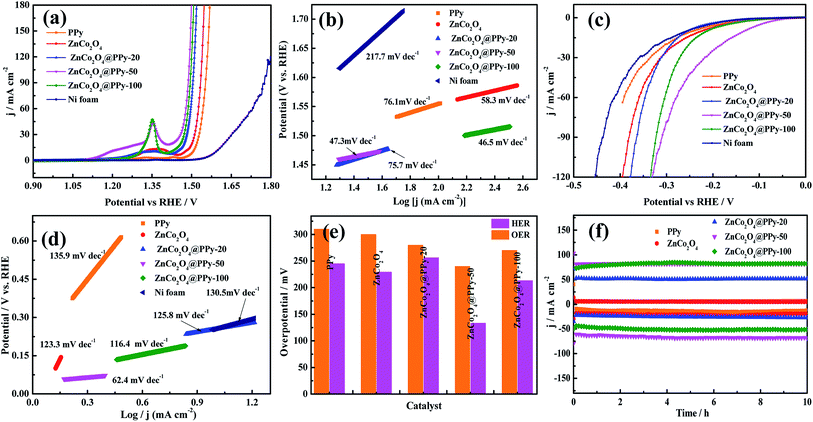
The OER performance and HER activity of the as-prepared samples were tested using a three-electrode system in a 1.0 M KOH electrolyte. Before the measurement, the electrode materials were activated 50 times through the cyclic voltammetric curves. The OER performance was studied by LSV curves at a scan rate of 1 mV s−1. As shown in Fig. 6a, in comparison with Ni foam, PPy, ZnCo2O4, ZnCo2O4@PPy-20, and ZnCo2O4@PPy-100, the LSV curves of the ZnCo2O4@PPy-50 (η50 = 240 mV) sample possess the highest current under a certain applied voltage. To further research the OER performance, Tafel slopes were obtained and are exhibited in Fig. 6b. The values of the Tafel slopes were calculated from the LSV curves. The Tafel slope of ZnCo2O4@PPy-50 is 46.5 mV dec−1, which is smaller than that of Ni foam (217.7 mV dec−1), PPy (76.1 mV dec−1), ZnCo2O4 (58.3 mV dec−1), ZnCo2O4@PPy-20 (75.7 mV dec−1), and ZnCo2O4@PPy-100 materials (47.3 mV dec−1). The smaller value demonstrates that ZnCo2O4@PPy-50 possesses a rapid OER reaction rate.
The HER activity was measured for the same device. The LSV curves (Fig. 6c) were obtained at a scan rate of 5 mV s−1. The ZnCo2O4@PPy-50 material exhibits lowest overpotential (η10 = 133 mV) at a current density of 10 mA cm−2. As we can observe in Fig. 6d, the value of 62.4 mV dec−1 for ZnCo2O4@PPy-50 is much lower than 130.5 mV dec−1 for the Ni foam, 135.9 mV dec−1 for PPy, 123.3 mV dec−1 for ZnCo2O4, 125.8 mV dec−1 for ZnCo2O4@PPy-20, and 116.4 mV dec−1 for ZnCo2O4@PPy-100. A lower Tafel slope is more favorable for HER performance. In Fig. 6e, the overpotentials of the as-prepared samples are compared in detail. ZnCo2O4@PPy-50 shows the smallest overpotential (OER and HER).
It is important for catalysts to have excellent stability for practical application. The ZnCo2O4@PPy-50 electrode materials show outstanding stability with no significant decrease after 10 h. As shown in Fig. 7a, the voltage of the overall water splitting electrode, ZnCo2O4@PPy-50, is 1.61 V at the current density of 50 mA cm−2. In Fig. 7b, the current density of the ZnCo2O4@PPy-50 sample exhibits a steady trend after 10 h.
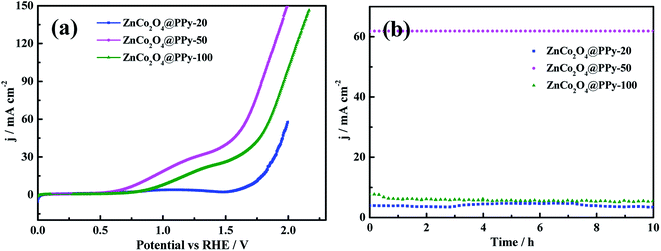 | ||
| Fig. 7 (a) Polarization curves of the overall water splitting at a scan rate of 5 mV s−1 (b) durability of the electrode at a current density of 10 mA cm−2. | ||
Combined with the electrochemical reaction mechanism (Fig. 8), the excellent electrochemical performance can be attributed to the following: first, the direct growth of ZnCo2O4 nanowires on Ni foam benefits from sufficient contact between the electrode and current collector. Moreover, the PPy shell can provide high electrical conductivity pathways and accelerate the electron transportation speed. Finally, the synergetic effect between ZnCo2O4 and PPy also improves the cycling performance of the electrode materials.
4. Conclusion
In summary, ZnCo2O4@PPy-50 electrode material was successfully grown on Ni foam, which possesses a specific capacitance of 605 C g−1 at a current density of 1 A g−1. In addition, the as-prepared samples retain 93.5% capacitance after 7000 cycles. The ASC possessed an energy density of 141.3 W h kg−1 at a power density of 2700.5 W kg−1 and capacity retention of 88.1% after 10![[thin space (1/6-em)]](https://www.rsc.org/images/entities/char_2009.gif) 000 cycles. ZnCo2O4@PPy-50 exhibited excellent OER performance and outstanding HER performance in alkaline media. As an advanced bifunctional electrocatalyst for overall water splitting, a voltage of 1.61 V at a current density of 50 mA cm−2 outperforms the majority of the noble-metal-free electrocatalysts.
000 cycles. ZnCo2O4@PPy-50 exhibited excellent OER performance and outstanding HER performance in alkaline media. As an advanced bifunctional electrocatalyst for overall water splitting, a voltage of 1.61 V at a current density of 50 mA cm−2 outperforms the majority of the noble-metal-free electrocatalysts.
Conflicts of interest
The authors declare no conflict of interest.Acknowledgements
This work was supported by the Natural Science Foundation of Liaoning Province (No: 2019-ZD-0253), Liaoning Revitalization Talents Program (No. XLYC1902095).References
- G. Q. Zhang, H. B. Wu, H. E. Hoster, M. B. Chan-Park and X. W. Lou, Energy Environ. Sci., 2012, 5, 9453–9456 RSC.
- T. Park, Y. Jang, J. W. Park, H. Kim and S. J. Kim, RSC Adv., 2020, 10, 14007–14012 RSC.
- D. P. Zhao, M. Z. Dai, Y. Zhao, H. Q. Liu, Y. Liu and X. Wu, Nano Energy, 2020, 72, 104715 CrossRef CAS.
- X. He, X. Y. Wang, B. N. Sun, J. N. Wan, Y. Wang, D. He, H. Suo and C. Zhao, RSC Adv., 2020, 10, 13437–13441 RSC.
- Y. G. Zhu, Y. Wang, Y. M. Shi, J. I. Wang and H. Y. Yang, Nanoscale, 2014, 6, 15020–15028 RSC.
- S. H. Zhao, X. B. Yu, H. M. Chen, K. Tao, Y. P. Hu and L. Han, RSC Adv., 2020, 10, 13922–13928 RSC.
- J. R. Miller and P. Simon, Electrochemical capacitors for energy management, Science, 2008, 321, 651–652 CrossRef CAS PubMed.
- M. Z. Dai, D. P. Zhao, H. Q. Liu, Y. L. Tong, P. F. Hu and X. Wu, Mater. Today Energy, 2020, 16, 100412 CrossRef.
- K. Deori, S. K. Ujjain, R. K. Sharma and S. Deka, ACS Appl. Mater. Interfaces, 2013, 5, 10665–10672 CrossRef CAS PubMed.
- D. P. Zhao, M. Z. Dai, H. Q. Liu, K. F. Chen, X. F. Zhu, D. F. Xue, X. Wu and J. P. Liu, Adv. Mater. Interfaces, 2019, 5, 1901308 CrossRef.
- Q. F. Wang, X. F. Wang, J. Xu, X. O. Yang, X. J. Hou, D. Chen, R. M. Wang and G. Z. Shen, Nano energy, 2014, 8, 44–51 CrossRef CAS.
- H. C. Chen, J. J. Jiang, L. Zhang, D. D. Xia, Y. D. Zhao, D. Q. Guo, T. Qi and H. Z. Wan, J. Power Sources, 2014, 254, 249–257 CrossRef CAS.
- Y. L. Tong, D. L. Qi, B. Q. Chi and W. Q. Zhang, Sci. Adv. Mater., 2019, 11, 338–344 CrossRef CAS.
- H. S. Jadhav, A. Roy, W. J. Chung and J. G. Seo, Electrochim. Acta, 2017, 246, 941–950 CrossRef CAS.
- X. Du, Z. Yang, Y. Li, Y. Gong and M. Zhao, J. Mater. Chem. A, 2018, 6, 6938–6946 RSC.
- Y. L. Tong, B. Q. Chi, D. L. Qi and X. Y. Liu, Sci. Adv. Mater., 2019, 11, 1087–1092 CrossRef CAS.
- B. L. Ellis, P. Knauth and T. Djenizian, Adv. Mater., 2014, 26, 3368–3397 CrossRef CAS PubMed.
- L. Xing, Y. D. Dong and X. Wu, RSC Adv., 2018, 8, 28172 RSC.
- Y. L. Tong, X. Y. Cheng, X. Y. Liu, D. L. Qi, B. Q. Chi and Y. F. Wang, J. Nanoelectron. Optoelectron., 2019, 14, 1–6 CrossRef CAS.
- T. Zhai, L. Wan, S. Sun, Q. Chen, J. Sun, Q. Xia and H. Xia, Adv. Mater., 2017, 29, 1604167 CrossRef PubMed.
- J. Bhagwan, S. K. Hussain and J. S. Yu, J. Alloys Compd., 2020, 815, 152456 CrossRef CAS.
- Y. A. Kumar, K. D. Kumar and H. J. Kim, Electrochim. Acta, 2020, 330, 135261 CrossRef CAS.
- R. Shi, Y. Y. Zhang and Z. H. Wang, J. Alloys Compd., 2019, 810, 151879 CrossRef CAS.
- S. J. Pail, D. P. Dubal and D. W. Lee, Chem. Eng. J., 2020, 379, 122211 CrossRef.
- G. P. Kamble, A. A. Kashale, S. S. Dhanayat, S. S. Kolekar and A. V. Ghule, Mater. Sci., 2019, 42, 272 Search PubMed.
- W. Su, R. Miao, B. R. Tao and F. J. Miao, Ionics, 2019, 25, 5419–5427 CrossRef CAS.
- T. W. Kim, M. A. Woo, M. Regis and K. S. Choi, J. Phys. Chem. Lett., 2014, 5, 2370 CrossRef CAS PubMed.
- W. D. He, C. G. Wang, H. Q. Li, X. L. Deng, X. J. Xu and T. Y. Zhai, Adv. Energy Mater., 2017, 7, 1700983 CrossRef.
- J. W. Xiao, L. Wan, S. H. Yang, F. Xiao and S. Wang, Nano Lett., 2014, 14, 831–838 CrossRef CAS PubMed.
- H. Yi, H. W. Wang, Y. T. Jing, T. Q. Peng and X. F. Wang, J. Power Sources, 2015, 285, 281–290 CrossRef CAS.
- M. Sathiya, A. S. Prakash, K. Ramesha, J.-M. Tarascon and A. K. Shukla, J. Am. Chem. Soc., 2011, 133, 16291–16299 CrossRef CAS PubMed.
- X. Bai, D. X. Cao and H. G. Zhang, Ceram. Int., 2019, 45, 14943–14952 CrossRef CAS.
- Y. Huang, X. S. Feng, C. Li, Y. Li, X. F. Chen, X. G. Gao, C. Chen, Z. X. Guang and P. B. Liu, Ceram. Int., 2019, 45, 15451–15457 CrossRef CAS.
- X. W. Dong, Y. Y. Zhang, W. J. Wang and R. Zhao, J. Alloys Compd., 2017, 729, 716–723 CrossRef CAS.
- X. Han, Y. J. Yang, J. J. Zhou, Q. X. Ma, K. Tao and L. Han, Chem.–Eur. J., 2018, 24, 18106–18114 CrossRef CAS PubMed.
Footnote |
| † Electronic supplementary information (ESI) available. See DOI: 10.1039/d0ra05177b |
| This journal is © The Royal Society of Chemistry 2020 |

