 Open Access Article
New amino group functionalized porous carbon for strong chelation ability towards toxic heavy metals†
Zakaria Anfar *abc,
Abdallah Amedlousd,
Mohammed Majdoub
 d,
Abdellah Ait El Fakir
 ab,
Mohamed Zbair
 e,
Hassan Ait Ahsaine
 fg,
Amane Jada*bc and
Noureddine El Alema
aLaboratory of Materials & Environment (LME), Ibn Zohr University, Agadir, 80000, Morocco. E-mail: zakaria.anfar@uha.fr
bInstitute of Materials Science of Mulhouse (IS2M-CNRS), Haute Alsace University (UHA), Mulhouse, 68100, France. E-mail: amane.jada@uha.fr
cStrasbourg University, Strasbourg, 67081, France
dLaboratory of Materials, Catalysis & Valorization of Natural Resources, Hassan II University, Casablanca, 20650, Morocco
eLaboratory of Catalysis & Materials Corrosion. Chouaib Doukkali University, El Jadida, 24000, Morocco
fChemical and Biochemical Sciences (CBS), Mohamed VI Polytechnic University, Lot 660-Hay Moulay Rachid, Benguerir, Morocco
gLaboratoire de Chimie Appliquée des Matériaux, Centre des Sciences des Matériaux, Faculty of Sciences, Mohammed V University, Rabat, Morocco
First published on 21st August 2020
Abstract
Herein, ethylenediamine functionalized porous carbon (PC-ED/1.5) was synthesized, then characterized by various methods and finally used as a functional material for Cu(II) and Pb(II) ion removal from water. XPS revealed the presence of numerous functionalities within the surface of PC including –NH and C–N–C groups. Furthermore, SBET, RS, XRD and FTIR analyses confirmed the changes implemented on the PC surface. Thereafter, a systematic study was implemented to analyze the interactions of the PC-ED/1.5 surface with Cu(II) and Pb(II) heavy metal ions. Hence, adsorption experiments showed that the PC-ED/1.5 exhibits maximum adsorption capacities of 123.45 mg g−1 and 140.84 mg g−1 for Cu(II) and Pb(II), respectively. Moreover, in situ electrostatic interactions occurring between the divalent cation and the PC-ED/1.5 functional groups was investigated. The mechanism involves chelation processes, electrostatic interactions and mechanical trapping of the metal ions in the adsorbent pores. Interestingly, a synergistic effect of the pores and surface active sites was observed. Finally, by using alginate bio-polymer we prepared membrane films of PC-ED/1.5 which showed long-term stability, regeneration capabilities and high mass recovery.
1. Introduction
Because they are persistent, bio accumulative and very toxic, heavy metal ions in aqueous solution have always been major concerns of the scientific community.1 For example, excessive doses of Cu(II) can cause serious problems to humans such as anemia, hypoglycemia, stomach and intestinal distress, and even kidney damage and eventual death.2 In addition, Pb(II) ions even at very low amounts (ppb) can directly or indirectly cause harm to humans (the limit set by the World Health Organization (WHO) for Pb(II) ions in surface and potable water is less than 0.01 mg l−1).3 Therefore, heavy metal ion bio-accumulation and concentration throughout the food chain can cause not only health problems in both humans and animals, but also environmental problems and complications.4 With the rapid development of industry, in the past 20 years substantial research has been conducted on the removal of these metal ions from aqueous solution.5,6 Thus, it is necessary to develop and design effective methods and/or materials suited for heavy metal ion removal from polluted water. Recently, adsorption processes have been widely used to treat these problems, due to the fact that adsorption is a promising technology with easy handling operation and high efficiency.7,8 It should be noted that heavy metal ion removal efficiency based on the adsorption process depends mainly on the nature of the material and its adsorption properties.9Thus, different variety of materials ranging from organic, inorganic, polymer and composites have been used extensively to remove harmful heavy metal ions.10 However, these materials might have some drawbacks affecting hence the physical interactions occurring on their surfaces with the pollutants in the aqueous medium. For instance, the low reusability and the chemical stability can hinder the adsorption efficiency of a given material. Therefore, designing adsorbents having good chemical stability, high functionalities and superior reusability, are highly desired for adsorptive removal of heavy metal ions. Owing to their tunable pore structure and high specific surface area,11 porous carbon, as a branch of emerging meso/micro-porous materials, have shown excellent potential in the field of gas and liquid adsorption.12 Specifically, porous carbon have been employed as remarkable adsorbents for removal of heavy metal ions in recent years.13,14 Sorption using porous carbon is mainly governed by physisorption derived from the adsorption potential of the pore structure and abundant oxygen-containing groups on the surface.14 The functionalized carbon-based adsorbents (e.g. grafting organic species with specific functional groups containing nitrogen on porous carbon surface) have become more relevant due to several advantages, such as higher adsorption capacities and lower energy requirements during the regeneration process.
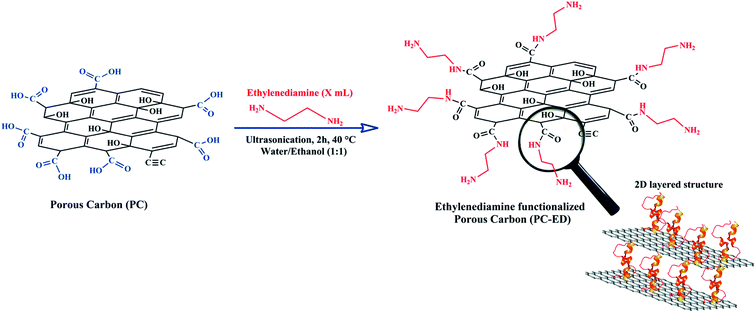
Functionalization with chelating agents of amine groups can lead to a better selectivity of heavy metal ions having cationic nature, as this has been recently demonstrated for the elimination of toxic heavy metal ions.9 Despite these extensive attempts in carbon-based adsorbents surface modification, many obstacles remain that hinder their large-scale application and commercial use. Thus, despite the fact that these methods have many benefits, they mostly suffer from numerous shortcomings such as: (1) multiple steps requirement, (2) the use of large amounts of organic solvents, (3) low productivity of functionalized carbon-based adsorbents, and (4) the need of toxic and non-sustainable reagents. Today, all the research projects are increasingly focusing on materials that emerge from green technologies using safe chemical reagents. As a result, it is crucial to propose promising and cost-effective alternatives to the above-mentioned approaches to prepare surface modified carbon-based adsorbents such as organic solvent-free reactions. Yet, the challenge is to carry the procedure that allows only surface modification of the carbon-based adsorbent, while preserving its intrinsic morphology (Scheme 1).
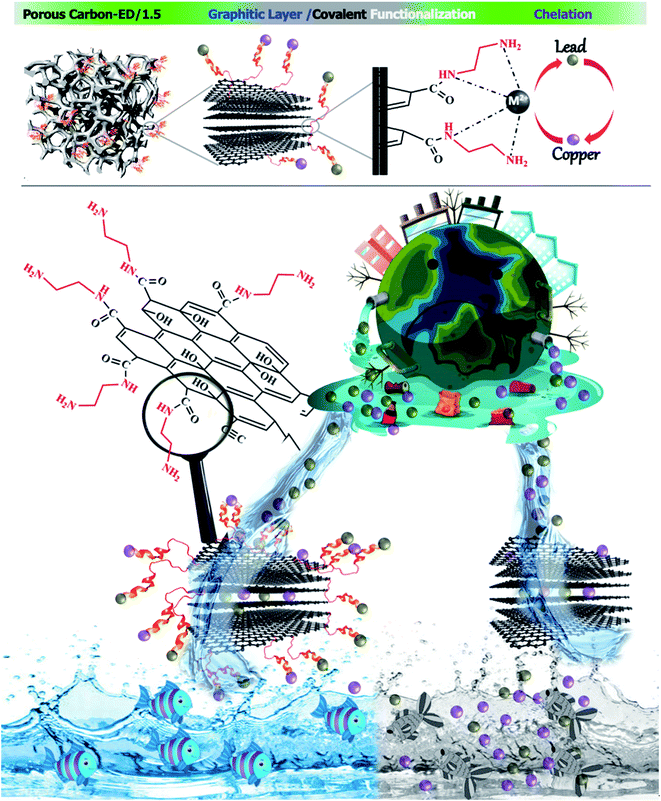 | ||
| Scheme 1 NH functions in situ grafted into COOH porous carbon groups for strong chelation ability towards toxic ions metals pollutants. New generation of wastewater treatment processes. | ||
Aside from the porous carbon functionalization by amino-groups to design advanced adsorbents with high adsorption capacity, selectivity and regeneration, the elucidation of the involved adsorption mechanism and the surface/interface reactions can be a challenge. Therefore, many efforts have been devoted to design amine-functionalized adsorbents with excellent functionality for metal ions removal. However, unveiling the adsorption mechanism onto these materials remains a great challenge due to the lack of information at the in situ level. Considering that the adsorption of a given element modifies the size of the particles and its surface charge,15 the study of the solid/liquid interface can be the best solution to solve this problem. Accordingly, powerful surface and interface characterization techniques in aqueous dispersions must be used. In this regard, the assessment of the Streaming Induced Potential (SIP) and the size of the adsorbent particle's variation with the adsorbate concentration in aqueous dispersions can be used to unravel the interface/surface phenomena. The SIP can be measured using a potential measuring device (PCD, Müteck instrument) by monitoring the titration curve of adsorbate–adsorbent, which allows the adsorbent surface potential measurements.16,17 In addition, the adsorbent particle size in aqueous solution can be measured by Dynamic Light Scattering (DLS). According to this method, the average particle size is calculated from the measurement of the sample diffusion coefficient by photon correlation spectroscopy.18
The overall aim of the present work is to design new porous carbon adsorbent functionalized with ethylenediamine, and to use it as a potential adsorbent for Cu(II) and Pb(II) removal from contaminated water. Structural characterizations of the designed adsorbent were then performed to elucidate the structure-to-property relation. The metal ions removal performance from water of the prepared materials has been optimized by using statistical analysis based on the response surface methodology coupled with composite design. Finally, by gathering several experimental tests, the mechanism at the solid–liquid interface has been unraveled using in situ electrostatic interaction and dynamic light scattering.
2. Methods and materials
2.1. Protocol of preparation of PC-ED/1.5
In this work, easy and effective functionalization approach for grafting ethylenediamine on porous carbon (PC) surface has been adapted (Scheme 2). The modification of PC by ethylenediamine was done under very mild temperature conditions (4 h/40 °C). Briefly, a suspension of the PC was prepared: 300 mg of the PC were dispersed by sonication in 50 ml of distilled water for 1.5 h at 25 °C. Then, ethylenediamine was added dropwise to the suspension of the PC under sonication. The reaction lasted 2 hours at temperature of 40 °C. The resulting mixture was separated by vacuum filtration using Buchner funnel filter paper with porosity of 0.45 μm and thoroughly washed with a 1![[thin space (1/6-em)]](https://www.rsc.org/images/entities/char_2009.gif) :
:![[thin space (1/6-em)]](https://www.rsc.org/images/entities/char_2009.gif) 1 mixture of ethanol and water. The obtained solid was then dried in a vacuum oven at 25 °C for 12 h. The ethylenediamine functionalized PC was labelled as PC-ED/x, where x represented the amount (in ml) of ethylenediamine when preparing the PC-ED sample. Note that x = 1.5 ml was chosen to be the optimal volume used to functionalize the PC surface (Fig. S1†), based on the adsorption rate of Cu(II) and Pb(II).
1 mixture of ethanol and water. The obtained solid was then dried in a vacuum oven at 25 °C for 12 h. The ethylenediamine functionalized PC was labelled as PC-ED/x, where x represented the amount (in ml) of ethylenediamine when preparing the PC-ED sample. Note that x = 1.5 ml was chosen to be the optimal volume used to functionalize the PC surface (Fig. S1†), based on the adsorption rate of Cu(II) and Pb(II).
2.2. Batch adsorption experiments
The adsorption of Cu(II) and Pb(II) were performed using batch system. Thus, 100 ml of Cu(II) or Pb(II) aqueous solutions were adsorbed onto a known mass of PC-ED/1.5, under various experimental parameters such as pH (2–10), contact time (0–120 min), temperature (25–45 °C) and initial adsorbate concentration (10–140 mg l−1). After a suitable time, a sample portion was withdrawn from the beakers and filtered. The impacts of competing cations on Pb(II) and Cu(II) adsorption were evaluated in the presence of NaCl, KCl, CaCl2, and MgCl2 at certain concentrations. The concentration of Cu(II) and Pb(II) were determined using absorption atomic spectroscopy (AAS 7000 Shimadzu) equipped with furnace detection at pH 2 using HNO3. Table S1,† highlights the mathematical models used in this work to fit the data.3. Results and discussions
3.1. Characterization of PC-ED/1.5
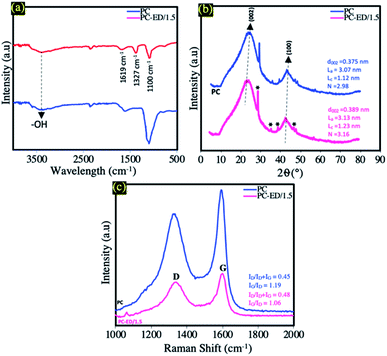
FTIR spectra of pure PC and PC-ED/1.5 samples are shown in Fig. 1a. As can be seen in this figure, the FTIR spectra show centered bands in the range of 3450 cm−1 which are attributed to O–H stretching vibration groups for both samples (PC and PC-ED/1.5). In the case of PC, a band around 1630 cm−1 is observed and attributed to C![[double bond, length as m-dash]](https://www.rsc.org/images/entities/char_e001.gif) O elongation and/or C
O elongation and/or C![[double bond, length as m-dash]](https://www.rsc.org/images/entities/char_e001.gif) O and C
O and C![[double bond, length as m-dash]](https://www.rsc.org/images/entities/char_e001.gif) C aromatic.19,20 The band around 1099 cm−1 attributed to the C–O and/or C–O–H vibrations of the stretching in carboxylic groups.19,20 For PC-ED/1.5 sample, a dramatic decrease in the intensities of some peaks are observed as compared with pure PC. Besides, a new peak at 1327 cm−1 (C–N stretching vibrations) appeared in this sample indicated the formation of PC-ED/1.5.21
C aromatic.19,20 The band around 1099 cm−1 attributed to the C–O and/or C–O–H vibrations of the stretching in carboxylic groups.19,20 For PC-ED/1.5 sample, a dramatic decrease in the intensities of some peaks are observed as compared with pure PC. Besides, a new peak at 1327 cm−1 (C–N stretching vibrations) appeared in this sample indicated the formation of PC-ED/1.5.21
The XRD patterns of the PC and PC-ED/1.5 are presented in Fig. 1b, the XRD data in Fig. 1b highlights the presence of tow broad peaks around 22° and 43°, attributed, respectively, to the reticular planes (002) and (100) of typical disordered carbon.22,23 The peak observed at ∼29° is attributed to the most intense peak of calcium carbonate diffractogram (29.32°) or to the phenomenon of the disintegration of organic matter (OM) during the process of pretreatment with sulfuric acid and the formation of graphitic crystals and oxide layers.24,25 Other observed peaks in Fig. 1b may be attributed to the impurities coming from different agents used such as H2SO4, NaOH and HCl or to the nature of the raw material. This result is very interesting, which clearly demonstrates the formation of amorphous carbon after the biological, chemical and thermal treatments. Therefore, the comparison between PC and PC-ED/1.5 shows that the (002) peak shifts to lower diffraction angle (∼22, 92°) after the grafting of ethylenediamine on PC surface. Moreover, the XRD data indicate that the average interlayer spacing d002 increases after the functionalization reaction. Hence, the calculated d002 values are 0.375 and 0.389 nm, for the PC and the PC-ED/1.5, respectively. Such d002 increase can be ascribed to the grafting of ethylenediamine into the PC graphitic layers. In addition, XRD data was used for the estimation of the average lateral length (La) and thickness (Lc) of the graphite-like segments (Fig. 1b). The results show that the number (N) of the graphene sheets stacked (N = Lc/d002) was essentially depending on the carbon structure. Therefore, the N number was very important in the case where the PC was not modified by ethylenediamine.
Raman spectroscopy is an appropriate tool to identify the key changes during the chemical functionalization of PC by ED molecules. According to Fig. 1c, the two samples exhibited similar Raman spectrum in terms of shape and position of Raman peaks. The first peak located at around 1355 cm−1 was attributed to the extent of disorder in graphitic domains (D mode).26 Such disorder results from the breathing mode of κ-point photons of A1g symmetry, while the second peak observed at about 1604 cm−1 was assigned to the symmetric stretching of the graphitic sp2 carbon (G mode), due to the first order scattering of the E2g phonon of sp2 carbon atoms.27,28 The ordering degree (IG/ID) and the ratio of defects along the graphene sheets (ID/ID + IG) were used to describe the structural changes occurring in the PC based samples. The significant increase in the ratio of defects (ID/ID + IG) upon chemical modification by ED molecules (from 0.45 to 0.48) indicates an increase in the concentration of defects following the grafting process. Moreover, the decrease in the ordering degree (IG/ID) from 1.19 for PC to 1.06 for PC-ED/1.5 gave further supports about the lower level of regularity and the high defect of ED functionalized PC compared to the neat PC.
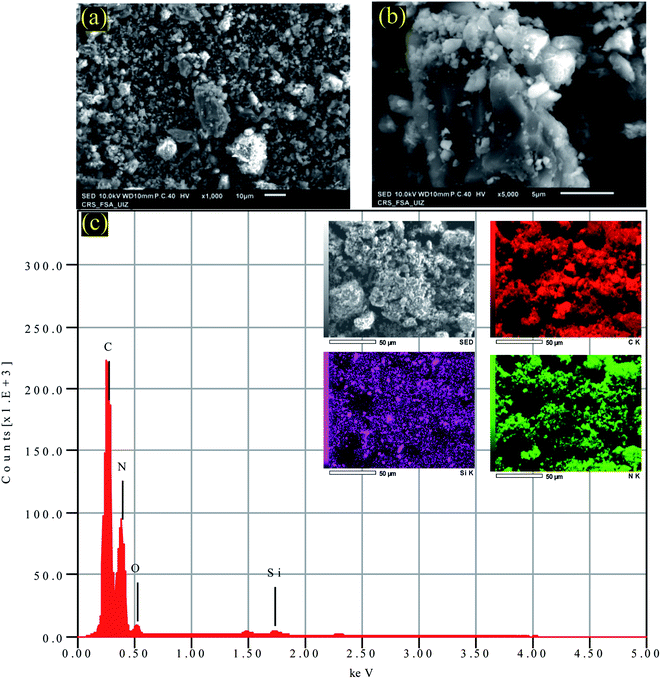
The morphological characteristics of the sample PC-ED/1.5 were assessed by using SEM analysis (Fig. 2a and b). The surface of PC-ED/1.5 was very smooth, graphitic (Fig. 2), with porous structure (Fig. 2b). This additional analysis shows that the PC-ED/1.5 sample consists mainly of carbon, which is compatible with the other results. Besides, the EDS mapping (Fig. 2c) shows the coexistence of C, O, N and other elements, evidencing the formation of carbon-based material. The presence of some impurities on PC-ED/1.5 was also observed as resulting from the nature of the raw material and the chemical compounds used during the synthesis process.
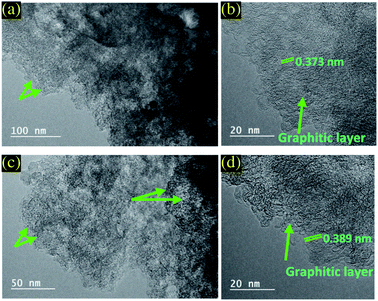
The TEM was used to further characterize the microstructure of PC and PC-ED/1.5 based materials and to highlight the differences observed in XRD and Raman spectroscopies (Fig. 3). The TEM images revealed that both adsorbents displayed a 2D nanosheets structure with wrinkled and folded morphology. Moreover, they showed a rippled, fluffy and transparent appearance. HRTEM was executed to further explore the microstructure of PC and PC-ED/1.5.29 The observations revealed the thicknesses of PC and PC-ED/1.5 flakes ranging from 2 to 4 nm suggesting a monolayer to a multilayer structure as reported in XRD analysis. Therefore, the visible lattice fringes with interlayer distances of 0.373 and 0.387 nm match well to the (002) of graphitic planes for PC and PC-ED/1.5, respectively (Fig. 3b and d).29 The graphitized interlayer distance of PC-ED/1.5 was higher than PC due to the functionalization process resulting in the grafting of amino-functionalized groups in the surface of PC, which allows creating defects and increasing this interlayer distance. These defects can play a very important role in the creation of micro-porosity and act as the adsorption sites of pollutants. Additionally, BET analysis confirms the surface area increase of the PC after the functionalization reaction by ED (Fig. S2†).
The elemental composition of PC-ED/1.5 and the introduction of nitrogen into the carbon frameworks was confirmed by XPS analysis (Fig. 4). It is found that the concentration of N was equal 2.67%, which confirm that N was successfully doped into carbon networks. XPS analyses were carried out on the synthesized PC and PC-ED/1.5 sample, and presented in Fig. 4a. Typically, the strong peak located at 284.85 eV can be allocated to the sp2 bonded carbon atoms (C–C/C![[double bond, length as m-dash]](https://www.rsc.org/images/entities/char_e001.gif) C), and the broad peaks at 286.50 and 290.20 eV to C–O and C
C), and the broad peaks at 286.50 and 290.20 eV to C–O and C![[double bond, length as m-dash]](https://www.rsc.org/images/entities/char_e001.gif) O bonds, which shows the considerable presentation of oxygen-containing functional groups on the PC (Fig. 4b).30 In the case of PC-ED/1.5, the deconvoluted XPS peaks of C 1s showed some oxygen-containing functional groups with the apparition of C–N at 285.68 eV (Fig. 4c).31 The appearance of these peak confirm that the ED functionalization of PC was achieved via reaction with oxygen groups to form C–N bond (Fig. 4c).32 The N 1s can be fitted into two curves with binding energies located at 398.90 and 400.22 eV, which are assigned to –NH and –C–N–C, respectively (Fig. 4d). The appearance of these two peaks confirmed that the ED functionalization of PC was achieved via an amidation reaction between the amine groups (–NH2) of ED and carboxyl groups (–COOH) of PC to form C–N bond. However, we presume that not all the ED molecules were covalently attached to PC via an amidation reaction. We believe that ED molecules can interact with PC surface functional groups by two more possibilities: (1) hydrogen bonding and (2) electrostatic attraction between the oxygen containing functionalities (hydroxyl and carboxyl groups) and the protonated amine moieties via the weak acidic sites of the PC layers. So far, combining the results of FTIR, XRD, RS, TEM and XPS analysis, we can confirm that amide groups have been successfully grafted on to the surface PC specially on the –COOH groups.
O bonds, which shows the considerable presentation of oxygen-containing functional groups on the PC (Fig. 4b).30 In the case of PC-ED/1.5, the deconvoluted XPS peaks of C 1s showed some oxygen-containing functional groups with the apparition of C–N at 285.68 eV (Fig. 4c).31 The appearance of these peak confirm that the ED functionalization of PC was achieved via reaction with oxygen groups to form C–N bond (Fig. 4c).32 The N 1s can be fitted into two curves with binding energies located at 398.90 and 400.22 eV, which are assigned to –NH and –C–N–C, respectively (Fig. 4d). The appearance of these two peaks confirmed that the ED functionalization of PC was achieved via an amidation reaction between the amine groups (–NH2) of ED and carboxyl groups (–COOH) of PC to form C–N bond. However, we presume that not all the ED molecules were covalently attached to PC via an amidation reaction. We believe that ED molecules can interact with PC surface functional groups by two more possibilities: (1) hydrogen bonding and (2) electrostatic attraction between the oxygen containing functionalities (hydroxyl and carboxyl groups) and the protonated amine moieties via the weak acidic sites of the PC layers. So far, combining the results of FTIR, XRD, RS, TEM and XPS analysis, we can confirm that amide groups have been successfully grafted on to the surface PC specially on the –COOH groups.
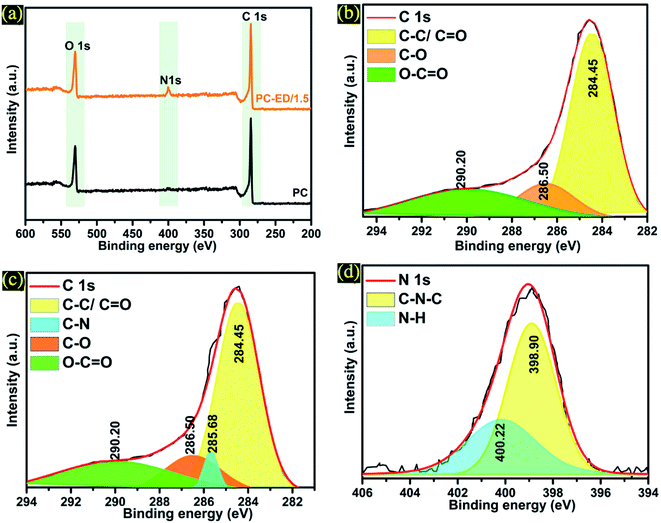 | ||
| Fig. 4 (a) XPS spectra of PC and PC-ED/1.5 (b) C 1s of PC (c) C 1s of PC-ED/1.5 and (d) N 1s of PC-ED/1.5. | ||
3.2. Adsorption of Cu(II) and Pb(II) onto PC-ED/1.5
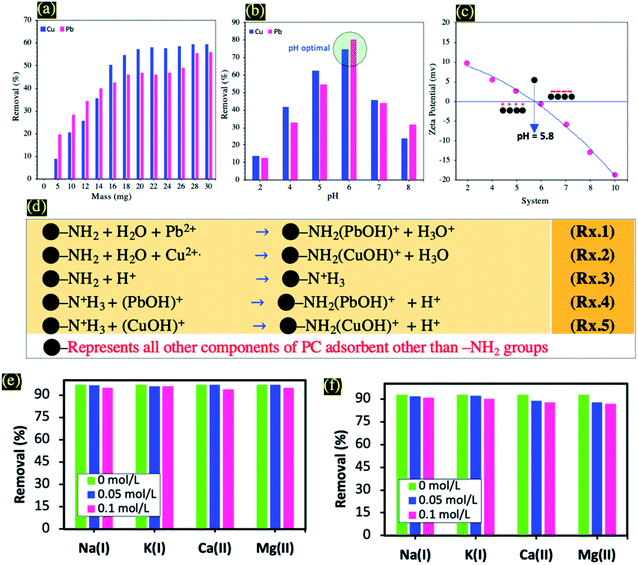
In order to study the effect of the adsorbent dose on the adsorption capacity of Cu(II) and Pb(II), 5 to 30 mg of PC-ED/1.5 were added to 100 ml of Cu(II) and Pb(II) solutions. As can be seen in Fig. 5a, upon increasing the adsorbent dosage, the Cu(II) and Pb(II) removal (%) increased. This suggested that an increase in the amount of adsorbent provided more adsorption sites.33 To ensure the prudent use of materials, the optimal adsorbents dose was determined to be 20 mg.It is well-established that pH is the dominant parameter controlling the adsorption of metal ions.34 In this study, the ability of the PC-ED/1.5 on the adsorption of Pb(II) and Cu(II) was influenced by pH solution. Therefore, pH values ranging from pH = 2 to pH = 8 were investigated (Fig. 5b). It was found that the adsorption is a highly pH-dependent process and a sharp increase of heavy metal ions removal efficiency was observed when the pH value increased from pH = 2 to pH = 6. Such pH increase has led to removal efficiencies increases from about 14% to about 85%, and from about 10% to about 73% in the case of Cu(II) and Pb(II) adsorption onto PC-ED/1.5 and F-PC-ED/1.5, respectively. It is obvious from the above results that the extent of Cu(II) and Pb(II) adsorption onto PC-ED/1.5 at pH < 5.0 was less than that at pH = 6. These results could be attributed to H3O+ ions competing with Cu(II) and Pb(II) for exchange sites on the adsorbent at lower pH.34 To support these explanations, we carried out zeta-potential analysis of PC-ED/1.5 and the data are displayed in Fig. 5c. As can be observed in Fig. 5c, the PC-ED/1.5 surface is more negatively charged at pH > 6 and the pHpzc (point of zero charge) is approximately 5.8. These results show that the surface of the PC-ED/1.5 adsorbent is able to adsorb metal ions at pH > 6 by electrostatic attraction occurring between the positives metal ions and the negatives adsorbent active sites. However, the opposite was observed, a decrease in removal efficiency after pH 6 values has been detected in both systems, which was explained by other phenomena involved in the adsorption of metal ions not only electrostatic interaction, but also precipitation (effect of the distribution of metal ions species in solution). The changes in the solution pH at higher values can affect the distribution of Pb(II) or Cu(II) species in solution. Thus, at pH > 7, Pb(II) species are present as Pb(II), Pb(OH)+, Pb(OH)2, and Pb(OH)3−, and at pH < 7, the main species is Pb(II) and the dissociation of functional groups, promoting or suppressing the adsorption of metal ions surfaces.35 So, at pH > 6 the removal of Pb(II) and Cu(II) not mainly accomplished by adsorption but also via a precipitation process. Considering that before AAS measurements the pH of solution of adsorbed Cu(II) and Pb(II) was adjusted to 2 by using some drops of HNO3 (4 N). This pH allows detection of the adsorbed part of Pb(II) and Cu(II) as resulting from precipitation process. In the other side, at pH < 6 the removal of Pb(II) and Cu(II), is mainly accomplished by adsorption.35 Also, at higher pH the precipitation of metal ions hydroxide as resulting from the low metal ions ion solubility.36,37 Note that the pH values of the metal ions test solutions were measured during the adsorption process. The final pH was higher than the initial pH for all systems, which confirm the attraction between active sites and positive metal ions ion charges (i.e., electrostatic interaction). In addition, the higher pH after adsorption of Cu(II) and Pb(II) indicated an increased activity of OH− and the formation of Cu(OH)2 and Pb(OH)2.34 To avoid precipitation of the metal ions, all adsorption experiments were conducted at pH 6. Previous studies have shown that Cu(II) and Pb(II) start to precipitate (as Pb(OH)2 and Cu(OH)2) when the solution pH is beyond 6.36–38
The functionalization of PC using ED has a very important role in the adsorption process at acidic pH (pH < 6). Therefore, nitrogen atoms exhibit substantial proprieties for the adsorption of Cu(II) and Pb(II) due to the presence of lone pair(s) of electrons responsible for binding of proton/metal ions ion for the formation of metal ions complex.37 These properties have already been reported in other works.37 After addition of metal ions solution, electrons were shared between nitrogen and metal ions and formed metal ions complex (Rxs. 1 and 2 from Fig. 5d). Then, at low pH, protonation of –NH2 groups has been achieved (Rx. 3 from Fig. 5d). Considering the fact that the binding between metal ions and nitrogen atom is stronger in comparison to the binding occurring between H+ and the nitrogen from protonated amine groups, selective removal of metal ions can then be achieved (Rxs. 4 and 5 from Fig. 5d).
Generally, cations (i.e., Na(I), K(I), Ca(II), and Mg(II)) can inhibit the adsorption process of heavy metal ions by competing with the active adsorption sites.36 Therefore, the adsorption behaviors of Pb(II) and Cu(II) onto PC-ED/1.5 in presence of Na(I), K(I), Ca(II), and Mg(II) cations were studieds (Fig. 5e and f). In various studied systems we notice a slight decrease in the adsorption capacity and the adsorption performance is more likely to be inhibited by divalent cations compared to that of monovalent cations.36 The results indicate that PC-ED/1.5 shows great antication interference ability for the adsorption of Pb(II) and Cu(II), which makes it applicable for use in real-water treatment processes.
Linear regression models of pseudo-first-order and pseudo-second-order kinetic have been applied to analyze the experimental data of Cu(II) and Pb(II) adsorption onto PC-ED/1.5 at 25 °C (Fig. S3†).39,40 The data showed that the values of the rate constants k2 and the regression coefficient (R2) of the pseudo-second order kinetic model, represent the adsorption of Cu(II) and Pb(II) onto PC-ED/1.5. Moreover, the experimental adsorption capacity of Cu(II) and Pb(II) were very close to the calculated values by the pseudo-second order model. These results indicate that PC-ED/1.5 contains a heterogeneous surface during the adsorption processes of Pb(II) and Cu(II).36
To reach the equilibrium adsorbed amount of Cu(II) and Pb(II) onto PC-ED/1.5, the initial concentrations of Cu(II) and Pb(II) were varied as depicted in Fig. S4.† The adsorbed amounts of Cu(II) and Pb(II) onto PC-ED/1.5 increase with increasing the equilibrium concentration of Cu(II) and Pb(II) up to plateau values. The strong gradient of Cu(II) and Pb(II) concentrations and the lack of active sites in PC-ED/1.5 make the mass transfer between the material and the liquid phase difficult.41 The temperature effect on the removal of Cu(II) and Pb(II) onto PC-ED/1.5, was investigated from 25 °C to 45 °C (Fig. 4S†). As shown in Fig. S4,† the Cu(II) and Pb(II) removal amounts increase with increasing temperature, indicating hence an endothermic process related to the Cu(II) and Pb(II) species solubilities. As temperature increases, the interaction forces occurring between the Cu(II) and Pb(II) species and PC-ED/1.5 become stronger. Therefore, the higher temperature favors the adsorption of Cu(II) and Pb(II) onto the PC-ED/1.5.
Linear regression models of Langmuir and Freundlich were used in this work to investigate the equilibrium data of Cu(II) and Pb(II) adsorption onto PC-ED/1.5 at 25, 35 and 45 °C (Fig. S5†).42 The Langmuir model indicates the achievement of homogeneous adsorbed monolayer whereas the Freundlich model shows the heterogeneity of the surface with a multilayer adsorption.43,44 Fig. S5† shows the linear shapes of both models and the different parameters calculated. The results indicate a homogeneous distribution of active sites on the PC-ED/1.5 surface and the Langmuir isotherm model were the best model describing the adsorption of Cu(II) and Pb(II) from water onto the PC-ED/1.5 adsorbent. Therefore, the correlation coefficient shows a good fit in the case of Langmuir compared to the Freundlich model. In addition, the values of Freundlich constant 1/n were smaller than 1, confirming hence that the adsorption of Cu(II) and Pb(II) onto PC-ED/1.5 was favorable.45 Further, the maximum adsorption capacities Qmax of Cu(II) and Pb(II) onto PC-ED/1.5 were equal to 123.45 mg g−1 and 140.84 mg g−1, respectively.
Moreover, plotting ln(qe/ce) as a function of 1/T gives a straight line with slope and intercept equal to −ΔH/R and ΔS/R, respectively (Fig. S6†).42 The related thermodynamic parameters were also calculated and are shown in Tables S2.† Therefore, the negative values of ΔG (Table S2†) suggest the spontaneous nature of the adsorption process at 25, 35 and 45 °C.42 ΔG is negative and ΔH is positive at a given temperature, the adsorption process is a spontaneous endothermic reaction and the adsorption process could be improved by an appropriate increase in the temperature. Besides, ΔS > 0 indicating an increase in the disorder degree of the adsorbed layer at the solid/solution interface. In this study, the heat of Cu(II) and Pb(II) adsorption were less than 40 kJ mol−1, showing that the process was predominantly a physical adsorption.
3.3. Optimization of Cu(II) and Pb(II) adsorption onto PC-ED/1.5
In the present work, the optimization of Cu(II) and Pb(II) adsorption onto PC-ED/1.5 was investigated using the response surface methodology (RSM), which allows the establishment of relationships between independent variables and in the responses using a polynomial equation.26,46 Firstly, the ranges of variables were obtained from preliminary screening experiments of kinetics and isotherm studies at pH 6 and 25 °C (Table S3†). Then, Central Composite Design (CCD) was chosen to investigate the linear, quadratic and interaction effects of three independent variables (Table S4†). For more information about the optimization process of Cu(II) and Pb(II) adsorption onto PC-ED/1.5 see ESI.†3.4. Adsorption mechanism of Cu(II) and Pb(II) onto PC-ED/1.5
To toll about the adsorption mechanism of Cu(II) and Pb(II) onto PC-ED/1.5 many parameters should be taken into account, especially the electrostatic behavior of our system and the adsorption of these ions in the pores of PC. Firstly, FTIR analysis before and after adsorption of Cu(II) and Pb(II) onto PC-ED/1.5 was investigated (Fig. S8†). This analysis shows that the peaks of –OH groups, C–O, C![[double bond, length as m-dash]](https://www.rsc.org/images/entities/char_e001.gif) O vibration, and C–N groups were shifted from their position. In addition, FT-IR spectra show that the typical absorption band of C–N at 1327 cm−1 cannot be observed in the spectrum of Pb(II) and Cu(II) PC-ED/1.5 with the same intensity, suggesting that Pb(II) and Cu(II) have been adsorbed on PC-ED/1.5 surface through interaction with valence electrons (non-bonding pair) of amino-functionalized groups. These results confirm that the mechanism of adsorption referred to the formation of hydrogen bonding, electrostatic attraction with C–O and C
O vibration, and C–N groups were shifted from their position. In addition, FT-IR spectra show that the typical absorption band of C–N at 1327 cm−1 cannot be observed in the spectrum of Pb(II) and Cu(II) PC-ED/1.5 with the same intensity, suggesting that Pb(II) and Cu(II) have been adsorbed on PC-ED/1.5 surface through interaction with valence electrons (non-bonding pair) of amino-functionalized groups. These results confirm that the mechanism of adsorption referred to the formation of hydrogen bonding, electrostatic attraction with C–O and C![[double bond, length as m-dash]](https://www.rsc.org/images/entities/char_e001.gif) O groups and/or the interaction between Cu(II) and Pb(II) and amino-functionalized groups. Despite the performance of FTIR technique to determining behavior change, but it remains able to explain all of the phenomena, especially when the metal ions matrix was used as the adsorbate. So, to evaluate the surface charge nature of PC and PC-ED/1.5 in interaction with Pb(II) and Cu(II), standard induced potential (SIP) was used (Fig. 6a and b).
O groups and/or the interaction between Cu(II) and Pb(II) and amino-functionalized groups. Despite the performance of FTIR technique to determining behavior change, but it remains able to explain all of the phenomena, especially when the metal ions matrix was used as the adsorbate. So, to evaluate the surface charge nature of PC and PC-ED/1.5 in interaction with Pb(II) and Cu(II), standard induced potential (SIP) was used (Fig. 6a and b).
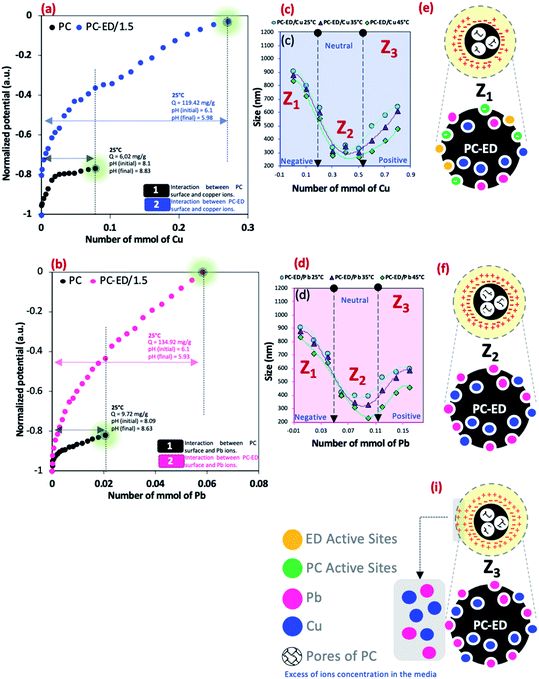
Fig. 6a and b presents the normalized surface potential variation as a function of the Pb(II) and Cu(II) amount added in a medium of PC or PC-ED/1.5. This variation described mainly the interaction between the surface of adsorbent and heavy metal ions. The Müteck PCD 02 apparatus was used to get the standard induced potential (SIP) as a function of Pb(II) and Cu(II) amount (mmol) by using a cylindrical chamber and a piston made of poly (tetrafluoroethylene).16 Therefore, 10 ml of PC or PC-ED/1.5 aqueous suspension was placed in the space (0.5 mm) between the cylindrical chamber wall and the piston. Then, at each minute, an amount of Pb(II) and Cu(II) was added and the potential was measured between both electrodes placed at the opposite ends of the enclosure. The results showed that when a small amount of haevy metal ions has been added to the PC solution, the surface charged was saturated. The adsorbed quantities has been measured at these points and equals to 9.72 mg g−1 and 6.02 mg g−1 for Cu(II) and Pb(II) adsorption onto PC, respectively. These results show that the Cu(II) and Pb(II) occupy some active negatives sites on the surface of PC (−OH, C–O and C![[double bond, length as m-dash]](https://www.rsc.org/images/entities/char_e001.gif) O) which decrease the negative charge of PC and gives us a plateau. In the other side, a large plateau was determined in the case of Cu(II) and Pb(II) adsorption onto PC-ED/1.5. This results shows the strong interaction between Cu(II)/Pb(II) and PC-ED/1.5 surface, considering that the foreign element is the amino-functionalized groups compared to the first case. The equilibrium of 0 mV (iso electric point) was detected and adsorbed quantities were determined. The calculated adsorbed quantities were 119.42 mg g−1 and 134.92 mg g−1 for Cu(II) and Pb(II), respectively. These results are practically in agreement with the maximum adsorbed quantity found in the isotherm study.
O) which decrease the negative charge of PC and gives us a plateau. In the other side, a large plateau was determined in the case of Cu(II) and Pb(II) adsorption onto PC-ED/1.5. This results shows the strong interaction between Cu(II)/Pb(II) and PC-ED/1.5 surface, considering that the foreign element is the amino-functionalized groups compared to the first case. The equilibrium of 0 mV (iso electric point) was detected and adsorbed quantities were determined. The calculated adsorbed quantities were 119.42 mg g−1 and 134.92 mg g−1 for Cu(II) and Pb(II), respectively. These results are practically in agreement with the maximum adsorbed quantity found in the isotherm study.
To fully explain this electrostatic behavior, the particle size of PC-ED/1.5 in dispersed medium in function of Pb(II) and Cu(II) amount was carried out at different temperatures using the DLS method. The measurements of PC-ED/1.5 particle sizes in aqueous dispersion was performed using Coulter Model N4S (Coultronics) apparatus which operates with a laser 4 mW helium–neon (wavelength = 632.8 nm), and an optical system to detect at 90° angle the light scattered by the sample, as described elsewhere.18,47
DLS analysis showed that there is a positive effect of T °C on the size of the particles when the temperature increases the size decreases (Fig. 6c and d). However, the most important information is the influence of Pb(II) and Cu(II) amount on the size particles (agglomeration phenomena). We show that for both systems the curve Pb(II) and Cu(II) amount as a function of the size of particles was divided into three parts:
• Zone 1, noted Z1 (Fig. 6e): the amount of Cu(II) and Pb(II) was not sufficient to saturate the PC-ED/1.5 surface, which makes the agglomeration of particles and increases the size.
• Zone 2, noted Z2 (Fig. 6f): the zone of equilibrium (0 mV) in which the surface PC-ED/1.5 was practically neutral which makes the electrostatic interaction between the particles itself weak and given the lower size of the particles. These results are in agreement with the SIP measurement.
• Zone 3, noted Z3 (Fig. 6i): in this zone, the Cu(II) and Pb(II) ions have already saturated the surface of PC-ED/1.5 and they stay in excess in the medium. This can cause the formation of other chemical compounds and the agglomeration of particles again, but weakly compared with the first zone.
DLS analysis confirms that the size of PC-ED/1.5 was very sensitive to Pb(II) and Cu(II) amount variation and the size particles were diminished according to the amount of ions increase until the isoelectric point. Therefore, the Fig. 7 shows a correlation between particle size and surface charge when the amount of heavy metal ions was varied and gives practical information on electrostatic behavior of the our system. These results allow us to confirm that the amino-functionalized groups played a very important role in the adsorption of Cu(II) and Pb(II) compared to other groups. The adsorption mechanism of Pb(II) and Cu(II) onto PC-ED/1.5 can be outlined in Fig. 8. In addition, the fixation of Pb(II) and Cu(II) pollutants molecules on the surface of PC-ED/1.5 was not only the determined step of process adsorption. The first step is generally attributed to the fixation of the pollutant molecule inside the adsorbent pores, especially in porous materials like carbon. For this reason, the BET analysis before and after adsorption of Pb(II) and Cu(II) pollutants onto PC-ED/1.5 was performed (Fig. S2†). As presented in Fig. S2† the nitrogen adsorption/desorption isotherms of the pristine PC, PC-ED/1.5, PC-ED/1.5 loaded Cu(II) and PC-ED/1.5 loaded Pb(II) are practically similar in the shape of the hysteresis loop with a little difference, which can be attributed to the adsorption of these ions inside the pores of PC-ED/1.5. Although heavy metal ions are not absorbed very well in our material, considering the small decrease in the specific surface and the low adsorption amount of Cu(II) and Pb(II) onto PC alone compared with PC-ED/1.5. These results show that (i) a small amount of Cu(II) and Pb(II) was fixed in the pores actives sites; (ii) another amount of Cu(II) and Pb(II) was fixed in active sites from the PC-ED/1.5 surface and (iii) a very large amount has been fixed by amino-functionalized active sites from the PC-ED/1.5 surface by chelation or via electrostatic interaction process. The same results were reported in others works.37,48,49 The schematic mechanism of aqueous adsorption of Pb(II) and Cu(II) ions by PC-ED/1.5 surface was presented in Fig. 8a. Therefore, aqueous Pb(II) and Cu(II) ions adsorption by PC-ED/1.5 can be accomplished by below reactions (Fig. 8b):
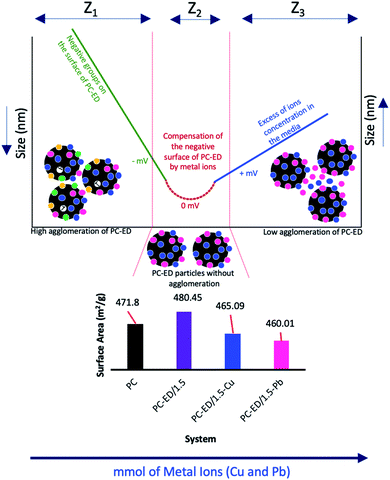 | ||
| Fig. 7 Variation of the BET surface area before and after adsorption, potential and the size of PC-ED/1.5 particles in function the amount of Cu(II) and Pb(II). | ||
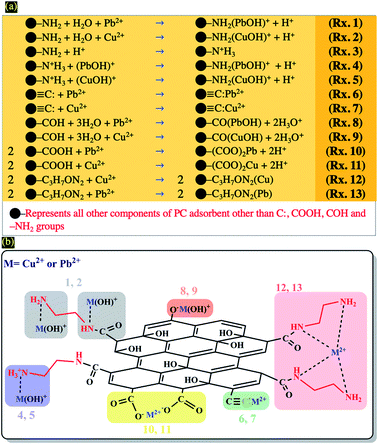 | ||
| Fig. 8 (a) Schematic mechanism of aqueous adsorption of Pb(II) and Cu(II) ions by PC-ED/1.5 surface and (b) general surface reaction during adsorption process of heavy metals (Cu(II) and Pb(II)). | ||
• Rxs. 1 and 2 from Fig. 8b: through coordination complex by electron pair sharing of ethylediamine.
• Rxs. 4 and 5 from Fig. 8b: through ions exchange between H+ and M2+ species.
• Rxs. 6 and 7 from Fig. 8b: through the Cπ interactions to form the Cπ–Pb and Cπ–Cu complexes.
• Rxs. 8 and 9 from Fig. 8b: through surface reactions with surface hydroxyl groups of PC.
• Rxs. 10 and 11 from Fig. 8b: through surface reactions with surface carboxyl groups no reagent with ethylediamine of PC.
• Rxs. 12 and 13 from Fig. 8b: through chelation process.
3.5. Regeneration study and mass recovery of PC-ED/1.5 and F-PC-ED/1.5
After the adsorbents characterization, their effective adsorption of heavy metal ions, the optimization of adsorption process and the proposed adsorption mechanism, the regeneration efficiency and recovery mass of PC-ED/1.5 were evaluated for the PC-ED/1.5 and their three-dimensional networks as prepared in the optimum conditions. The three-dimensional networks of PC-ED/1.5 were used to reduce the mass loss of PC-ED/1.5. Therefore, 1 g of alginate powder and 1 g of PC-ED/1.5 sample were mixed and stirred for 4 hours followed by sonication of 10 minutes (Sonimasse 150 TS, 20 kHz, 160 W) in 100 ml of distilled water. Then, 10 ml of this suspension (PC-ED@Alginate) was transferred to a glass Petri dish and dried for 48 hours at room temperature. In the last step, 10 ml of the CaCl2 solution (0.1 M) was added to the Petri dish, for the cross-linking of the alginate molecules by the calcium ions, leading hence to the formation of a three-dimensional network (Fig. 9a). The prepared films were washed several times with water and ethanol in order to use them later as adsorbents for Cu(II) and Pb(II) heavy metal ions, under similar conditions carried out with the PC-ED/1.5 adsorbent. The ethylenediamine functionalized PC film was labelled as F-PC-ED/1.5. Three-dimensional networks of PC-ED/1.5, like PC-ED/1.5 showed very high efficiency. Therefore, the effects of the alginate/Ca matrix on the adsorption properties of Cu(II) and Pb(II), were carried out and presented in Fig. S9.† Experimental results show that the participation of the alginate/Ca matrix in the adsorption process does not exceed 15%. These results could be explained by the interactions occurring between the free carboxylic groups of alginates and the Cu(II) and Pb(II) ions. Fig. S7† shows also the influence of ethylenediamine functionalization on the adsorption of Cu(II) and Pb(II) by using optimal mass of F-PC-ED/1.5. However, after functionalization, a favorable increase of removal rate was observed, nearly by more than 70%.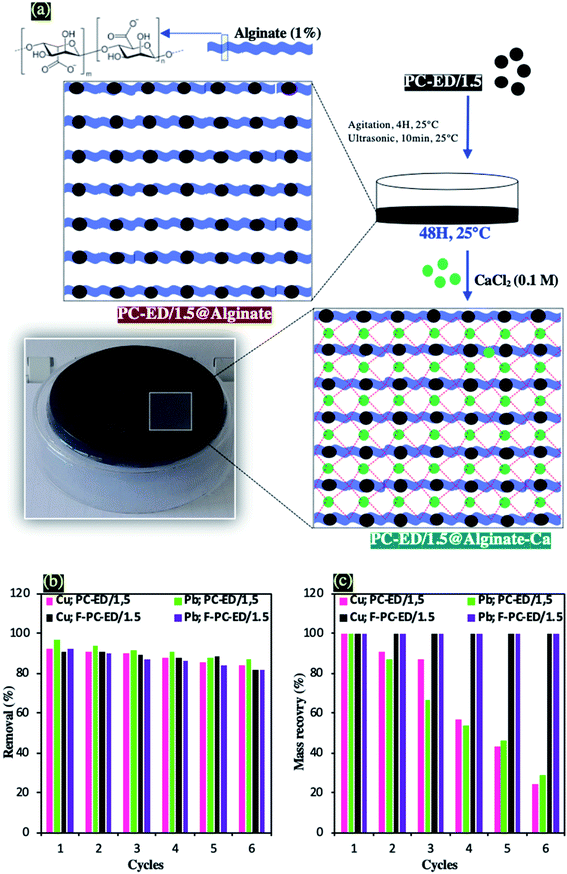 | ||
| Fig. 9 (a) Protocol of preparation of PC-ED/1.5@alginate-Ca three-dimensional networks, (b) regeneration study and (c) Mass recovery of PC-ED/1.5 and F-PC-ED/1.5. | ||
Fig. 9b shows that the removal from water of Cu(II) and Pb(II) decreases as the number of regeneration cycles increases. After 6 cycles, the renewability and durability of PC-ED/1.5 and F-PC-ED/1.5 adsorbents were still achieved. 92.1% → 83.6%, 96,7% → 86.8%, 91.1% → 81.8% and 92.2% → 82% for Cu(II) adsorption onto PC-ED/1.5, Pb(II) adsorption onto PC-ED/1.5, Cu adsorption onto F-PC-ED/1.5, and Cu(II) adsorption onto F-PC-ED/1.5, respectively. The sorption regeneration test revealed that the PC-ED/1.5 and F– PC-ED/1.5 could be effectively used as a promising adsorbent. In addition, the durability was also tested by the study of the mass recovery of PC-ED/1.5 and F– PC-ED/1.5 (Fig. 9c). After 6 filtration cycles of liquid-(adsorbate)/solid-(adsorbent) phases, the recovered mass was determined. In the case of PC-ED/1.5, 76% of the mass has been lost during adsorption of Cu and 71% lost during adsorption of Pb(II). On the other hand, the mass of F-PC-ED/1.5 has not decreased during the adsorption of Cu and Pb and 100% of adsorbent mass has been recovered.
4. Conclusion
In summary, through both characterization techniques and the experimental ways, we can successfully fulfill the missions that we proposed. (1) in our case, we adopted a simple, eco-friendly ultrasound grafting approach using ethylenediamine as chemical modifier under very mild temperature conditions (40 °C). (2) How much we ensure the fixation of the ethylenediamine on the porous carbon surface? By using XPS analysis we confirm that the adsorbent surface functionalities include the –NH and C–N–C groups. In addition, other techniques (e.g. BET, XRD, TEM and FTIR) have confirmed the changes implemented on the porous carbon surface, mainly, the interlayer spacing d002 and the defects ratio along the whole graphene sheets. (3) What will be the role of amino-groups functionalization for metal ions removal? The amino-groups were found to simultaneously improve the metal ions removal from water and recycling stability. Therefore, the PC-ED/1.5 adsorbent exhibited a maximum adsorption capacities of 123.45 mg g−1 and 140.84 mg g−1 for Cu(II) and Pb(II), respectively, compared to: 6.02 mg g−1 and 9.72 mg g−1 for Cu(II) and Pb(II), respectively, when the non-modified PC was used as adsorbent. These results shows the importance of integration of ED molecules in the surface of PC to improve adsorption capacities, which was observed and confirmed in other works (Table S7†). (4) How can we confirm that other species (e.g., Na(I), K(I), Ca(II), and Mg(II)) can not inhibit the adsorption process of heavy metal ions by competing with the active adsorption sites ? In this work we confirmed that the adsorption performance is not affected by divalent or monovalent cations, which makes it applicable for use in real-water treatment processes. The adsorption capacities has not changed despite the presence of these species. (5) Has the optimization by the RSM-CCD method been well applied in the present system? Yes, it is based on statistical results, the ANOVA of proposed models have p-values < 0.5 indicating their significant. In addition, the precision of optimum removal was confirmed by using adsorption experiments and the results show that the proposed model used in this study is a suitable and usable to describe the aqueous adsorption of Cu(II) and Pb(II) adsorption onto PC-ED/1.5. (6) In terms of regeneration and mass recovery, can we say that this material is effective for real wastewater treatment? Yes, the results show that the renewability and durability of PC-ED/1.5, were still achieved after 6 cycles. In addition, three-dimensional networks of PC-ED/1.5 by using alginate biopolymer was prepared and showed long-term stability and regeneration capabilities. On the other hand, the mass of F-PC-ED/1.5 has not decrease during the adsorption of Cu and Pb and 100% of the adsorbent mass has been recovered. (7) Was the adsorption mechanism well explained in a more real way? Practically yes, because, powerful surface and interface techniques in aqueous dispersions were used. Therefore, in situ electrostatic interaction study by using surface charge detection and Dynamic Light Scaniing (DLS) at different temperatures, have confirmed that the mechanism of Cu(II) and Pb(II) removal from water onto PC-ED/1.5, was controlled by the amino-functionalized active sites present on the PC-ED/1.5 surface. The overall data indicate that the amino groups have the strong chelation ability towards metal ions.Conflicts of interest
The authors declare no competing financial interest. All authors have given approval to the final version of the manuscript.Acknowledgements
This work was supported by MNEFPESRS, CNRST, SCAC, IFM, Campus France, Institute of Materials Science Mulhouse (IS2M) – Haute Alsace University and the Materials and Environment Laboratory (LME) – University Ibn Zohr. Franco-Moroccan cooperation Framework, research project CEDocs 2018. We thank, FIOUX Philippe (IS2M-Mulhouse-France) and VIDAL Loïc (IS2M-Mulhouse-France), for the XPS and TEM analyses, respectively.References
- C. Ling, F. Liu, Z. Pei, X. Zhang, M. Wei, Y. Zhang, L. Zheng, J. Zhang, A. Li and B. Xing, Sci. Rep., 2015, 5, 1–12 Search PubMed.
- Q. Cao, Z. Huang, S. Liu and Y. Wu, Sci. Rep., 2019, 9, 11116 CrossRef PubMed.
- N. Kumar, E. Fosso-Kankeu and S. S. Ray, ACS Appl. Mater. Interfaces, 2019, 11, 19141–19155 CrossRef CAS PubMed.
- F. M. Pellera, A. Giannis, D. Kalderis, K. Anastasiadou, R. Stegmann, J. Y. Wang and E. Gidarakos, J. Environ. Manage., 2012, 96, 35–42 CrossRef CAS PubMed.
- W. R. Lim, S. W. Kim, C. H. Lee, E. K. Choi, M. H. Oh, S. N. Seo, H. J. Park and S. Y. Hamm, Sci. Rep., 2019, 9, 1–10 CrossRef CAS PubMed.
- X. Zheng, N. Yu, X. Wang, Y. Wang, L. Wang, X. Li and X. Hu, Sci. Rep., 2018, 8, 3–11 CrossRef PubMed.
- D. Chen, W. Shen, S. Wu, C. Chen, X. Luo and L. Guo, Nanoscale, 2016, 8, 7172–7179 RSC.
- S. Tighadouini, S. Radi, M. Ferbinteanu and Y. Garcia, ACS Omega, 2019, 4, 3954–3964 CrossRef CAS PubMed.
- K. Zhao, L. Kong, W. Yang, Y. Huang, H. Li, S. Ma, W. Lv, J. Hu, H. Wang and H. Liu, ACS Appl. Mater. Interfaces, 2019, 47, 44751–44757 CrossRef PubMed.
- F. Cao and J. Shen, J. Chem. Eng. Data, 2019, 12, 5622–5629 CrossRef.
- M. Zhang, L. Xu, C. Qi and M. Zhang, Ind. Eng. Chem. Res., 2019, 58, 20036–20046 CrossRef CAS.
- E. García-Díez, S. Schaefer, A. Sanchez-Sanchez, A. Celzard, V. Fierro, M. M. Maroto-Valer and S. García, ACS Appl. Mater. Interfaces, 2019, 11, 36789–36799 CrossRef PubMed.
- Y. Liu, J. Xu, Z. Cao, R. Fu, C. Zhou, Z. Wang and X. Xu, J. Colloid Interface Sci., 2020, 559, 215–225 CrossRef CAS PubMed.
- J. Yu, C. Chi, B. Zhu, K. Qiao, X. Cai, Y. Cheng and S. Yan, Sci. Total Environ., 2020, 700, 134412 CrossRef CAS PubMed.
- A. Jada, R. Ait Akbour and J. Douch, Chemosphere, 2006, 64, 1287–1295 CrossRef CAS PubMed.
- A. Jada, H. Debih and M. Khodja, J. Pet. Sci. Eng., 2006, 52, 305–316 CrossRef CAS.
- Z. Anfar, A. Jada and N. El Alem, RSC Adv., 2019, 9, 25544–25553 RSC.
- A. Jada, H. Ridaoui, L. Vidal and J. B. Donnet, Colloid. Surface. Physicochem. Eng. Aspect., 2014, 458, 187–194 CrossRef CAS.
- H. A. Ahsaine, M. Zbair, Z. Anfar, Y. Naciri, R. El, N. El Alem and M. Ezahri, Mater. Today Chem., 2018, 8, 121–132 CrossRef.
- S. Fan, J. Tang, Y. Wang, H. Li, H. Zhang, J. Tang, Z. Wang and X. Li, J. Mol. Liq., 2016, 220, 432–441 CrossRef CAS.
- A. L. Cazetta, T. Zhang, T. L. Silva, V. C. Almeida and T. Asefa, Appl. Catal. B Environ., 2018, 225, 30–39 CrossRef CAS.
- M. Zbair, M. Bottlinger, K. Ainassaari, S. Ojala, O. Stein, R. L. Keiski, M. Bensitel and R. Brahmi, Waste Biomass Valorization, 2020, 11, 565–1584 CrossRef.
- M. Zbair, K. Ainassaari, Z. El Assal, S. Ojala, N. El Ouahedy, R. L. Keiski, M. Bensitel and R. Brahmi, Environ. Sci. Pollut. Res., 2018, 25, 35657–35671 CrossRef CAS PubMed.
- M. V. Sammani Ramanayaka, D. C. W. Tsang, D. Hou and Ok Yong Sik, Sci. Total Environ., 2019, 19, 135725 Search PubMed.
- Z. Anfar, M. Zbair, H. A. Ahsaine, M. Ezahri and N. El Alem, Fullerenes, Nanotub. Carbon Nanostruct., 2018, 26, 389–397 CrossRef CAS.
- M. Zbair, Z. Anfar, H. A. Ahsaine, N. El Alem and M. Ezahri, J. Environ. Manage., 2018, 206, 383–397 CrossRef CAS PubMed.
- S. Vasudevan and J. Lakshmi, RSC Adv., 2012, 2, 5234–5242 RSC.
- W. Song, B. Gao, X. Xu, F. Wang, N. Xue, S. Sun, W. Song and R. Jia, J. Hazard. Mater., 2016, 304, 280–290 CrossRef CAS PubMed.
- X. Yun, J. Li, X. Chen, H. Chen, L. Xiao, K. Xiang, W. Chen, H. Liao and Y. Zhu, ACS Appl. Mater. Interfaces, 2019, 11, 36970–36984 CrossRef CAS PubMed.
- M. Zbair, H. Ait Ahsaine and Z. Anfar, J. Clean. Prod., 2018, 202, 71–581 CrossRef.
- L. Shi, L. Jin, Z. Meng, Y. Sun, C. Li and Y. Shen, RSC Adv., 2018, 8, 39937–39947 RSC.
- J. Shen, W. Huang, L. Wu, Y. Hu and M. Ye, Compos. Appl. Sci. Manuf., 2007, 38, 1331–1336 CrossRef.
- Y. Song, N. Wang, L. Y. Yang, Y. G. Wang, D. Yu and X. K. Ouyang, Ind. Eng. Chem. Res., 2019, 58, 6394–6401 CrossRef CAS.
- C. P. Wang, J. Z. Wu, H. W. Sun, T. Wang, H. B. Liu and Y. Chang, Ind. Eng. Chem. Res., 2011, 50, 8515–8523 CrossRef CAS.
- S. Yang, J. Hu, C. Chen, D. Shao and X. Wang, Environ. Sci. Technol., 2011, 45, 3621–3627 CrossRef CAS PubMed.
- J. Luo, K. Fu, M. Sun, K. Yin, D. Wang, X. Liu and J. C. Crittenden, ACS Appl. Mater. Interfaces, 2019, 11, 38789–38797 CrossRef CAS PubMed.
- P. Sharma, A. K. Singh and V. K. Shahi, ACS Sustainable Chem. Eng., 2019, 7, 1427–1436 CrossRef CAS.
- J. Liang, X. Li, Z. Yu, G. Zeng, Y. Luo, L. Jiang, Z. Yang, Y. Qian and H. Wu, ACS Sustain. Chem. Eng., 2017, 5, 5049–5058 CrossRef CAS.
- S. Venkateswarlu, D. Lee and M. Yoon, ACS Appl. Mater. Interfaces, 2016, 8, 23876–23885 CrossRef CAS.
- B. Li, Y. Zhang, D. Ma, Z. Shi and S. Ma, Nat. Commun., 2014, 5, 1–7 Search PubMed.
- Z. Anfar, A. Amedlous, A. Ait El Fakir, H. Ait Ahsaine, M. Zbair, S. Lhanafi, R. El Haouti, A. Jada and N. El Alem, ACS Omega, 2019, 4, 9434–9445 CrossRef CAS PubMed.
- Y. Yang, Y. Xie, L. Pang, M. Li, X. Song, J. Wen and H. Zhao, Langmuir, 2013, 29, 10727–10736 CrossRef CAS.
- I. Langmuir, J. Am. Chem. Soc., 1916, 252, 2221–2295 CrossRef.
- Z. Anfar, H. Ait Ahsaine, M. Zbair, A. Amedlous, A. Ait El Fakir, A. Jada and N. El Alem, Crit. Rev. Environ. Sci. Technol., 2020, 10, 1043–1084 CrossRef.
- X. S. Wang, H. H. Miao, W. He and H. L. Shen, J. Chem. Eng. Data, 2011, 56, 444–449 CrossRef CAS.
- H. Ait Ahsaine, Z. Anfar, M. Zbair, M. Ezahri and N. El Alem, J. Chem., 2018, 2018, 1–14 CrossRef.
- Z. Anfar, A. Amedlous, A. A. El Fakir, M. Zbair, H. Ait Ahsaine, A. Jada and N. El Alem, Chemosphere, 2019, 236, 124351 CrossRef CAS PubMed.
- J. Zhu, J. Yang and B. Deng, Environ. Chem. Lett., 2010, 8, 277–282 CrossRef CAS.
- Z. Wang, G. Liu, H. Zheng, F. Li, H. H. Ngo, W. Guo, C. Liu, L. Chen and B. Xing, Bioresour. Technol., 2015, 177, 308–317 CrossRef CAS PubMed.
Footnote |
| † Electronic supplementary information (ESI) available. See DOI: 10.1039/d0ra05220e |
| This journal is © The Royal Society of Chemistry 2020 |

