 Open Access Article
Creative Commons Attribution 3.0 Unported Licence
Biophotonic sensor for the detection of creatinine concentration in blood serum based on 1D photonic crystal
Arafa H. Aly *a,
Doaa Mohameda,
Mona A. Mohasebab,
N. S. Abd El-Gawaadc and
Y. Trabelside
aTH-PPM Group, Physics Department, Beni-Suef University, Beni Suef, Egypt. E-mail: arafa.hussien@science.bsu.edu.eg
bDepartment of Physics, Faculty of Applied Science, Umm-Al-Qura University, Mecca, Saudi Arabia
cFaculty of Science, King Khalid University, Abha, Saudi Arabia
dPhysics Department, College of Arts and Sciences in Muhail Asir, King Khalid University, Abha, Saudi Arabia
ePhotovoltaic and Semiconductor Materials Laboratory, National Engineering School of Tunis, University of Tunis El Manar, 1002, Tunis, Tunisia
First published on 27th August 2020
Abstract
A new biophotonic sensor based on photonic crystal (PC) has been designed for the detection of creatinine concentration in blood, and is considered an important small molecule biomarker of renal dysfunction. Based on the transfer matrix method (TMM), we theoretically investigated the transmittance spectra of a one dimensional alternating dielectric photonic crystal (PC) designed as (AB)7/C/(AB)7 made of MgF2 (A), CeO2 (B) and creatinine concentration present in blood (C). The transmission spectra exhibit resonant peaks within the photonic band gap (PBG) indicative of so-called defect modes, which depend on parameters, such as concentration of creatinine in blood, thickness of defect layer and incident angle. The proposed sensor can determine the physiological levels of creatinine in human blood serum samples. The estimated parameters realize an efficient biophotonic sensor wherein sensitivity was tuned from 136.4 nm per RIU to 306.25 nm per RIU and is very useful for the detection of creatinine.
1. Introduction
Photonic crystals are periodic refractive index structural arrays as a function of one-dimension, two-dimension, or all three-dimension space. At the interface between every two different layers, a portion of the incident wave is reflected and due to a destructive interference between the incident wave and reflected wave, a standing wave is formed.Photonic crystals (PCs) are structures of nanometric compositions of insulating and metal-insulating materials discovered by Yablonovitch in 1987.1 These structures present a modulation of refractive indices that can control the propagation of electromagnetic waves and is called the photonic band gap (PBG).2 The PBG consists of a range of frequencies that forbid the propagation of light and are highly sensitive to external conditions, including mechanical stress,3 temperature,4,5 electric field,6 magnetic field,7 chemicals,8 pressure,9 and self-organization of multilayered stacks.10,11 Therefore, PCs are considered the basis for sensing applications, such as a chemical sensors,12 pressure sensors,13 and biosensors.14
Amongst the sensors, biosensors are devices with mechanisms for measuring changes in biological systems. Researchers have used different sensors to detect the shift in hormones,15 enzymes,16 level of glucose in urine,17 cancerolic cells,18 and nucleic acids.19 Many new technologies use materials, such as hydrogels, nanoparticles and PCs for developing compact biosensing systems.20–25 Among them, PC-based biosensor technology is considered a simple and cost-effective method to observe various diseases much more efficiently than traditional methods.
Therefore, the considered PC technology is adequate to sense the complexity of structures of biological molecules as well as overcome the high manufacturing cost of sensors.26–29 Furthermore, PC-based biosensors are widely used as a diagnostic tool for assessing kidney dysfunction by measuring creatinine concentration,30 glucose31–33 and cholesterol34 in body fluids. There are many types of biosensors that convert signals from biological systems to electrochemical, optical, electrical or magnetic signals.
Optical sensors, in particular, play an important role in the medical field because they provide vital and complementary information.35 The metabolic processes in biological systems are accompanied by chemical wastes called creatinine. The creatinine is mostly responsible for the energy production in muscles. Hence, disposal of creatinine from the biological system is extremely crucial.
This operation is done by the transfer of creatinine through the blood to the kidney, which disposes it through urine. Further, the measurement of levels of creatinine in blood is considered as a strong benchmark for efficient kidney functioning.36,37 Therefore, the process of measuring the levels of creatinine in the blood is a very important step to identify kidney diseases.38,39 There are many methods to determine creatinine levels in blood and urine, such as Jaffé's method40 as well as enzymatic methods.41,42
In this study, we present a new type of biosensor based on 1D PCs that is able to estimate the levels of creatinine in blood by taking into account device factors, such as convenience, cost-efficiency of the equipment, and optimizing the time gap. Based on the TMM approach, we theoretically studied the transmission spectrum of the PC containing a creatinine sample under different concentrations. We estimated the related parameters in order to improve the sensitivity of the considered photonic biosensor.
2. Theoretical model
We theoretically studied the transmittance spectra of a 1D defective PC designed as (AB)m/C/(AB)m made up of MgF2 (A), CeO2 (B) and creatinine concentration in blood (C), where m is the number of periods. The configuration of the proposed 1D multilayered stack is shown in Fig. 1.Based on the transfer matrix method (TMM), the interaction between stratified medium and the electromagnetic waves is described by the following equation:43,44
 | (1) |
 | (2) |
 as the phase difference at each interface. However, pr denotes the optical thicknesses for the S-polarized wave that satisfies the equation: Pr = nr
![[thin space (1/6-em)]](https://www.rsc.org/images/entities/char_2009.gif) cos
cos![[thin space (1/6-em)]](https://www.rsc.org/images/entities/char_2009.gif) ψr, where ψ1, ψ2, ψd are the incident angles of corresponding materials: MgF2, CeO2 and creatinine, respectively, satisfying the Snell's law:
ψr, where ψ1, ψ2, ψd are the incident angles of corresponding materials: MgF2, CeO2 and creatinine, respectively, satisfying the Snell's law:
no![[thin space (1/6-em)]](https://www.rsc.org/images/entities/char_2009.gif) sin sin![[thin space (1/6-em)]](https://www.rsc.org/images/entities/char_2009.gif) ψo = n1 ψo = n1![[thin space (1/6-em)]](https://www.rsc.org/images/entities/char_2009.gif) sin sin![[thin space (1/6-em)]](https://www.rsc.org/images/entities/char_2009.gif) ψ1 = n2 ψ1 = n2![[thin space (1/6-em)]](https://www.rsc.org/images/entities/char_2009.gif) sin sin![[thin space (1/6-em)]](https://www.rsc.org/images/entities/char_2009.gif) ψ2 = nd ψ2 = nd![[thin space (1/6-em)]](https://www.rsc.org/images/entities/char_2009.gif) sin sin![[thin space (1/6-em)]](https://www.rsc.org/images/entities/char_2009.gif) ψd ψd
| (3) |
The 2nd kind of Chebyshev polynomials are used to calculate the matrices product (h1h2)m.44
Consequently, the transmittance satisfies the following expression:45
 | (4) |
For the case of TE mode, the transmittance is given by the following expression:44
 | (5) |
Finally, the sensitivity of the 1D-PCs can be defined as the ratio of the resonant peak wavelength to the contrast index using the following equation:44
 | (6) |
3. Results and discussions
The transmittance properties of the proposed biosensor based on the 1D defective PC are investigated. The effect of relative parameters related to creatinine defects such as blood creatinine concentration, thickness and incident angle are examined in order to achieve an efficient and stable biosensor.In the numerical calculations, the considered material parameters of multilayered stacks of layer A (MgF2) and layer B (CeO2) are the dielectrics of these materials wherein the thickness and refractive index were assumed to be dA = dB = 0.1 μm and nA = 1.37 and nB = 2.4, respectively. Further, the thickness of blood creatinine sample considered was 230 nm. The defect layer is considered in the blood creatinine sample under different concentrations.
Fig. 2 shows the transmittance spectra as a function of wavelengths through the defective 1D-PC at a blood creatinine concentration of 80.9 μmol L−1. It is obvious that a resonant transmittance peak called defect mode within the enhancement of photonic band gap (PBG) for the seventh order of periodicity is observed. Further, the PBG prohibited the propagation of wave at a corresponding wavelength range [650–927.8 nm] and allowed only the wavelength of the defect mode.
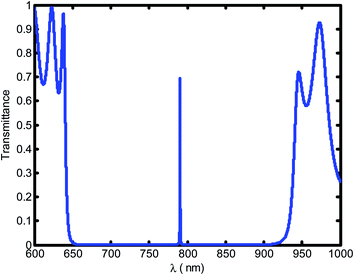 | ||
| Fig. 2 The transmittance spectrum of a defective photonic crystal as a function of wavelength at blood creatinine sample (80.9 μmol L−1). | ||
Table 1 shows the evolution of creatinine concentration (μmol L−1) versus the refractive index. It is obvious that the creatinine concentration in the sample increases with the refractive index.
| Refractive index | Creatinine concentration (μmol L−1) |
|---|---|
| 2.661 | 80.9 |
| 2.655 | 81.43 |
| 2.639 | 82.3 |
| 2.610 | 83.3 |
| 2.589 | 84.07 |
| 2.565 | 85.28 |
Fig. 3 shows the evolution of transmittance beam through the proposed biosensor based on defective PC at normal incidence for different blood creatinine samples, C (μmol L−1). Here, C is set to be between 2.565 μmol L−1 and 2.661 μmol L−1. By increasing the blood creatinine concentration, the defect mode gets shifted towards longer wavelengths. The aforementioned shift is due to the position dependent refractive index of the defect layer. Thus, this mobility is also interpreted by the condition of standing wave Δ = mλ = neffG,45 where Δ, m, neff and G are the optical path difference, an integer, effective refractive index and geometric path difference, respectively. The proposed biosensor exhibited a sensitivity of about 136.4 nm per RIU at a normal incident angle.
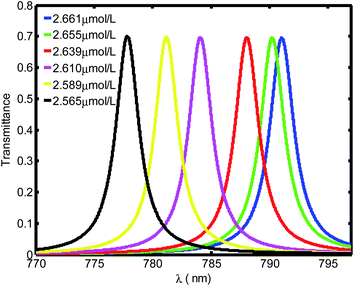 | ||
| Fig. 3 Evolution of resonant peak of defective PC as the function of wavelength with different creatinine concentrations in blood, C. Here, C is set between 2.565 μmol L−1 and 2.661 μmol L−1. | ||
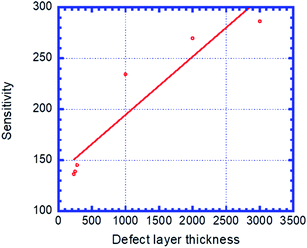
Fig. 4 presents the emplacement of resonant peaks within the PBG at different regions of wavelengths. We noticed that the presented defect mode shift towards longer wavelengths when we increase the thickness of defect layer. We illustrated the enhanced amplitude and number of resonant peaks for higher value of thicknesses. Thus, we obtain high sensitivity with respect to the position of defect mode as we increase the thickness. This behavior is approved experimentally.46 By increasing dd, the geometrical path difference of defect peaks, the sensitivity rises from 136.4 nm per RIU at dd = 1 μm to 286.5 nm per RIU at dd = 3 μm.
Fig. 5 displays the same behavior in Fig. 4 with resonant peaks and the defect mode shifted to longer wavelength when the defect layer thickness increased. In addition in Fig. 5 we illustrate an enhanced amplitude and number of resonant peaks for high value of thickness. Thus, we obtain an efficient sensitivity in which value increase with position of defect mode. This behavior is approved experimentally by work.46 By increasing dd the geometrical path difference of defect peaks leads to rising the sensitivity from 136.4 nm per RIU at dd = 1 μm to 286.5 nm per RIU at dd = 3 μm.
 | ||
| Fig. 5 The transmittance spectrum of defective PC as the function of wavelengths with different value of creatinine concentration in blood dd. Here, dd is set at 1 μm, 2 μm and 3 μm, respectively. | ||
Fig. 6 shows the sensitivity (nm per RIU) of the proposed biosensor based on PC versus the thicknesses of defect layer, dd. We see that the sensitivity increases with dd and follows the linear fitted equation: S = 137.62 + 0.057069dd. Here, R = 0.93967 is the correlation coefficient between the linear fitting and the simulation data. dd = 3 μm is set as the maximum thickness because an excess of this corresponding value causes the appearance of new peaks that disturb the performance of the sensor.
 | ||
| Fig. 6 Sensitivity of the designed biosensor based on defective PC versus the thickness of creatinine concentration sample, dd. | ||
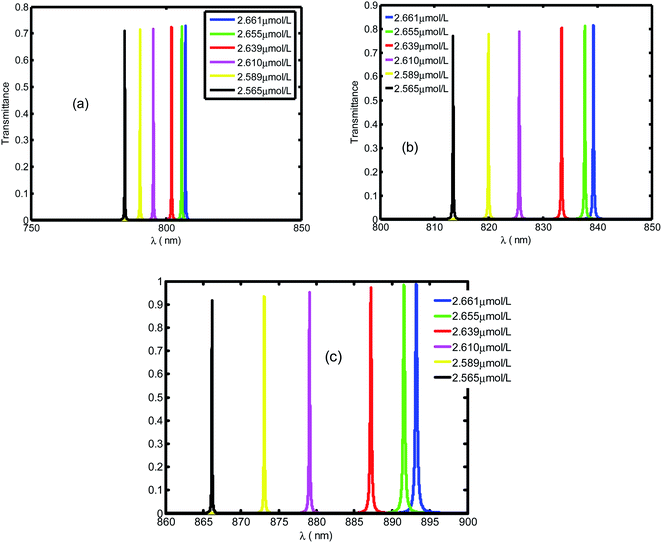
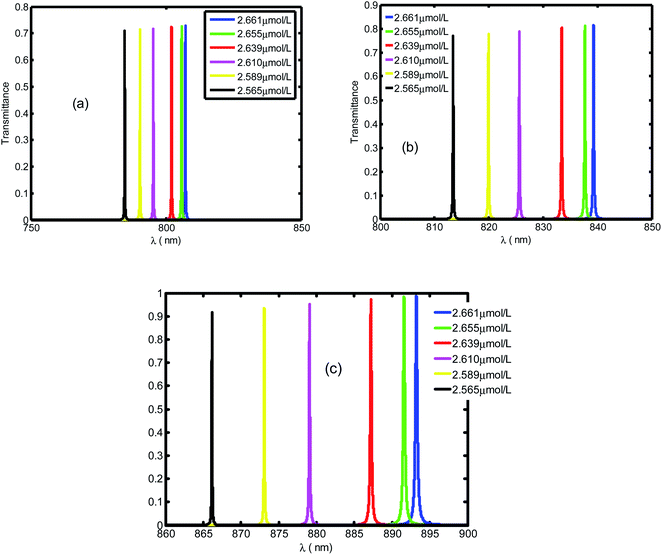
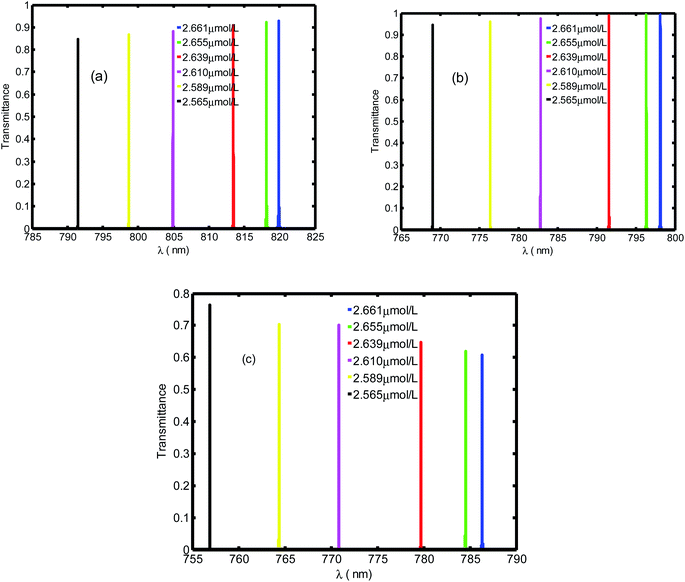
Further, we analyzed the dependence of resonant peaks on the incident angle. For the seventh order of periodicity, we plotted the transmittance spectra as a function of the wavelength for different incident angles. Here, the incident angles are set at θ = 45° (Fig. 7(a)), θ = 65° (Fig. 7(b)), and θ = 85° (Fig. 7(c)). It can be seen from the Fig. 7 that with increasing angle of incidence, the defect mode shifts down to lower wavelengths, while the amplitudes of insert resonant peaks increase and become sharper as we increase the incident angle. We can explain this behavior in Fig. 7 based on Bragg Snell's law,47  , where m, λ, d and neff are the constructive diffraction order, the wavelength of the maximum reflected intensity, the period, and the effective refractive index, respectively.
 | ||
| Fig. 7 Transmittance spectra of the proposed biosensor based on defective PC at different oblique incidences with θ are set at (a) θ = 45°, (b) θ = 65°, and (c) θ = 85°. | ||
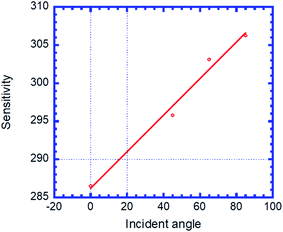
Fig. 8 illustrates the variation in sensitivity (nm per RIU) of the proposed biosensor based on the defective PC with the angle of incidence. We see that the sensitivity (nm per RIU) increases with the angle of incidence due to the increase in amplitude of the defect mode. The linear fitted plot of sensitivity versus incident angle follows the equation: S = 286.23 + 0.23966θ with R = 0.96947, which is the correlation coefficient between the linear fitting and the simulation data.
 | ||
| Fig. 8 Sensitivity of the proposed biosensor based on defective PC versus the incident angle for the considered creatinine blood concentration. | ||
The proposed biosensor designed (by alternating MgF2/CeO2) with creatinine sample defect exhibited an efficient sensitivity around 305 nm per RIU at high incident angles, which is not achieved for ordinary sensors, such as the theoretical optical sensor based on single nanobeam air-mode cavity (SNAC) with a sensitivity, S = 103 nm per RIU proposed by Yang et al.48 and the waveguide based sensor with a sensitivity, S = 282.4 nm per RIU proposed by Bagci and Akaoglu.49
To show the performance of the proposed biosensor based on the defective creatinine PC, we calculated the quality factor,  , and the ratio of sensitivity to full width at half maximum of the resonant peaks called the “figure of merit”
  , where λd, λFWHM and S are the resonant wavelength, the full width at half maximum (FWHM) of defect mode and sensitivity, respectively.
Table 2 shows the performance of our proposed biosensor that exhibits a high Q-factor about 2.5 × 10⁵ at 80.9 μmol L−1 and a FOM about 1.03 × 10⁵ (RIU) at 81.43 mmol L−1. Finally, we calculated the limit of detection (LOD) for the proposed sensor from the equation: LOD = λ/(20 × S × Q).50,51 From the simulation results in Table 2, LOD is equal 1.04 × 10⁻⁶ RIU. The value of LOD is very low, which means that the proposed sensor is efficient as it is capable of resolving very small changes in the refractive index.
| Creatinine blood sample concentration (μmol L−1) | N | S (nm per RIU) | λd (nm) | λFWHM (nm) | Q × 105 | FOM × 104 (RIU) |
|---|---|---|---|---|---|---|
| 80.9 | 2.661 | — | 756.9 | 0.003 | 2.5 | — |
| 81.43 | 2.655 | 306.25 | 764.4 | 0.003 | 2.5 | 10.3 |
| 82.3 | 2.639 | 306.25 | 770.9 | 0.004 | 1.9 | 7.6 |
| 83.3 | 2.610 | 306.25 | 779.7 | 0.0075 | 1.03 | 4.08 |
| 84.07 | 2.589 | 306.25 | 784.5 | 0.01 | 0.78 | 3.06 |
| 85.28 | 2.565 | 306.25 | 786.3 | 0.02 | 0.39 | 1.5 |
4. Conclusion
In this paper, a photonic biosensor based on 1D defective PC with creatinine blood sample has been developed. We theoretically investigated the performance of the proposed biosensor using the TMM approach. It is found that characteristics of the biosensor can be tuned by related parameters, such as concentration of creatinine in blood, thickness of defect layer and angle of incidence. From estimated parameters, we have obtained an efficient biosensor with high sensitivity approximating to 306.25 nm per RIU, which has not been achieved by ordinary optical sensors.Conflicts of interest
The authors declare they have no conflicts of interest.Acknowledgements
The authors are thankful to the Deanship of Scientific Research – Research Center at King Khalid University in Saudi Arabia for funding this research (code number: G.R.P-35-1441/2020).References
- E. Yablonovitch, Inhibited spontaneous emission in solid-state physics and electronics, Phys. Rev. Lett., 1987, 58, 2059 CrossRef PubMed.
- E. Yablonovitch, Photonic band-gap structures, J. Opt. Soc. Am. B, 1993, 10, 283–295 CrossRef.
- J.-B. Lee, Mechanically tunable photonic crystal structure, Appl. Phys. Lett., 2004, 85, 4845 CrossRef.
- A. H. Aly and F. A. Sayed, THz cutoff frequency and multifunction Ti2Ba2Ca2Cu3O10/GaAs photonic band gap materials, Int. J. Mod. Phys. B, 2020, 34(10), 2050091 CrossRef.
- Y. Trabelsi, N. B. Ali, A. H. Aly and M. Kanzari, Tunable high Tc superconducting photonic band gap resonators based on hybrid quasi-periodic multilayered stacks, Phys. C, 2020, 576, 1353706 CrossRef.
- M. Haurylau, S. P. Anderson, K. L. Marshall and P. M. Fauchet, Electrical modulation of silicon-based two-dimensional photonic band gap structures, Appl. Phys. Lett., 2006, 88, 1–3 CrossRef.
- A. H. Aly, H. A. Elsayed, A. A. Ameen and S. H. Mohamed, Tunable properties of one-dimensional photonic crystals that incorporate a defect layer of a magnetized plasma, Int. J. Mod. Phys. B, 2017, 31, 1750239 CrossRef.
- S. M. Shaban, A. Mehaney and A. H. Aly, Determination of 1-propanol, ethanol, and methanol concentrations in water based on a one-dimensional phoxonic crystal sensor, Appl. Opt., 2020, 59(13), 3878–3885 CrossRef PubMed.
- B. Kim, Y. H. Kim, Y. Kim, J. Kang and W. Lee, An anion sensing photonic gel by hydrogen bonding of anions to the N-allyl-N0-ethyl urea receptor, J. Mater. Chem. A, 2014, 2, 5682 RSC.
- Y. Trabelsi, Output multichannel optical filter based on hybrid photonic quasicrystals containing a high-Tc superconductor, Photonic. Nanostruct., 2019, 36, 100724 CrossRef.
- H. A. Arafa, S. E.-S. Abdel Ghany, B. M. Kamal and D. Vigneswaran, Theoretical studies of hybrid multifunctional YaBa2Cu3O7 photonic crystals within visible and infra-red regions, Ceram. Int., 2020, 46(1), 365–369 CrossRef.
- E. Desimoni and B. Brunetti, X-ray photoelectron spectroscopic characterization of chemically modified electrodes used as chemical sensors and biosensors: a review, Chemosensors, 2015, 3, 70–117 CrossRef CAS.
- K. Vijayashanthi and S. Robinson, Two-dimensional photonic crystal based sensor for pressure sensing, Photonic Sens., 2014, 4, 248–253 CrossRef.
- N. R. Ramanujam, H. J. El-Khozondarb, V. Dhasarathan, S. A. Taya and A. H. Aly, Design of one dimensional defect based photonic crystal by composited superconducting material for bio sensing applications, Phys. B, 2019, 572, 42–55 CrossRef CAS.
- J. Kirsch, C. Siltanen, Q. Zhou, A. Revzin and A. Simonian, Biosensor technology: recent advances in threat agent detection and medicine, Chem. Soc. Rev., 2013, 42, 8733–8768 RSC.
- S. Myung, P. T. Yin, C. Kim, J. Park, A. Solanki, P. I. Reyes, Y. Lu, K. S. Kim and K. B. Lee, Label-free polypeptide based enzyme detection using a graphene-nanoparticle hybrid sensor, Adv. Mater., 2012, 24, 6081–6087 CrossRef CAS.
- P. Sharma and P. Sharan, An analysis and design of photonic crystal based biochip for detection of glycosuria, IEEE Sensor. J., 2015, 15, 5569–5575 CAS.
- A. H. Aly and Z. A. Zaky, Ultra-sensitive photonic crystal cancer cells sensor with a high-quality factor, Cryogenics, 2019, 104, 102991 CrossRef CAS.
- Y. Cui and C. M. Lieber, Nanowire nanosensors for highly sensitive and selective detection of biological and chemical species, Science, 2001, 293, 1289–1292 CrossRef CAS PubMed.
- M. Piliarik, M. Vala, I. Tichý and J. Homola, Compact and low-cost biosensor based on novel approach to spectroscopy of surface plasmons, Biosens. Bioelectron., 2009, 24, 3430–3435 CrossRef CAS PubMed.
- J. T. Heeres, S. H. Kim, B. J. Leslie, E. A. Lidstone, B. T. Cunningham and P. J. Hergenrother, Identifying modulators of protein-protein interactions using photonic crystal biosensors, J. Am. Chem. Soc., 2009, 131, 18202 CrossRef CAS.
- J. Hu, X. W. Zhao, Y. J. Zhao, J. Li and W. Y. Xu, Photonic crystal hydrogel beads used for multiplex biomolecular detection, J. Mater. Chem., 2009, 19, 5730 RSC.
- H. Wang, K. Tong, C. Gu, W. Zeng and J. Lu, Two dimensional photonic crystal biosensors, Adv. Mater. Res., 2013, 683, 419 CAS.
- P. Kvasnička, K. Chadt, M. Vala, M. Bocková and J. Homola, Toward single-molecule detection with sensors based on propagating surface plasmons, Opt. Lett., 2012, 37, 163–165 CrossRef.
- S. V. Marchenko, T. A. Sergeyeva, A. L. Kukla, A. S. Pavlyuchenko, E. K. Krasyuk, A. P. Soldatkin and A. V. El'skaya, Application of creatinine-sensitive biosensor for hemodialysis control, Biosens. Bioelectron., 2012, 15, 466–469 Search PubMed.
- S. Robinson and N. Dhanlaksmi, Photonic crystal based biosensor for the detection of glucose concentration in urine, Photonic Sens., 2017, 7, 11–19 CrossRef CAS.
- M. Yunianto, A. N. Permata, D. Eka, D. Ariningrum, S. Wahyuningsih and M. Ahmad, Design of a Fiber Optic Biosensor for Cholesterol Detection in Human Blood, Mater. Sci. Eng., 2017, 176, 012014 Search PubMed.
- S. Poeggel, D. S. Tosi, D. B. Duraibabu, G. Leen, D. McGrath and E. Lewis, Optical fibre pressure sensors in medical applications, Sensors, 2015, 15, 17115 CrossRef PubMed.
- V. R. Dharnidharka, C. Kwon and G. Stevens, Serum cystatin C is superior to serum creatinine as a marker of kidney function: a meta-analysis, Am. J. Kidney Dis., 2002, 40, 221–226 CrossRef CAS PubMed.
- S. S. Waikar, R. A. Betensky and J. V. Bonventre, Creatinine as the gold standard for kidney injury biomarker studies, Nephrol., Dial., Transplant., 2009, 24, 3263 CrossRef CAS PubMed.
- M. Parvesh, P. Ohlsson and I. BjOrkhem, Combined enzymic- Jaffe method for determination of creatinine in serum, Clin. Chem., 1981, 27, 8–21 Search PubMed.
- W. D. Langley and M. Evans, The determination of creatinine with sodium 3,5-dinitrobenzoate, J. Biol. Chem., 1936, 115, 333–341 CAS.
- I. Bjorkhem, R. Blomstrand and G. Ohman, Mass fragmentography of creatinine proposed as a reference method, Clin. Chem., 1977, 23, 2114–2121 CrossRef CAS.
- M. A. Awad and A. H. Aly, Experimental and theoretical studies of hybrid multifunctional TiO2/TiN/TiO2, Ceram. Int., 2015, 45, 19036–19043 CrossRef.
- V. Revathy, C. Boopathi, K. Selvakumar, K. S. J. Wilson, S. A. Taya, A. H. Aly and M. S. M. Rajan, Nonlinear polarization in metal nanocomposite system based photonic crystals, Optik, 2019, 176, 78–84 CrossRef CAS.
- A. H. Aly, S. S. A. Ghany, M. Fadlallah, F. Salman and B. Kamal, Transmission and temperature sensing characteristics of a binary and ternary photonic band gap, J. Nanoelectron. Optoelectron., 2015, 10, 9–14 CrossRef CAS.
- N. Ayyanar, G. T. Raja, M. Sharma and D. S. Kumar, Photonic crystal fiber-based refractive index sensor for early detection of cancer, IEEE Sens. J., 2018, 18, 7093–7099 CAS.
- J. Raveendran J, P. E. Resmi, T. Ramachandran, B. G. Nair and T. G. Satheesh Babu, Fabrication of a disposable non-enzymatic electrochemical creatinine sensor, Sens. Actuators, B, 2017, 243, 589–595 CrossRef.
- C. Zeng, C. Luo, L. Hao and Y. Xie, The research on magnetic tunable characteristics of photonic crystal defect localized modes with a defect layer of nanoparticle, Chin. Opt. Lett., 2014, 12, 11602 CrossRef.
- W. Junge, B. Wilke, A. Halabi and G. Klein, Determination of reference intervals for serum creatinine, creatinine excretion and creatinine clearance with an enzymatic and a modified Jaffé method, Clin. Chim. Acta, 2004, 344, 137–148 CrossRef CAS.
- T. Yao and K. Kotegawa, Simultaneous flow-injection assay of creatinine and creatine in serum by the combined use of a 16-way switching valve, some specific enzyme reactors and a highly selective hydrogen peroxide electrode, Anal. Chim. Acta, 2002, 462, 283–291 CrossRef CAS.
- A. C. Sharma, T. Jana, R. Kesavamoorthy, L. Shi, M. A. Virji, D. N. Finegold and S. A. Asher, A general photonic crystal sensing motif: creatinine in bodily fluids, J. Am. Chem. Soc., 2004, 126(9), 2973 CrossRef PubMed.
- W. M. Nouman, S. E.-S. Abd El-Ghany, S. M. Sallam, A.-F. B. Dawood and H. A. Arafa, Biophotonic sensor for rapid detection of brain lesions using 1D photonic crystal, Opt. Quantum Electron., 2020, 52(287), 1–14 Search PubMed.
- F. Bagci and B. Akaoglu, Enhancement of refractive index sensitivity in photonic crystal waveguide-based sensors by selective infiltration, Acta Phys. Pol., A, 2013, 124, 50 CrossRef CAS.
- A. H. Aly, Metallic and superconducting photonic crystal, J. Supercond. Novel Magn., 2008, 21, 421 CrossRef CAS.
- C. Zeng, C. Luo, L. Hao and Y. Xie, The research on magnetic tunable characteristics of photonic crystal defect localized modes with a defect layer of nanoparticle, Chin. Opt. Lett., 2014, 12, 11602 CrossRef.
- E. Armstrong and C. O. Dwyer, Artificial opal photonic crystals and inverse opal structures–fundamentals and applications from optics to energy storage, J. Mater. Chem. C, 2015, 3, 6109 RSC.
- D. Yang, H. Tian and Y. Ji, High-Q and high-sensitivity width-modulated photonic crystal single nanobeam air-mode cavity for refractive index sensing, Appl. Opt., 2015, 54, 1–5 CrossRef.
- F. Bagci and B. Akaoglu, Enhancement of refractive index sensitivity in photonic crystal waveguide-based sensors by selective infiltration, Acta Phys. Pol., A, 2013, 124, 50 CrossRef CAS.
- I. M. White and X. Fan, On the performance quantification of resonant refractive index sensors, Opt. Express, 2008, 16, 1020–1028 CrossRef.
- M. El Beheiry, V. Liu, S. Fan and O. Levi, Sensitivity enhancement in photonic crystal slab biosensors, Opt. Express, 2010, 1822702–1822714 Search PubMed.
| This journal is © The Royal Society of Chemistry 2020 |


