 Open Access Article
Color-changing intensified light-emitting multifunctional textiles via digital printing of biobased flavin†
Sweta Narayanan Iyer *abcd,
Nemeshwaree Beharybc,
Jinping Guand,
Mehmet Orhan
 a and
Vincent Nierstrasz
 a
a
aTextile Materials Technology, Department of Textile Technology, Faculty of Textiles, Engineering and Business, University of Borås, SE-50190, Borås, Sweden. E-mail: sweta.iyer@hb.se
bENSAIT-GEMTEX, F-59100, Roubaix, France
cUniversité Lille Nord de France, F-59000, Lille, France
dCollege of Textile and Clothing Engineering, Soochow University, Suzhou 215021, China
First published on 22nd November 2020
Abstract
Flavin mononucleotide (biobased flavin), widely known as FMN, possesses intrinsic fluorescence characteristics. This study presents a sustainable approach for fabricating color-changing intensified light-emitting textiles using the natural compound FMN via digital printing technologies such as inkjet and chromojet. The FMN based ink formulation was prepared at 5 different concentrations using water and glycerol-based systems and printed on cotton duck white (CD), mercerized cotton (MC), and polyester (PET) textile woven samples. After characterizing the printing inks (viscosity and surface tension), the photophysical and physicochemical properties of the printed textiles were investigated using FTIR, UV/visible spectrophotometry, and fluorimetry. Furthermore, photodegradation properties were studied after irradiation under UV (370 nm) and visible (white) light. Two prominent absorption peaks were observed at around 370 nm and 450 nm on K/S spectral curves because of the functionalization of FMN on the textiles via digital printing along with the highest fluorescence intensities obtained for cotton textiles. Before light irradiation, the printed textiles exhibited greenish-yellow fluorescence at 535 nm for excitation at 370 nm. The fluorescence intensity varied as a function of the FMN concentration and the solvent system (water/glycerol). With 0.8 and 1% of FMN, the fluorescence of the printed textiles persisted even after prolonged light irradiation; however, the fluorescence color shifted from greenish-yellow color to turquoise blue then to white, with the fluorescence quantum efficiency values (φ) increasing from 0.1 to a value as high as 1. Photodegradation products of the FMN with varying fluorescence wavelengths and intensities would explain the results. Thus, a color-changing light-emitting fluorescent textile was obtained after prolonged light irradiation of textile samples printed using biobased flavin. Furthermore, multifunctional properties such as antibacterial properties against E. coli were observed only for the printed cotton textile while increased ultraviolet protection was observed for both cotton and polyester printed fabrics for the high concentration of FMN water-based and glycerol-based formulations. The evaluation of fluorescence properties using digital printing techniques aimed to provide more sustainable solutions, both in terms of minimum use of biobased dye and obtaining the maximum yield.
1. Introduction
Photoluminescence or fluorescence is the property of certain substances that emit light. The light-emitting phenomenon seen in fluorescent dyes results from the absorption of a lower wavelength of light.1 Fluorescent dyes are functional dyes, and the emission light usually is of higher wavelength than the absorbed light. The fluorescent effect has been widely used in many different fields, such as biological imaging,2 probes,3,4 and textiles;5–7 smart textiles is one such field gaining tremendous attention. The development of photochromic and fluorescent textiles using strontium aluminate pigments has been explored.8 However, due to recent awareness, environmental concerns, and increasing regulations, many fluorescent dyes have been banned.9,10 Hence, an eco-friendly fluorescent dye for textile applications would be necessary.Further, along with the potential of achieving color performances, there has been growing research interest in using environment-friendly dyes due to biodegradability and multifunctional properties such as antimicrobial, antioxidant, deodorizing, anti-UV.11,12 The fluorescent dyes application on textiles using conventional dyeing, coating, and screen printing techniques have been studied.13–15 However, all these techniques do not necessarily fulfill the criteria of green production due to the massive consumption of resources such as water, energy, and waste emissions in water. Thus, it is necessary to move towards more sustainable textile coloration techniques and acquire modification or functionalization of textiles through ultrasonic radiation, microwave radiation, plasma treatment, and digital printing techniques.16–22 In the current study, the focus was to use digital printing techniques for the coloration of textiles using biobased FMN. Digital printing is mainly an inkjet process with a series of print heads spraying the dye or ink onto the fabric.23 The efficient use of raw materials and energy resources in the manufacture and application of ink or chemical can contribute toward green chemistry.24 Riboflavin (RF), widely known as vitamin B2, is an important biological molecule, a naturally occurring compound, and plays a vital role in energy metabolism.25 The natural resources of riboflavin are milk, almonds, meat, etc. and can be isolated from an extensive variety of animals and plants.26 Its derivative flavin mononucleotide (FMN) enzymatically functions as the precursor of riboflavin27 and emits greenish-yellow fluorescence. Its illumination by blue and near-ultraviolet light leads to phototropism and chloroplast migration in plants. The fluorescence properties of FMN in solution form have been widely studied using spectroscopic techniques.28–30 FMN is a non-toxic biobased molecule and constitutes distinctive physicochemical properties such as redox property and photosensitivity.31 The molecule is water soluble due to the presence of ionic phosphate group. The isoalloxazine ring and its conjugation system allow the molecule to possess fluorescence effect and strong absorption peak observed at both ultraviolet and visible regions.32 Various studies have been explored using FMN for biosensors and bioengineering application fields.33,34 Our previous work35 showed FMN's potential use as photoluminescent moiety on cellulosic textile using conventional exhaustion dyeing techniques. In our current study, FMN was printed on textiles using digital printing techniques such as inkjet and chromojet. The research work focused on the photophysical properties of FMN printed on woven textile materials such as cotton duck white (CD), mercerized cotton (MC), and woven polyester (PET), before and after prolonged UV and visible white light irradiation. The ink formulations and their stability were determined using surface tension and viscosity measurements to study the jettability behavior before printing on textiles. Different concentrations of inks were formulated, and Fourier transform infrared spectroscopy (FTIR), UV visible spectroscopy analyses were performed. The light-emitting property of textiles before and after light irradiation was evaluated using fluorescence spectroscopy, and the respective color strength of the printed textile was also measured. Moreover, the fluorescence quantum efficiency (FQE) values were determined theoretically. Besides, multifunctional properties such as UV protection and antibacterial properties were also explored.
2. Experimental details
2.1 Materials and chemicals
All chemicals such as riboflavin 5′-monophosphate sodium salt hydrate widely known as flavin mononucleotide (FMN), surfactant Triton X 100, and glycerol were purchased from Sigma Aldrich and used as received without any further pre-treatment. The substrate material used for printing was cotton duck white woven (CD), mercerized cotton woven (MC) purchased from Whaleys (Bradford Ltd.) having textile weight 170 g m−2 respectively and a 100% plain woven polyester (PET) textile of 160 g m−2 provided by FOV Fabrics AB, Sweden.2.2 Ink preparation
The study was conducted using the ink solution formulated for inkjet and chromojet printing, respectively. Initially, for inkjet printing, the ink solution of 0.1% FMN by weight was prepared using 50% glycerol in an aqueous solution containing 0.3% Triton X 100 (glycerol-based). For chromojet printing, along with glycerol-based (GB), water-based (WB) formulations using deionized water with 0.1, 0.3, 0.5, 0.8, and 1% FMN by weight were prepared, respectively.2.3 Fabrication of fluorescent textile substrates
Further, to eliminate any agglomeration of particles at the orifice or the nozzle path, the ink solutions were filtered through a nylon syringe filter having a pore size of 0.45 μm before loading into the print head. The initial 30 mL of ink solution was purged out to remove any previous traces of ink. The jetting was performed at a temperature of 25 °C, and multiple printhead passes were printed, keeping the jetting voltage and waveform constant. The printed textile samples were then air-dried and conditioned at room temperature for 24 hours for further analysis.
2.4 Sample observation and irradiation
FMN moiety's fluorescence effect on printed textile samples was qualitatively analyzed by observing them under UV light (370 nm) in a closed dark chamber.35 The visual images of printed textiles under the UV chamber were captured using a phone camera with flashlight in the ‘OFF’ mode. Moreover, FMN solutions and the FMN printed textile samples of size 5 × 5 cm were irradiated using UV light (UVI) of 370 nm with approx. 4 W power and visible (VISI) white light in laboratory (power approx. 10 W) for 24 hours. The irradiated FMN printed textile samples were further analyzed qualitatively and quantitatively to study the degradation property of the fluorescent molecule FMN on textiles.2.5 Characterization and measurements
Surface tension and viscosity were analyzed for the formulated ink solution before inkjet printing to evaluate quantitatively and verify the printhead specifications of viscosity range 8–14 mPa s and surface tension between 25–35 mN m−1.36 The ink's surface tension was measured using an optical tensiometer (Attension theta, Biolin scientific). A pendant drop method was used with an ink drop volume of 4 μL, and an average of three independent measurements are reported. The ink's rheological properties were measured using a modular compact Anton Paar rheometer (Physica MCR500, Austria). The viscosity was recorded at the highest measurable shear rate of the instrument 10![[thin space (1/6-em)]](https://www.rsc.org/images/entities/char_2009.gif) 000 s−1 with a temperature range from 20 to 35 °C.
000 s−1 with a temperature range from 20 to 35 °C.
2.6 Evaluation of the photophysical properties
The absorption spectrum of freshly prepared FMN solution and also FMN solution irradiated with UVI and VISI light for 24 hours was studied using Thermo scientific (Evolution 201, USA) UV-visible spectrophotometer. The Fourier transform infrared spectra (FTIR) was recorded on a Nicolet iS10 spectrophotometer (ThermoFisher Scientific) using the KBr pellet technique within the scan range 4000 to 400 cm−1. Further, a quantitative analysis of fluorescent properties for all FMN printed textile samples before and after UVI and VISI light irradiation was analyzed using a Horiba Fluorolog-3 fluorescence spectrophotometer, a monochromated xenon arc lamp was used as an excitation source. The slit width of both excitation and emission was set at 1 nm, and the scan wavelength speed at 1200 nm min−1. The fluorescence emission spectra were scanned in the wavelength range from 385 nm to 700 nm with an increment of 1 nm wavelength having an integration time of 0.1 s. The samples were measured at a fixed excitation wavelength of 370 nm. The fluorescence intensities (S, counts per second – CPS) were normalized to the intensity of light (R, microamps) to minimize the fluctuations over the time of recording.2.7 Colorimetric measurements
The color characteristics of the printed textile samples were evaluated using a Datacolor Check II reflectance spectrophotometer. Reflectance measurements were conducted under D65 illuminant and 10° standard observer on the folded samples (four layers). The color strength was then determined using the Kubelka–Munk eqn (1)
 | (1) |
The K/S values of all FMN printed textile samples before and after UVI and VISI light irradiation were evaluated.
2.8 Evaluation of UV protection
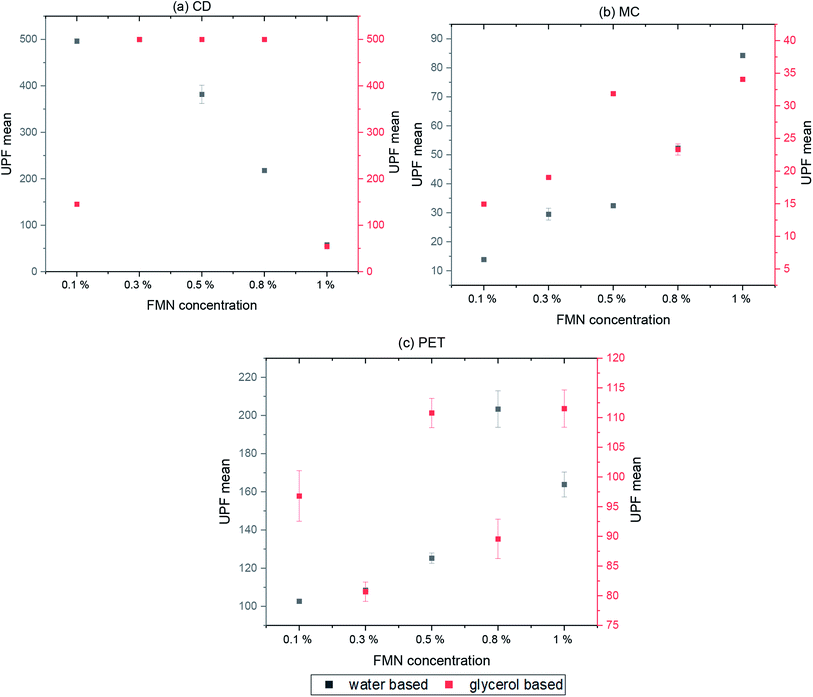
The UV protection properties were evaluated according to the standard GB/T 18830-2009. Four measurements were read at different positions of each printed sample, and the mean values were reported. The ultraviolet protection factor and UV transmittance through the textile samples were measured using Labsphere UV 1000F ultraviolet transmittance analyzer (USA).2.9 Evaluation of antibacterial activities
The antibacterial activity was evaluated as per the standard ASTM 2149 method against Gram-negative Escherichia coli (E. coli, ATCC 25922). The bacterial concentration of about 105 CFU mL−1 was prepared, and samples were placed in 50 mL bacterial suspension. It was shaken in a wrist-action shaker for 24 hours. The viable colonies were counted (in CFU mL−1), and the antibacterial activity was expressed in % reduction of the organisms. The reduction rate (R%) of bacteria was calculated using eqn (2).
 | (2) |
2.10 Fluorescence quantum efficiency
The fluorescence quantum efficiency (FQE) of all the chromojet FMN printed textile samples, before and after UVI and VISI light irradiation was analyzed theoretically using the extended Kubelka–Munk eqn (3).37 The detailed measurement description is provided in our previous studies.35
 | (3) |
 is spectral reflectance of substrate at λ′ wavelength. Rf(λ′) is the difference in spectral reflectance value between forward and reverse measurement at the absorption wavelength. Kf is the absorption coefficient of the dyed samples minus that of the undyed samples. S is the scattering coefficient of the undyed sample in the emission region.
2.11 Stability of ink
All the ink formulations prepared were stored in glass bottles at ambient temperature, and precipitation, if any, was observed. The ink solutions were stable, and no precipitation was observed. Glycerol was used as a viscosity modifier to attain the optimum viscosity level, and the use of nonionic surfactant Triton X 100 contributes to the process of efficient drop formation in a drop on demand print system. The low surfactant concentration was maintained for the surface tension stability in glycerol-based formulations because excess use of surfactant can cause foaming, thus affecting the drop formation and printing performance.383. Results
3.1 Surface tension and viscosity of the printing solution
The surface tension and viscosity are essential characteristics of the printing solution and closely connected to the printing performances.39 The result for viscosity and surface tension were 8.2 mPa s and 27.42 mN m−1, respectively (Fig. SI 1†), which fulfilled the printhead specifications.40 The viscosity of 0.1% GB showed no significant change with an increase in temperature from 20 to 30 °C. The average viscosity of 8.1 mPa s for GB and 3.1 mPa s for WB formulations (Fig. SI 1b†) was obtained, and viscosity remained the same irrespective of varying concentrations. As expected, the surface tension of all WB ink formulations was 72 mN m−1, equivalent to that of surface tension of pure water.3.2 UV-visible spectroscopy and FTIR analysis of FMN solution
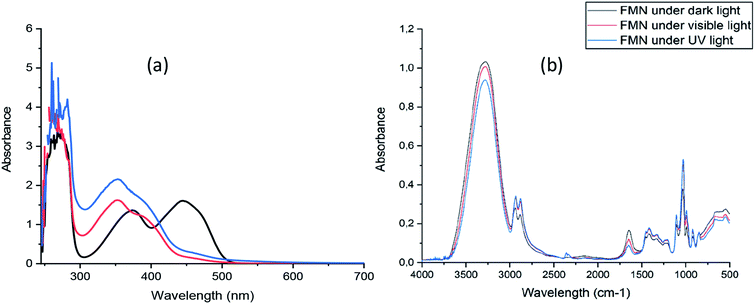
The absorption spectrum of freshly prepared FMN solution showed absorption maxima at 268 nm, 373 nm, and 445 nm, respectively (Fig. 1a).The spectrum of both UV and visible light irradiated FMN solutions exhibited absorption maxima at 260 nm and 353 nm while the absorbance at 445 nm depleted, showing the possible formation of degradation product(s) of FMN such as lumichrome, as the maximum absorbance for lumichrome molecule in aqueous solution41 is observed at 350 nm. However, the FTIR spectra of FMN solution under different light irradiation (Fig. 1b) did not show any changes in the spectra, and the respective absorption band regions are elaborated in section 3.3.2.
3.3 Inkjet printed textile analysis
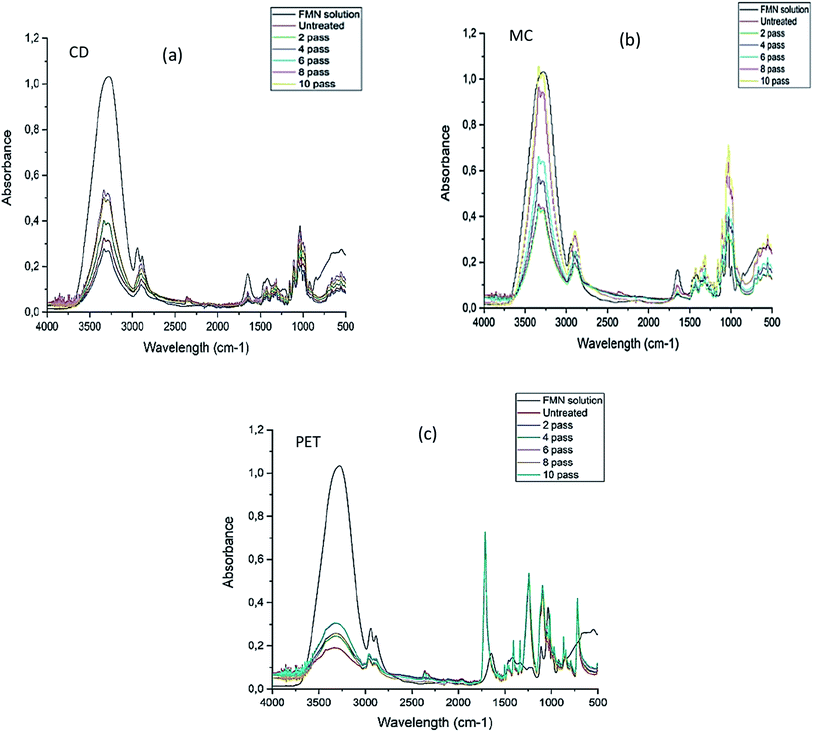
In this section, all the printed textile samples were observed visually under UV light to check the fluorescence effect, and FTIR analysis of all the multi-pass (2, 4, 6, 8, and 10 print passes) printed textiles were analyzed and compared.3.4 Chromojet printed textile analysis
| FMN% in water-based (WB) system | K/S of CD at | K/S of MC at | K/S of PET at | FMN% in glycerol-based (GB) system | K/S of CD at | K/S of MC at | K/S of PET at | ||||||
|---|---|---|---|---|---|---|---|---|---|---|---|---|---|
| 370 nm | 450 nm | 370 nm | 450 nm | 360 nm | 450 nm | 370 nm | 450 nm | 370 nm | 450 nm | 360 nm | 450 nm | ||
| 0.1% | 0.48 | 0.35 | 0.82 | 0.86 | 0.97 | 0.74 | 0.1% | 0.52 | 0.55 | 1.03 | 0.93 | 1.73 | 1.69 |
| 0.3% | 1.44 | 1.53 | 2.58 | 2.91 | 1.71 | 1.94 | 0.3% | 0.39 | 0.36 | 1.24 | 1.25 | 2.10 | 2.47 |
| 0.5% | 1.94 | 2.12 | 1.88 | 2.09 | 1.88 | 2.11 | 0.5% | 0.79 | 0.84 | 1.82 | 1.97 | 2.26 | 2.78 |
| 0.8% | 2.93 | 3.05 | 3.92 | 4.46 | 2.88 | 2.21 | 0.8% | 0.82 | 0.82 | 2.86 | 3.28 | 2.17 | 2.56 |
| 1% | 1.99 | 2.27 | 6.30 | 7.75 | 4.12 | 5.37 | 1% | 0.87 | 0.85 | 2.75 | 3.20 | 2.53 | 2.92 |
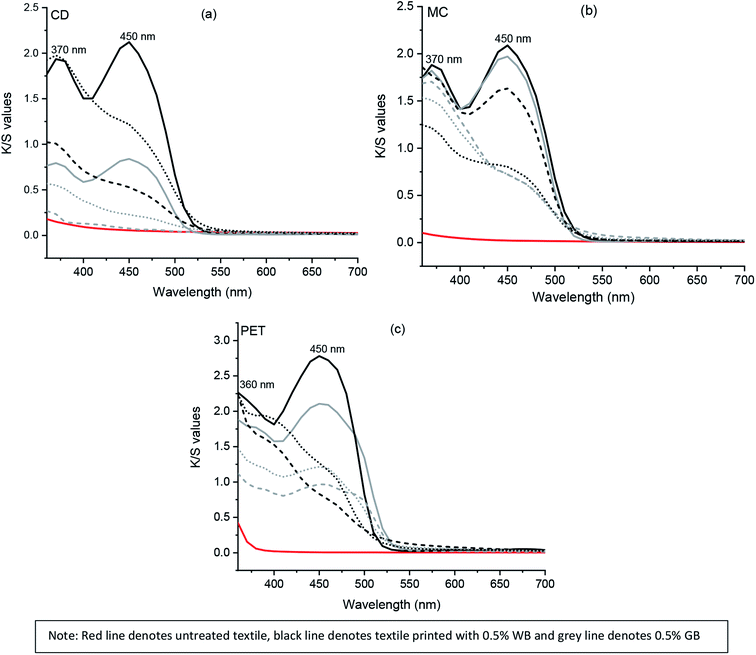
Two prominent absorption peaks at 370 and 450 nm were observed for the cotton textiles (CD and MC) printed using both water and glycerol-based formulations before irradiation, as represented in Fig. 3. However, a decrease in K/S values (Table 4) at both maxima absorbance of 370 and 450 nm was observed after UVI and VISI irradiation. Overall a significant decrease in color strength value at 450 nm was observed for both water and glycerol-based formulations (Fig. SI 4a–h†).
| FMN% in water-based system | K/S of CD at | K/S of MC at | K/S of PET at | FMN% in glycerol-based system | K/S of CD at | K/S of MC at | K/S of PET at | |||||||
|---|---|---|---|---|---|---|---|---|---|---|---|---|---|---|
| 370 nm | 450 nm | 370 nm | 450 nm | 360 nm | 450 nm | 370 nm | 450 nm | 370 nm | 450 nm | 360 nm | 450 nm | |||
| UV-irradiated | 0.1% | 0.38 | 0.19 | 0.39 | 0.19 | 0.65 | 0.24 | 0.1% | 0.36 | 0.20 | 0.37 | 0.18 | 1.10 | 0.22 |
| 0.3% | 0.49 | 0.24 | 2.13 | 1.24 | 1.04 | 0.86 | 0.3% | 0.26 | 0.15 | 0.79 | 0.42 | 1.91 | 0.64 | |
| 0.5% | 1.01 | 0.53 | 1.77 | 1.63 | 1.12 | 0.97 | 0.5% | 0.23 | 0.1 | 1.21 | 0.80 | 2.24 | 0.83 | |
| 0.8% | 2.93 | 1.96 | 3.97 | 2.52 | 3.03 | 3.04 | 0.8% | 0.67 | 0.42 | 1.95 | 1.39 | 2.09 | 0.67 | |
| 1% | 1.64 | 1.02 | 7.55 | 5.59 | 3.26 | 2.90 | 1% | 0.67 | 0.40 | 1.85 | 1.22 | 2.19 | 0.90 | |
| VIS-irradiated | 0.1% | 0.33 | 0.12 | 0.54 | 0.24 | 0.72 | 0.34 | 0.1% | 0.40 | 0.16 | 0.59 | 0.21 | 1.52 | 0.50 |
| 0.3% | 0.72 | 0.28 | 2.41 | 1.22 | 1.10 | 0.99 | 0.3% | 0.31 | 0.12 | 0.79 | 0.30 | 1.96 | 0.86 | |
| 0.5% | 1.97 | 1.22 | 1.70 | 0.72 | 1.47 | 1.21 | 0.5% | 0.55 | 0.23 | 1.51 | 0.72 | 2.23 | 1.27 | |
| 0.8% | 3.00 | 2.03 | 4.09 | 2.09 | 2.58 | 2.23 | 0.8% | 0.77 | 0.36 | 1.99 | 0.91 | 2.11 | 1.05 | |
| 1% | 1.99 | 1.15 | 8.25 | 6.89 | 2.70 | 2.98 | 1% | 0.77 | 0.34 | 1.93 | 0.83 | 2.28 | 1.43 | |
In polyester (PET) printed textile samples, maximum absorption peaks were obtained at 360 and 450 nm before irradiation. The maximum K/S value was observed for PET before irradiation (Fig. 3c) at both 360 and 450 nm, respectively. After UVI and VISI light irradiation of PET textile samples printed using the glycerol-based formulation, a sharp decrease in K/S value at 450 nm was observed. In contrast, PET textile printed using water-based formulation showed absorbance at both 360 and 450 nm even after UVI and VISI light irradiation. However, the K/S values were comparatively lower than that observed before irradiation of PET textile samples (Fig. SI 4i–l†). Although the K/S value for untreated MC textile was 0, both CD and PET textiles possessed minor color strength value at 360 nm.
The color strength (K/S) of chromojet printed textile samples after irradiation for 24 hours under UVI and VISI light (0.1 to 1% FMN) are presented in Table 4. Overall, as shown in Tables 3 and 4, the color strength values were comparatively higher in water-based formulations for all textile (CD, MC, PET) samples. Among the different textile samples, maximum color strength values were observed for mercerized cotton textile (MC) in both water and glycerol-based formulations, followed by polyester (PET) and cotton (CD) textile samples. The difference in color strength value between the two different cotton textiles could be due to morphological differences such as round shaped mercerized cotton (MC) fiber cross-section as compared to the bean-shaped cotton duck white (CD) which can allow higher deposition of FMN on MC textile surface.43
![[thin space (1/6-em)]](https://www.rsc.org/images/entities/char_2009.gif) :
:![[thin space (1/6-em)]](https://www.rsc.org/images/entities/char_2009.gif) water mixture system.
water mixture system.
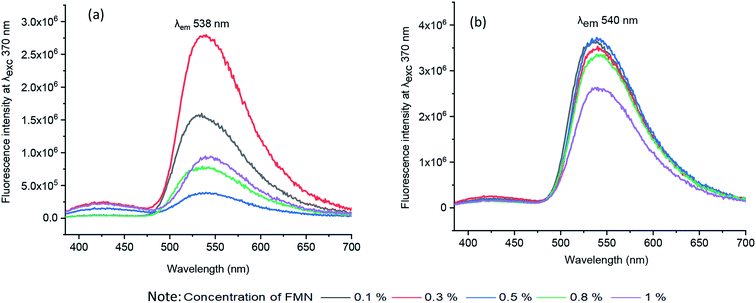 | ||
| Fig. 4 Fluorescence emission spectra of solutions (a) water-based formulation at λex 370 nm (b) glycerol-based formulation at λex 370 nm. | ||
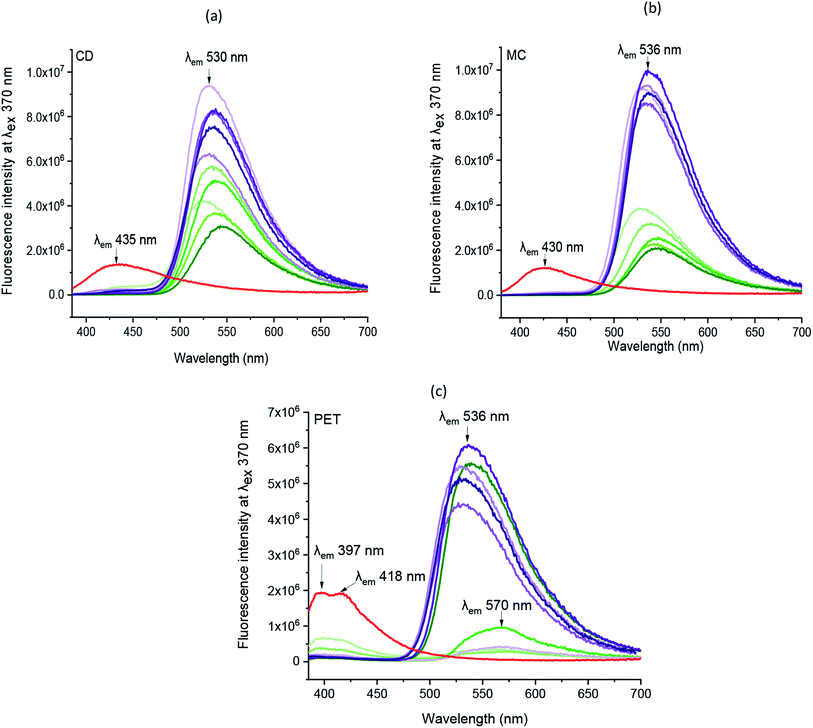
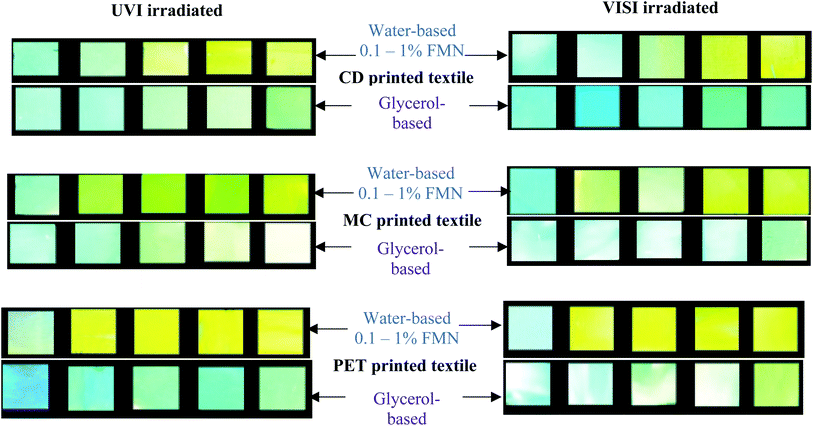
Correspondingly, the emission spectra of all chromojet printed textiles (before irradiation) at λexc 370 nm was evaluated, as shown in Fig. 5 and Table SI 1.† Indeed, without FMN, the untreated cotton (CD, MC) textile samples showed maximum intensity at 435 and 430 nm with intensity values of 1.4 × 10⁶ and 1.2 × 10⁶ CPS/microamps, respectively. The polyester (PET) untreated textile showed maximum fluorescence emission peak at 397 nm with shoulder peak observed at 418 nm with similar intensities around 2 × 10⁶ CPS/microamps. In exposure to UV light, all the three untreated textiles showed blueish fluorescence, as shown in Table 1. All the chromojet printed textile showed maximum intensity in the range of 520–570 nm at 370 nm excitation wavelength (Fig. 5a–c), confirming the FMN fluorescence.31,44
By virtue of the inherent fluorescence property of FMN, overall, both the cotton-based textiles (CD and MC) printed using water and glycerol-based formulations displayed greenish-yellow emission in the wavelength range 520–550 nm.45,46 Besides, the maximum fluorescence intensity observed at wavelength range 550–570 nm corresponds to the yellow fluorescence emission region.47
Both cotton-based textiles (CD and MC) printed using water-based formulations (0.1–1% FMN) showed greenish-yellow fluorescence emission with varying intensity values ranging from 2 × 10⁶ to 6 × 10⁶ CPS/microamps depending upon the concentration. Besides, CD and MC, glycerol-based (0.1–1% FMN) printed textiles also exhibited greenish-yellow fluorescence with intensity values ranging from 6 × 10⁶ to 10 × 106 CPS/microamps. Comparatively, higher fluorescence intensity values were observed for glycerol-based formulations. However, the intensity values either remained the same or decreased with increased FMN concentration for both cotton (CD, MC) water and glycerol-based printed textiles. The decrease in fluorescence with an increase in FMN concentration was observed in solution and textiles due to the quenching effect seen in FMN.29,48
Furthermore, the PET printed textiles using water-based formulations showed inherent fluorescence as that of untreated with maximum intensity around 398 nm (0.1%, 0.3% FMN) along with shoulder peak observed in the range 560–570 nm (Fig. 5c), which indeed was due to lower amount of FMN deposited on the textile surface. In PET printed textiles using water-based formulation due to the increased FMN concentration (0.5%, 0.8%, and 1% FMN), a greenish-yellow to yellow fluorescence emission at a wavelength around 570 nm and 539 nm was observed. However, when glycerol-based formulations (0.1 to 1% FMN) were used, the fluorescence intensity value of 0.43 × 10⁶ CPS/microamps was observed for PET textile (0.1% FMN) at 566 nm revealing yellow fluorescence emission, whereas intensities ranging from 4 × 10⁶ to 6 × 10⁶ CPS/microamps at around 535 nm were observed for PET textiles (0.3 to 1% FMN), thus exhibiting greenish-yellow emission. Hence, the comprehensive quantitative analysis study resembled that of qualitative observations, as shown in Table 2. Moreover, fluorescence images after UVI and VISI irradiation are summarized in Table 5, and quantitative fluorescence analysis of all the chromojet printed textile samples can be seen in Fig. SI 5a–f.† Even after 24 hours of irradiation with UV and visible light, the printed samples showed yellow to blueish-green fluorescence emissions. However, the intensity values varied depending upon the FMN concentration in the printing formulations and the irradiation type to which the printed samples were subjected.
Majority of all the cotton duck (CD) printed textile samples using both glycerol and water-based formulations possessed maximum fluorescence emission around 530–540 nm even after UV (UVI) and visible (VISI) light irradiation (Fig. SI 5a and b†) and intensity values ranging from minimum 1 × 10⁶ to maximum 3 × 10⁶ CPS/microamps.
In the case of UVI samples, the CD textile printed using lower FMN concentration (0.1% WB) showed relatively high intensity at 435 nm due to inherent blue fluorescence; however, a shoulder peak around 500 nm was also observed, which might be due to trace amount of surface FMN. A 6-folded decrease in fluorescence intensities at 530 nm was observed with water and glycerol-based for low FMN concentrations (0.3, 0.5%) and around 3-folded decrease for high FMN concentrations (0.8 and 1%). A similar observation was made for the visible light irradiated printed CD textiles (Table SI 2†).
In the case of VISI samples, CD textile exhibited a sharp fluorescence peak at 540 nm, along with a broad peak observed around 440 to 460 nm wavelength range. However, after visible light irradiation, the samples exhibited two prominent fluorescence peaks obtained around 540 nm and 440 nm, respectively, except at higher FMN concentrations (water-based formulations: 0.5, 0.8 and 1%), the fluorescence intensity around 540 nm was higher, possessing yellow fluorescence. Further, for both water and glycerol-based with low FMN concentration (0.1%, 0.3%), the fluorescence intensities at 440 nm were either higher or equivalent to that of the untreated CD along with shoulder peak observed around 500 nm that explains blue fluorescence observed for some samples.
The mercerized cotton (MC) textile samples at 0.3 to 1% FMN concentrations (water-based) possessed high fluorescence intensity values ranging from 1 × 10⁶ to maximum 4 × 10⁶ CPS/microamps around 540 nm even after UV and visible light irradiation. However, at 0.1% FMN concentrations, a broad peak with low-intensity values about 0.84 and 1.38 × 10⁶ CPS/microamps were observed at 505 and 443 nm, respectively, thus explaining the blue turquoise coloration. At 0.3% FMN concentration (glycerol-based), a broad peak with low fluorescence intensity at 451 nm was observed for VISI sample. At higher FMN concentration, the fluorescence intensity values did not vary significantly for MC textile printed using water-based formulations; however, a 3-folded decrease in intensities was observed in the case of glycerol printed textiles (Table SI 2†).
UV light irradiated PET printed textiles with water-based showed one main fluorescence emission peak around 560 nm exhibiting yellow fluorescence. Except at a low FMN concentration (0.1%), the intensity shift of 20 nm was observed, and the fluorescence emission wavelength was observed at 540 nm along with shoulder peak observed around 400 nm. Further, the glycerol-based PET printed textile showed one main peak around 520 nm, with two shoulder peak around 440 nm and 400 nm for almost all UV irradiated samples (Fig. SI 5c†), except for 0.1% FMN showing the main peak at 423 nm along with shoulder peak around 520 nm, thus corresponding to the blue fluorescence observed.49 The PET printed samples after visible light irradiation (water-based) showed one prominent absorbance peak around 550–560 nm, except at low FMN concentration (0.1%), possessing maximum emission at 400 nm. The glycerol-based also showed one major absorbance peak around 525 nm, exhibiting around 10 nm shift in fluorescence emission from 535 nm before irradiation. A significant 5-folded decrease in intensities of glycerol-based PET-printed textile samples was observed except for 0.1% FMN concentration. However, water-based PET printed textile samples did not show a significant difference in intensity values (Table SI 2†).
| Sample details (water-based) | Fluorescence quantum efficiency of | Sample details (glycerol-based) | Fluorescence quantum efficiency of | |||||||||||
|---|---|---|---|---|---|---|---|---|---|---|---|---|---|---|
| CD | MC | PET | CD | MC | PET | |||||||||
| 370 nm | 450 nm | 370 nm | 450 nm | 360 nm | 450 nm | 370 nm | 450 nm | 370 nm | 450 nm | 360 nm | 450 nm | |||
| Before prolonged light irradiation | 0.1% | 0.32 | 0.30 | 0.19 | 0.17 | 0.58 | 0.38 | 0.1% | 0.27 | 0.21 | 0.17 | 0.17 | 0.19 | 0.15 |
| 0.3% | 0.18 | 0.16 | 0.14 | 0.13 | 0.49 | 0.35 | 0.3% | 0.36 | 0.27 | 0.17 | 0.16 | 0.18 | 0.14 | |
| 0.5% | 0.16 | 0.15 | 0.15 | 0.14 | 0.52 | 0.38 | 0.5% | 0.22 | 0.19 | 0.16 | 0.15 | 0.18 | 0.14 | |
| 0.8% | 0.15 | 0.14 | 0.13 | 0.13 | 0.50 | 0.37 | 0.8% | 0.21 | 0.18 | 0.14 | 0.13 | 0.18 | 0.14 | |
| 1% | 0.16 | 0.15 | 0.13 | 0.12 | 0.20 | 0.17 | 1% | 0.20 | 0.18 | 0.14 | 0.13 | 0.18 | 0.15 | |
| UV-irradiated | 0.1% | 0.64 | 0.84 | 0.50 | 0.66 | 0.59 | 0.33 | 0.1% | 0.52 | 0.57 | 0.50 | 0.68 | 0.43 | 0.63 |
| 0.3% | 0.36 | 0.46 | 0.17 | 0.19 | 0.31 | 0.19 | 0.3% | 1.03 | 1.00 | 0.27 | 0.33 | 0.25 | 0.29 | |
| 0.5% | 0.22 | 0.27 | 0.17 | 0.17 | 0.27 | 0.17 | 0.5% | 0.83 | 0.58 | 0.20 | 0.22 | 0.23 | 0.27 | |
| 0.8% | 0.16 | 0.17 | 0.15 | 0.16 | 0.19 | 0.16 | 0.8% | 0.27 | 0.29 | 0.17 | 0.18 | 0.25 | 0.31 | |
| 1% | 0.19 | 0.21 | 0.14 | 0.14 | 0.19 | 0.17 | 1% | 0.27 | 0.29 | 0.18 | 0.19 | 0.24 | 0.27 | |
| VIS-irradiated | 0.1% | 0.66 | 1.24 | 0.33 | 0.47 | 0.78 | 0.50 | 0.1% | 0.57 | 0.93 | 0.28 | 0.44 | 0.27 | 0.31 |
| 0.3% | 0.27 | 0.40 | 0.17 | 0.20 | 0.27 | 0.17 | 0.3% | 0.31 | 0.45 | 0.25 | 0.37 | 0.24 | 0.25 | |
| 0.5% | 0.19 | 0.21 | 0.19 | 0.26 | 0.25 | 0.19 | 0.5% | 0.25 | 0.33 | 0.19 | 0.24 | 0.21 | 0.20 | |
| 0.8% | 0.16 | 0.17 | 0.16 | 0.18 | 0.19 | 0.17 | 0.8% | 0.25 | 0.34 | 0.18 | 0.22 | 0.21 | 0.21 | |
| 1% | 0.17 | 0.20 | 0.14 | 0.15 | 0.19 | 0.16 | 1% | 0.24 | 0.22 | 0.18 | 0.22 | 0.21 | 0.20 | |
Both cotton textiles (CD and MC) showed quantum efficiency values in the range of 0.1–0.3 for most of the printed samples (water and glycerol-based) before and after UV and visible light irradiation. However, at a lower FMN concentration (0.1 and 0.3%), the efficiency values varied from 0.4 to 1, mainly for light irradiated samples. In the case of PET chromojet printed samples (water-based 0.1 to 1% FMN), higher quantum efficiency values from 0.3 to 0.6 were observed for samples before UV and visible light irradiation; however, FQE values of 0.1 to 0.3 were observed after UV and visible light irradiation. With low FMN concentrations (0.1%), higher quantum efficiency values of 0.3 to 0.7 were obtained. Besides, the glycerol-based PET printed textiles revealed 0.1 to 0.3 FQE values for almost all samples before and after UV and visible light irradiation, except for the 0.1% FMN sample, which showed a higher quantum efficiency value at both absorbance wavelength.
3.5 Multifunctional properties
4. Discussions
The study of fabricating photoluminescent textiles using an inkjet printer allowed a higher amount of FMN deposition on the textile/fiber surface, increasing the number of the print pass from 2 to 10. Hence, we could attain the appropriate conditions by maintaining and assessing the ink formulation's viscosity, which allowed printing FMN on both cotton (CD and MC) and PET textiles using the inkjet printing technique. Further studies carried using the chromojet printing technique were comparatively better. It allowed more surface deposition of the FMN molecule with optimum quantity and a single print, which sufficed due to the large nozzle size. Besides, the advantage of the chromojet technology is the possibility of using formulations with a high range of viscosity, surface tension, water-based liquids, pH ranging from 2 to 13, and high quantities of liquids that could be ejected. Particle size can go upto 7 μm, and the nozzle diameter range is 120 to 280 μm, hence having a broader tolerance of ink viscosity and particle size. The chromojet printing study was done using both water and glycerol-based formulations as the chromojet technique does not possess viscosity restriction for jetting compared to an inkjet printer. Photophysical properties of the ink molecule and all the treated textile samples were investigated in the wavelength range of λ = 350 to 700 nm using UV-visible, fluorescence, and IR spectroscopy. The photo, thermal, and chemical degradation properties of both FMN solutions have already been studied in the literature.58,59The UV-visible spectrum of non-irradiated textile samples showed two prominent peaks 370 nm, 450 nm for cotton printed (CD, MC), and 360, 450 nm for PET printed textiles that can be attributed to the FMN molecule. However, after UV and visible light irradiation, the FMN has undergone photodegradation, and a dominant product, probably lumichrome, was formed, showing maximum absorbance around 350 nm.60 The spectral and the intensity changes indicated that flavin mononucleotide suffers chemical transformations upon UV and visible light irradiation. The isoalloxazine ring of FMN undergoes intramolecular photoreduction wherein the ribityl side-chain serves as the electron donor, and due to oxidation of the side chain, fragmentation may occur, resulting in photoproduct such as lumichrome.61 The enhancement in FMN's degradation rate can be a consequence of the reaction of the excited states of FMN subject to interference by molecular oxygen. Thus, loss of the absorption band at 450 nm reflects the formation of lumichrome, a photolysis product formed after UV and visible light irradiation under aerobic conditions.
Further, the formation of a broad peak around 440–460 nm exhibited by cellulose-based textile after UV and visible light irradiation is consistent with the work described of lumichrome on cellulose.62 Also, the shift of fluorescence observed around 520–525 nm for glycerol-based FMN printed PET textile after UV and visible light irradiation can be due to the formation of crystals of lumichrome which shows fluorescence at 525 nm.63 In cotton (cellulose-based), the shift of fluorescence towards 525 nm could not be observed due to the probable formation of bonds between lumichrome and cellulose as described in previous work,62 which might not be feasible in the case of PET textile fiber.
The evaluation of color strength values for both cotton (CD, MC) and PET textiles showed an increase in K/S values with an increase in FMN concentrations for both water and glycerol-based formulations at respective maxima absorbance wavelength. FMN printed textiles irradiated under UV light with a lower concentration of FMN exhibited degradation but to a much lesser extent than the visible light irradiated textiles. Overall, the K/S values were highest for mercerized cotton-MC chromojet printed textiles, both with glycerol and water-based formulations, followed by polyester-PET and cotton duck white-CD printed textiles.
All treated textiles showed fluorescence emission intensity at around 535 nm as expected for FMN in aqueous solution. The color strength value and the fluorescence intensity varied with an increase in FMN concentration for all chromojet printed textiles. Although the K/S obtained was comparatively low in the glycerol-based formulation, the fluorescence intensity obtained was higher for the glycerol-based formulation, which may be due to FMN being slightly polarized when water is the only solvent. However, the addition of glycerol suppresses the molecule's rotational diffusion, which, in turn, increases the degree of horizontal polarization and increases the fluorescence intensity.47 Also, in the glycerol-based solution, the fluorescence intensity was observed to be constant, even at varying concentrations, which must be due to the stability of the formulation attained in the presence of glycerol water mixture (as shown in Fig. 4b). Thus, the study reveals the relationship between water-based and glycerol-based formulations used for printing. The results indicated that the FMN dye was adsorbed onto the textile fiber surface through hydrogen bonding and van der Waal force of attraction. The OH group present in the cotton substrate can link with the phosphate group of FMN (Fig. 9a).
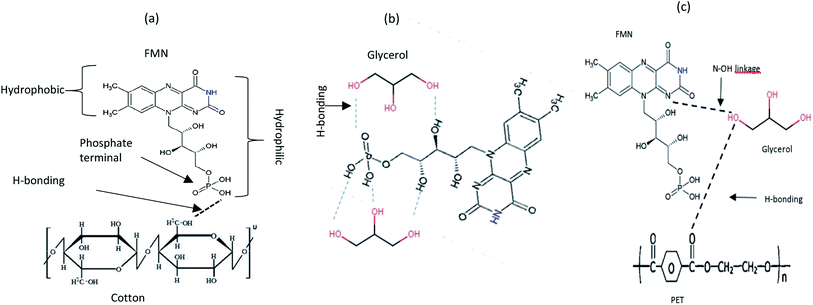 | ||
| Fig. 9 Schematic illustration of the reaction of (a) FMN with the cotton textile surface (b) FMN with glycerol (c) FMN with PET textile surface. | ||
The absorption and the fluorescence phenomena in aqueous solutions and glycerol-based solutions can be explained through hydrogen bonding and intermolecular interactions of the chromophore dyes. Based on the glycerol interaction study with FMN, the hydrogen bonding seems stronger in the presence of FMN:glycerol system (Fig. 9b) than the FMN:water system. The possible N–OH linkage between the –OH of glycerol and the ‘N’ terminal group of FMN could contribute to a more stable system (Fig. 9c). Further, depending upon the textile such as –OH terminal of cotton and C![[double bond, length as m-dash]](https://www.rsc.org/images/entities/char_e001.gif) O of PET can either link with –OH of glycerol and –OH of the phosphate group in FMN (Fig. 9). The fastness properties have to be worked upon; as indicated, the FMN molecules are linked through weak hydrogen bonds only. The photodegradation of FMN using different radiation sources also reflects the influence of light intensity (number of quanta s−1) and wavelengths (UV or visible) depending on the photodegradation reactions.64,65
O of PET can either link with –OH of glycerol and –OH of the phosphate group in FMN (Fig. 9). The fastness properties have to be worked upon; as indicated, the FMN molecules are linked through weak hydrogen bonds only. The photodegradation of FMN using different radiation sources also reflects the influence of light intensity (number of quanta s−1) and wavelengths (UV or visible) depending on the photodegradation reactions.64,65
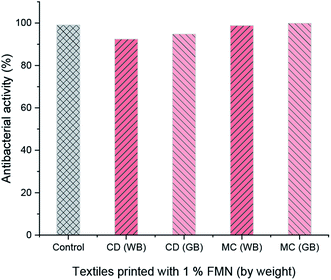
The fluorescence intensity data were in agreement with the changes in the fluorescence effect seen visually under the UV chamber. Although specific UV and visible irradiated samples showed low fluorescence intensity, the samples printed using a higher concentration of FMN (0.8 and 1%) still exhibited fluorescence effect irrespective of prolonged UV and visible light irradiation. The photodegradation property of the riboflavin solution has been studied.64 However, in this study, the light intensity effect of FMN on the textile substrate could be determined, wherein the range of fluorescence from greenish-yellow to yellow and blue fluorescence49 as well as white fluorescence66 could be attained on textiles after UV and visible irradiation. Further, the fluorescence quantum efficiency values also supported the fluorescence effect exhibited by FMN printed textile samples before and after UV and visible light irradiation. Almost all the yellow to greenish-yellow fluorescent textile samples showed FQE values in the range of 0.1 to 0.3. However, higher quantum efficiency values in the range of 0.4 to 1 were observed for blue to white fluorescent samples.66 In addition, the antibacterial property was observed mainly for cotton textiles (CD, MC) and not polyester-based (PET) textile samples, which may be due to the nature of the fiber, as synthetic fiber tend to retain more bacteria compared to natural fibers as it has low or poor adsorbing properties.67
5. Conclusions
Photoluminescent material has gained much attention due to broad application fields, such as biosensors. Various biobased materials exhibit photophysical properties due to the presence of conjugated chains serving as light-emitting units. Flavin mononucleotide is an interesting biobased molecule exhibiting the photophysical property. It has wide applications in medical, health, and other fields. In this study, we could obtain color-changing and multifunctional light-emitting textiles. Before and after irradiation of the FMN printed textiles by UV and visible light for prolonged hours, shifts in fluorescence wavelength(s) were observed. Subsequently, the color-changing light intensities were seen. In combination with FMN and lumichrome, we could observe color varies depending upon the irradiation and shift in fluorescence from green, yellow, turquoise to white. These combinations of a blue and yellow variety of colored fluorescence could be interesting for specific smart textile applications, artistic perspectives related to scientific data.68 Globally, polyester (PET) and cotton are the most produced and consumed textiles69 due to its major industrial applications, and hence the photoluminescent effect was studied on both cotton and polyester textile material. Currently, textile industries are pursuing digital printing technology to make changes from the conventional techniques that consume large quantities of water and energy. Digital printing techniques, such as inkjet and chromojet printing processes, are efficient due to less energy consumption. They can bridge design and technology. Further, the use of the printing technique allowed the deposition of FMN molecule to a sufficient amount on the textile fiber surface, which enabled multifunctional properties such as antibacterial and UV protection along with photoluminescent effect.Conflicts of interest
The authors claim no conflict of interest.Acknowledgements
This research project is financially aided by the European Commission, Erasmus Mundus joint Doctorate program with Specific Grant agreement no. 2016-1353/001-001-EMJD under the framework of Sustainable management and Design for Textiles (SMDTex). Special thanks to Dr Yuyang Zhou for the analysis of UV protection of treated textile samples.References
- K. N. Shinde, S. J. Dhoble, H. C. Swart, and K. Park, Basics of photoluminescence, Phosphate Phosphors Solid-State Light, 2012, ch. 2, pp. 41–60 Search PubMed.
- Y. Tang, et al., Development of fluorescent probes based on protection-deprotection of the key functional groups for biological imaging, Chem. Soc. Rev., 2015, 44(15), 5003–5015 RSC.
- H. Wang, X. Wu, S. Yang, H. Tian, Y. Liu and B. Sun, A rapid and visible colorimetric fluorescent probe for benzenethiol flavor detection, Food Chem., 2019, 286, 322–328 CrossRef.
- P. Gao, W. Pan, N. Li and B. Tang, Fluorescent probes for organelle-targeted bioactive species imaging, Chem. Sci., 2019, 10(24), 6035–6071 RSC.
- A. Kaynak, R. C. Foitzik and F. M. Pfeffer, Fluorescence and conductivity studies on wool, Mater. Chem. Phys., 2009, 113(1), 480–484 CrossRef.
- Y. Yin, R. Huang, G. Bu and C. Wang, Investigation of disperse fluorescent ink formulation via thermal transfer printing for polyester substrate, Text. Res. J., 2017, 87(17), 2146–2153 CrossRef.
- L. Szuster, M. Kaźmierska and I. Król, Fluorescent dyes destined for dyeing high-visibility polyester textile products, Fibres Text. East. Eur., 2004, 12(1), 70–75 CAS.
- T. A. Khattab, M. Rehan and T. Hamouda, Smart textile framework: Photochromic and fluorescent cellulosic fabric printed by strontium aluminate pigment, Carbohydr. Polym., 2018, 195, 143–152 CrossRef CAS.
- X. Ye, Y. Peng, Z. Niu, X. Luo and L. Zhang, Novel approach for the rapid screening of banned aromatic amines in dyed textiles using a chromogenic method, Anal. Bioanal. Chem., 2018, 410(11), 2701–2710 CrossRef CAS.
- A. Bafana, S. S. Devi and T. Chakrabarti, Azo dyes: Past, present and the future, Environ. Rev., 2011, 19(1), 350–370 CrossRef CAS.
- Shahid-Ul-Islam and G. Sun, Thermodynamics, Kinetics, and Multifunctional Finishing of Textile Materials with Colorants Extracted from Natural Renewable Sources, ACS Sustainable Chem. Eng., 2017, 5(9), 7451–7466 CrossRef CAS.
- Y. Zhou and R. C. Tang, Natural Flavonoid-Functionalized Silk Fiber Presenting Antibacterial, Antioxidant, and UV Protection Performance, ACS Sustainable Chem. Eng., 2017, 5(11), 10518–10526 CrossRef.
- K. Baatout, et al., Luminescent cotton fibers coated with fluorescein dye for anti-counterfeiting applications, Mater. Chem. Phys., 2019, 234, 304–310 CrossRef.
- T. A. Khattab, M. Rehan, Y. Hamdy and T. I. Shaheen, Facile Development of Photoluminescent Textile Fabric via Spray Coating of Eu(II)-Doped Strontium Aluminate, Ind. Eng. Chem. Res., 2018, 57(34), 11483–11492 CrossRef.
- L. Liu, C. Qin, R. C. Tang and G. Chen, Dyeing properties and colour characteristics of a novel fluorescent dye applied to acrylic fabric, Fibres Text. East. Eur., 2013, 100(4), 144–147 Search PubMed.
- G. H. Elgemeie, K. A. Ahmed, E. A. Ahmed, M. H. Helal and D. M. Masoud, A simple approach for the synthesis of coumarin fluorescent dyes under microwave irradiation and their application in textile printing, Pigm. Resin Technol., 2016, 45(4), 217–224 CrossRef.
- V. Popescu, et al., Sustainable and cleaner microwave-assisted dyeing process for obtaining eco-friendly and fluorescent acrylic knitted fabrics, J. Cleaner Prod., 2019, 232, 451–461 CrossRef.
- I. Dumitrescu, P. S. Vankar, J. Srivastava, A. N. A. Maria Mocioiu and O. G. Iordache, Dyeing of cotton, silk and wool with Bixa orellana in the presence of enzymes, Ind. Text., 2012, 63(6), 327–333 CAS.
- R. Morent, N. De Geyter, J. Verschuren, K. De Clerck, P. Kiekens and C. Leys, Non-thermal plasma treatment of textiles, Surf. Coat. Technol., 2008, 202(14), 3427–3449 CrossRef CAS http://www.sciencedirect.com/science/article/pii/S0257897207012704.
- Y. Zhou, J. Yu, T. T. Biswas, R. C. Tang and V. Nierstrasz, Inkjet Printing of Curcumin-Based Ink for Coloration and Bioactivation of Polyamide, Silk, and Wool Fabrics, ACS Sustainable Chem. Eng., 2019, 7(2), 2073–2082 CrossRef CAS.
- H. A. El-Wahab, M. M. El-Molla and L. Lin, Preparation and characterisation of ink formulations for jet printing on nylon carpet, Pigm. Resin Technol., 2010, 39(3), 163–169 CrossRef.
- S. N. Iyer, N. Behary, J. Guan, and V. Nierstrasz, Toward Bioluminescent Materials by Plasma Treatment of Micro fibrous Nonwovens, Followed by Immobilization of One or Both Enzyme(s) (Luciferase and FMN Reductase) Involved in Luminescent Bacteria, 2020 Search PubMed.
- B. R. Ig and R. U. S. Se, Printed textile design, 2011, pp. 105–129 Search PubMed.
- R. A. Sheldon, Metrics of Green Chemistry and Sustainability: Past, Present, and Future, ACS Sustainable Chem. Eng., 2018, 6(1), 32–48 CrossRef CAS.
- H. J. Powers, Riboflavin (vitamin B-2) and health 1, 2, 2018, pp. 1352–1360 Search PubMed.
- A. W. Galston, Riboflavin, Light, and the Growth of Plants, 1950, vol. 111, 2893, pp. 619–624 Search PubMed.
- G. F. M. Ball, Flavins: Riboflavin, FMN and FAD (Vitamin B2), 2006, pp. 165–175 Search PubMed.
- H. Grajek, I. Gryczynski, P. Bojarski, Z. Gryczynski, S. Bharill and L. Kułak, Flavin mononucleotide fluorescence intensity decay in concentrated aqueous solutions, Chem. Phys. Lett., 2007, 439(1–3), 151–156 CrossRef CAS.
- S. Astanov, M. Z. Sharipov, A. R. Fayzullaev, E. N. Kurtaliev and N. Nizomov, Spectroscopic study of photo and thermal destruction of riboflavin, J. Mol. Struct., 2014, 1071(1), 133–138 CrossRef CAS.
- H. Zhao, M. Ge, Z. Zhang, W. Wang and G. Wu, Spectroscopic studies on the interaction between riboflavin and albumins, Spectrochim. Acta, Part A, 2006, 65(3–4), 811–817 CrossRef.
- S. Ghisla, V. Massey, J. M. Lhoste and S. G. Mayhew, Fluorescence and Optical Characteristics of Reduced Flavines and Flavoproteins, Biochemistry, 1974, 13(3), 589–597 CrossRef CAS.
- A. Kotaki and K. Yagi, Fluorescence Properties of Flavins, J. Biochem., 1970, 68(4), 509–516 CrossRef CAS.
- M. E. Mertens, et al., FMN-coated fluorescent USPIO for cell labeling and non-invasive MR imaging in tissue engineering, Theranostics, 2014, 4(10), 1002–1013 CrossRef.
- A. Orita, M. G. Verde, M. Sakai and Y. S. Meng, A biomimetic redox flow battery based on flavin mononucleotide, Nat. Commun., 2016, 7, 1–8 CrossRef.
- S. N. Iyer, N. Behary, V. Nierstrasz and J. Guan, Study of photoluminescence property on cellulosic fabric using multifunctional biomaterials riboflavin and its derivative Flavin mononucleotide, Sci. Rep., 2019, 1–16 Search PubMed.
- D. Wallace, Overview of Inkjet-Based Micromanufacturing, 2012, pp. 1–18 Search PubMed.
- T. Shakespeare and J. Shakespeare, A fluorescent extension to the Kubelka-Munk model, Color Res. Appl., 2003, 28(1), 4–14 CrossRef.
- T. T. Biswas, J. Yu, and V. A. Nierstrasz, 12 - Inkjetting of enzymes, in Advances in Textile Biotechnology, A. Cavaco-Paulo, V. A. Nierstrasz and Q. Wang, Woodhead Publishing, 2nd edn, 2019, pp. 279–294 Search PubMed.
- B. Derby, Inkjet Printing of Functional and Structural Materials: Fluid Property Requirements, Feature Stability, and Resolution, Annu. Rev. Mater. Res., 2010, 40(1), 395–414 CrossRef.
- T. T. Biswas, J. Yu, and V. A. Nierstrasz, Inkjetting of enzymes, Elsevier Ltd, 2019 Search PubMed.
- I. Ahmad, Q. Fasihullah and F. H. M. Vaid, A study of simultaneous photolysis and photoaddition reactions of riboflavin in aqueous solution, J. Photochem. Photobiol., B, 2004, 75(1), 13–20 CrossRef.
- V. A. Sichula, Flavins and Their Analogues As Natural and Artificial Catalysts, 2011, p. 168 Search PubMed.
- I. Holme, 9 - Coloration of technical textiles, in Handbook of Technical Textiles, ed. A. R. Horrocks and S. C. Anand, Woodhead Publishing, 2nd edn, 2016, pp. 231–284 Search PubMed.
- H. Grajek, I. Gryczynski, P. Bojarski, Z. Gryczynski, S. Bharill and L. Kułak, Flavin mononucleotide fluorescence intensity decay in concentrated aqueous solutions, Chem. Phys. Lett., 2007, 439(1–3), 151–156 CrossRef.
- J. R. Albani, Chapter 2 - Fluorescence: Principles and Observables, in Structure and Dynamics of Macromolecules: Absorption and Fluorescence Studies, ed. J. R. Albani, Elsevier Science, Amsterdam, 2004, pp. 55–98 Search PubMed.
- M. Abramowitz and M. W. Davidson, Overview of Fluorescence Excitation and Emission Fundamentals, Olympus Microsc. Resour. Cent., 2008, vol. 1, pp. 1–4 Search PubMed.
- J. A. Rivera and J. G. Eden, Flavin mononucleotide biomolecular laser: longitudinal mode structure, polarization, and temporal characteristics as probes of local chemical environment, Opt. Express, 2016, 24(10), 10858 CrossRef.
- I. Ahmad, M. A. Sheraz, S. Ahmed, S. H. Kazi, T. Mirza and M. Aminuddin, Stabilizing effect of citrate buffer on the photolysis of riboflavin in aqueous solution, Results Pharma Sci., 2011, 1(1), 11–15 CrossRef.
- Y. L. Pan, et al., Dynamics of photon-induced degradation and fluorescence in riboflavin microparticles, Appl. Phys. B: Lasers Opt., 2001, 72(4), 449–454 CrossRef.
- I. Ahmad and F. H. M. Vaid, Chapter 2 Photochemistry of Flavins in Aqueous and Organic Solvents, in Flavins: Photochemistry and Photobiology, The Royal Society of Chemistry, 2006, vol. 6, pp. 13–40 Search PubMed.
- W. M. Moore, J. C. McDaniels and J. A. Hen, “the Photochemistry of Riboflavin—Vi. the Photophysical Properties of Isoalloxazines, Photochem. Photobiol., 1977, 25(6), 505–512 CrossRef.
- K. Makdoumi, Ultraviolet Light A (UVA) Photoactivation of Riboflavin as a Potential Therapy for Infectious Keratitis, 2011 Search PubMed.
- G. SM and H. HM, UV Protection Properties of Cotton, Wool, Silk and Nylon Fabrics Dyed with Red Onion Peel, Madder and Chamomile Extracts, J. Text. Sci. Eng., 2016, 6(4), 1–13 Search PubMed.
- A. K. Sarkar, An evaluation of UV protection imparted by cotton fabrics dyed with natural colorants, BMC Dermatol., 2004, 4, 1–8 CrossRef.
- T. Agnhage, et al., Bioactive and multifunctional textile using plant-based madder dye: Characterization of UV protection ability and antibacterial activity, Fibers Polym., 2017, 18(11), 2170–2175 CrossRef CAS.
- D. S. Morais, R. M. Guedes and M. A. Lopes, Antimicrobial approaches for textiles: From research to market, Materials, 2016, 9(6), 1–21 CrossRef.
- A. Ahgilan, V. Sabaratnam and V. Periasamy, Antimicrobial properties of vitamin B2, Int. J. Food Prop., 2016, 19(5), 1173–1181 CrossRef CAS.
- M. A. Sheraz, S. H. Kazi, S. Ahmed, Z. Anwar and I. Ahmad, Photo, thermal and chemical degradation of riboflavin, Beilstein J. Org. Chem., 2014, 10, 1999–2012 CrossRef.
- W. Holzer, et al., Photo-induced degradation of some flavins in aqueous solution, Chem. Phys., 2005, 308(1–2), 69–78 CrossRef CAS.
- S. G. Baldursdóttir, A. L. Kjøniksen, J. Karlsen, B. Nyström, J. Roots and H. H. Tønnesen, Riboflavin-photosensitized changes in aqueous solutions of alginate. Rheological studies, Biomacromolecules, 2003, 4(2), 429–436 CrossRef.
- A. M. Edwards, Structure and General Properties of Flavins, in Flavins and Flavoproteins: Methods and Protocols, ed. S. Weber and E. Schleicher, New York, NY, Springer New York, 2014, pp. 3–13 Search PubMed.
- M. Sikorski, E. Sikorska, I. V Khmelinskii, R. Gonzalez-moreno, J. L. Bourdelande and A. Siemiarczuk, Photophysics of lumichrome on cellulose, J. Photochem. Photobiol., A, 2003, 156, 267–271 CrossRef CAS.
- M. Sikorski, E. Sikorska, F. Wilkinson, and R. P. Steer, Studies of the photophysics and spectroscopy of alloxazine and related compounds in solution, 1999 Search PubMed.
- I. Ahmad, Q. Fasihullah and F. H. M. Vaid, Effect of light intensity and wavelengths on photodegradation reactions of riboflavin in aqueous solution, J. Photochem. Photobiol., B, 2006, 82(1), 21–27 CrossRef CAS.
- I. Ahmad, Z. Anwar, S. A. Ali, K. A. Hasan, M. A. Sheraz and S. Ahmed, Ionic strength effects on the photodegradation reactions of riboflavin in aqueous solution, J. Photochem. Photobiol., B, 2016, 157, 113–119 CrossRef CAS.
- L. G. Coppel, M. Andersson and P. Edström, Determination of quantum efficiency in fluorescing turbid media, Appl. Opt., 2011, 50(17), 2784–2792 CrossRef.
- C. Callewaert, E. De Maeseneire, F. M. Kerckhof, A. Verliefde, T. Van de Wiele and N. Boon, Microbial odor profile of polyester and cotton clothes after a fitness session, Appl. Environ. Microbiol., 2014, 80(21), 6611–6619 CrossRef.
- L. Affatato and C. Carfagna, Smart Textiles: A Strategic Perspective of Textile Industry,, Adv. Sci. Technol., 2012, 80, 1–6 Search PubMed.
- J. W. S. Hearle, Textile Fibers: A Comparative Overview, Encycl. Mater. Sci. Technol., 2001, pp. 9100–9116 Search PubMed.
Footnote |
| † Electronic supplementary information (ESI) available. See DOI: 10.1039/d0ra05533f |
| This journal is © The Royal Society of Chemistry 2020 |

